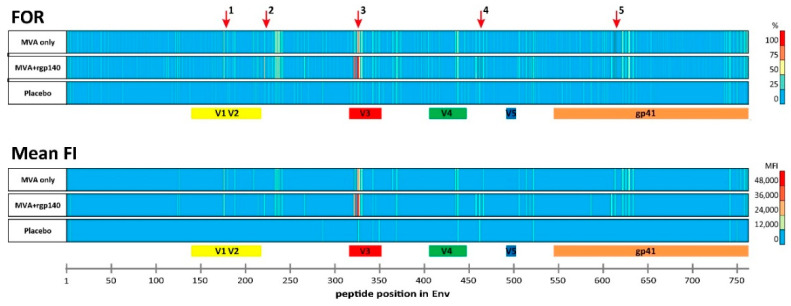
Figure 1.
Heat map of frequency of responders (FOR) and mean fluorescence intensity (FI) plotted against individual antigenic regions along the entire HIV-1 Env as included in the peptide microarray. Heat maps of antigenic regions targeted by Env-specific IgG responses are shown for both vaccination groups and the placebo group four weeks after the last vaccination. Each row represents one of the boosting vaccination arms (HIV-MVA only n = 28; HIV-MVA + CN54rgp140/GLA-AF n = 32) and the placebo arm (n = 11). FI values corresponding to each peptide were mapped to the 10 full-length Env sequences included in the peptide array (HIV primary isolates subtypes A, B, C, CRF01_AE and CRF02_AG, and HIV vaccines HIV-MVA (CRF01_AE) and CN54rgp140 (subtype C)). Responses above 2500 FI after baseline subtraction were considered positive and the maximum FI was selected per position (Supplemental Figure S1). The frequency of positive responses (>2500 FI) was calculated per peptide positions and is given as frequency of responders (FOR) in the upper graph. The mean FI depicted in the lower graph was calculated from the maximum FI per peptide position of each vaccinee per group and is shown for positive responses against peptide positions with a FOR >25%. Immunodominant regions (IDRs) 1–5 are indicated by red arrows and are listed in Table 2.

