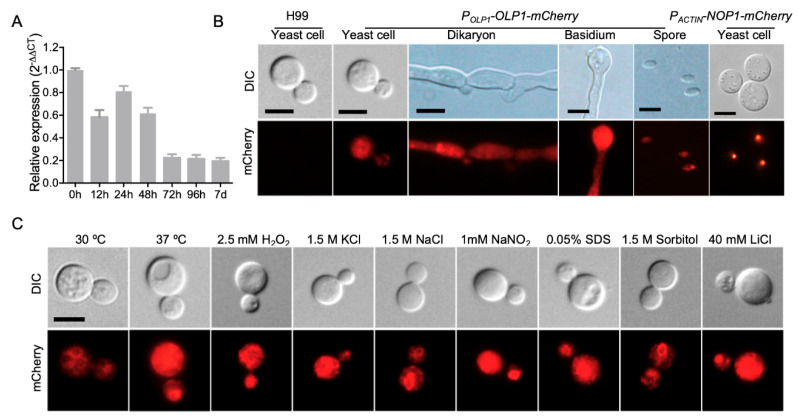
Figure 2.
Expression pattern of the OLP1 gene in C. neoformans. (A) The expression of OLP1 during mating on V8 medium was measured by qRT-PCR. Mating mixtures between H99 and KN99a were harvested from V8 plates after incubation for 0, 12, 24, 48, 72 h, and 7 d. RNAs were purified, cDNA was synthesized, and qRT-PCR was performed. The comparative CT method was used for the relative quantification, and the GAPDH gene was used as an endogenous reference. The error bars show standard deviations of three repeats. (B) Expression and localization of the Olp1-mCherry fusion protein in various development stages of C. neoformans. Representative bright-field and fluorescence images of the yeast cell, dikaryon, basidium, and spores are shown. (C) Subcellular localization of Olp1-mCherry (under control of OLP1 native promoter) in yeast cells under different stress conditions. DIC: differential interference contrast; Bar = 5 μm.

