Abstract
COVID-19 or 2019-nCoV is no longer pandemic but rather endemic, with more than 651,247 people around world having lost their lives after contracting the disease. Currently, there is no specific treatment or cure for COVID-19, and thus living with the disease and its symptoms is inevitable. This reality has placed a massive burden on limited healthcare systems worldwide especially in the developing nations. Although neither an effective, clinically proven antiviral agents' strategy nor an approved vaccine exist to eradicate the COVID-19 pandemic, there are alternatives that may reduce the huge burden on not only limited healthcare systems but also the economic sector; the most promising include harnessing non-clinical techniques such as machine learning, data mining, deep learning and other artificial intelligence. These alternatives would facilitate diagnosis and prognosis for 2019-nCoV pandemic patients. Supervised machine learning models for COVID-19 infection were developed in this work with learning algorithms which include logistic regression, decision tree, support vector machine, naive Bayes, and artificial neutral network using epidemiology labeled dataset for positive and negative COVID-19 cases of Mexico. The correlation coefficient analysis between various dependent and independent features was carried out to determine a strength relationship between each dependent feature and independent feature of the dataset prior to developing the models. The 80% of the training dataset were used for training the models while the remaining 20% were used for testing the models. The result of the performance evaluation of the models showed that decision tree model has the highest accuracy of 94.99% while the Support Vector Machine Model has the highest sensitivity of 93.34% and Naïve Bayes Model has the highest specificity of 94.30%.
Keywords: Machine learning, COVID-19, Decision tree, Pandemic, Dataset
Introduction
The latest pathogenic outbreak of the novel Severe Acute Respiratory Syndrome-Coronavirus two (SARS-CoV-2) is responsible for the global pandemic 2019-nCoV or COVID-19 [24, 25]. The virus originated in the state of Wuhan, China in late December 2019, with evidence that the virus was first detected in bats and get to humans via intermediary hosts such as raccoon or dog and palm civets [21, 30, 32]. Coronaviruses (CoVs) including Middle East Respiratory Syndrome Coronavirus (MERS-CoV) Severe Acute Respiratory Syndrome Coronavirus (SARS-CoV) and 2019 Novel Coronavirus (2019-nCoV) cause various diseases in mammals and birds from enteritis in pigs and cattle, chickens and cattle [17, 28, 51]. When the virus was first detected, the Chinese Diagnosis and Treatment Protocol of the Novel Coronavirus Pneumonia noted that COVID-19 could be detected without positive results of SARS-CoV-2 acid tests using three methods: (1) a positive chest CT scan; (2) significant clinical manifestations include pyrexia (cough), cough, shortness of breath and other indications of lower respiratory tract infection; and (3) laboratory results showing lymphopenia and (optional) leucopenia [46, 47].
Significant symptoms of COVID-19 fever (98%), cough (76%), and diarrhea (3%), which are often more severe in older adults with chronic illnesses [45], and many patients have noted shortness of breath which in many instances appears to be a symptom of the flu [16], 2019-nCoV is spreading exponentially across the globe since it was first recognized in late, 2019 [24, 28]. The pandemic has affected nearly two international conveyance and more than 209 nations and territories around the world [24, 25]. Having been declared a Public Health Emergency of International Concern, the pandemic is transmitted through direct contact with an infected person's bodily fluids either through sneezing and coughing [38]. COVID-19 has neither cure nor approved vaccine, even though the substantial effort is currently being made by scientists and scholars worldwide to find both [21]. Nevertheless, antiviral agents including Remdesivir, hINFa-2b, Ribavirin, Chloroquine, Favipiravir, Arbidol, Lopinavir and Ritonavir are currently being used in clinical trials for COVID-19 [43, 44] and medicinal plants thought to have protective effects on respiratory tract diseases are being used for the management of COVID-19 pandemic [42].
Additionally, asymptomatic cases and lack of diagnosis kits result in delayed or even missed diagnosis, exposing patients, visitors, and healthcare workers to the 2019-nCoV infection. This poses a great threat to the healthcare and economic sectors. Therefore, it is now clear that non-clinical techniques such as machine learning, data mining, expert system and other artificial intelligence techniques must play critical roles in diagnosis and containment of the COVID-19 pandemic. Using non-therapeutic approaches has the potential to reduce the huge burden on health care systems while providing the best diagnostic and predictable methods for 2019-nCoV.
Machine learning (ML) is one of the most advanced concepts of artificial intelligence (AI), and provides a strategic approach to developing automated, complex and objective algorithmic techniques for multimodal and dimensional biomedical or mathematical data analysis [31]. The ML algorithms ara able to read and modify its structure based on a set of observed data with adaptation done by optimizing over a cost function or an objective [14, 39]. ML has already shown potential for diagnosing, detecting, containing, and therapeutic motoring of many diseases [10–12]. ML techniques can be classified in four ways:
Supervised learning techniques are ML learning techniques or algorithms that bind previous and current dataset with the help of labeled data to predict future events [19, 20]. The learning process begins with a dataset training process and develops targeted activity to predict output values [34–36]. The techniques are able to provide results in input data with an adequate training process and compare results with actual results and expectations to identify errors and modify the model according to the results [33, 34].
Unsupervised learning are ML techniques that are used when the training dataset is non-classified or non-labeled [25]. The learning techniques deduce a function to extract hidden knowledge or a pattern from unlabeled dataset [7]. The technique does not identify the proper output but rather extracts observation from the dataset to find hidden patterns from the unlabeled dataset [23, 36].
Semi-supervised learning techniques are learning techniques that lie between supervised learning techniques and unsupervised learning techniques, where, where labeled and non-labeled datasets are used in the training process [7]. Generally, the learning techniques consider a smaller labeled dataset and a larger unlabeled dataset [5]. The learning techniques can be adapted to achieve higher accuracy, and the techniques are preferable when a labeled dataset needs competent and appropriate resources for training or learning in it [1–3, 36, 37].
Reinforcement learning techniques interact with the learning environment by actions to locate errors [7]. Delayed rewards and trial and error searches are some of the common features of the reinforcement learning techniques and the techniques are used to identify the ideal behavior in a specific context to increase the performance of the model [5, 36, 37].
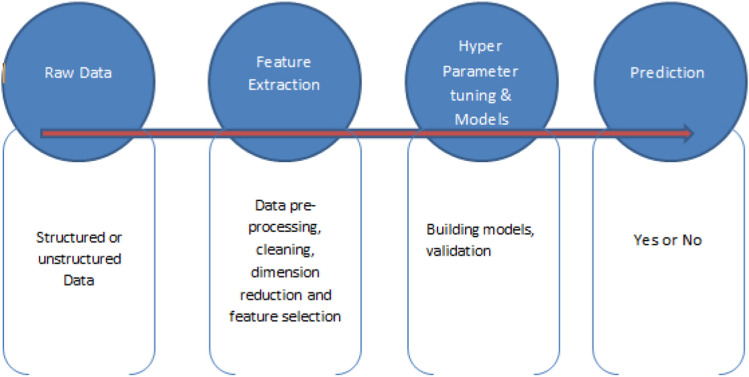
The machine learning process begins with collecting data separately that is, from a variety of resources [50]. After that, the next step is to fix the pre-processed data to fix data-related issues and reduce space size by deleting invalid file data to select interesting data [15]. But Sometime, the value of the dataset might be very for the system to make decision, therefore, machine learning algorithms are designed using others concept such as statistics, theory control and probability etc. to analyze data and extracting useful and novel knowledge or hidden patterns or information from past experiences [50]. The next step is the performance evaluation of the models and finally is model optimization improving the model using new dataset and rules [28]. ML Techniques are being used in a variety of areas such as medicine, engineering, education, manufacturing and production, forecast, traffic management and robot among others [50]. Figure 1 shows the essential learning process for the development of predictive models.
Fig. 1.
Essential learning process for the development of predictive models
Recently, ML techniques are being used analysis of the high dimensional biomedical structured and unstructured dataset. Diagnosis of malaria, typhoid and vascular diseases classification, diabetes risk assessment, genomic and genetic data analysis are some of the examples of biomedical use of ML techniques [50].
In this work, supervised ML techniques are used to develop predictive models for the COVID-19 infection, using an epidemiology labeled dataset for positive and negative COVID-19 cases in Mexico with supervised learning algorithms which include decision tree, logistic regression, and naive Bayes, support vector machine and artificial neural network.
Related Work
Much research has already been done using various artificial intelligence for diagnosing and predicting COVID-19 infection and recovery. In the work of [25] data mining predictive model for COVID-19 patients recovery were developed with four data mining algorithms but however among them, model made of the decision tree has the highest accuracy of 99.85%. In the work of [30] convolutional neural networks that predict novel coronavirus with x-ray images were developed. The deep learning technique, which is one of the sub-branches of ML, inspired by the structure of the human brain is used for the automatic prediction of 2019-nCoV patients. Dataset with chest x-ray images were used, and pre-trained models including InceptionV3, ResNet50 and Inception ResNetV2 were trained and tested on the dataset. The performance result of the study showed that the RestNet pre-trained model gave the highest accuracy among the three models: 98%. Therefore, this shows that the model can help health workers to make decisions in clinical practice with high-performance accuracy, which can also detect 2019-nCoV in the early stages of infection. In the work of [40] a modified susceptible-exposed-infectious-removed (SEIR) Model and ML Model for prediction of the trend of the 2019-nCoV pandemic in China were developed under public health interventions. The models were effective in predicting the pandemic peaks and size. Population migration data before and after 23rd January 2020 and updated 2019-nCoV epidemiological data were integrated into the SEIR Model to derive the pandemic curve. The ML approach was trained on 2003 SARS data to predict the pandemic. In the work of [4] data mining and a deep learning pilot study were carried out to predict 2019-nCoV incidence by levering Google trend data in Iran. Long Short-Term Memory and Linear Regression Models were used to estimate the number of 2019-nCoV positive cases. The models were evaluated with root mean square error (RMSE) metric and 10 folds cross-validation techniques, respectively.. The RMSE of long short-term memory and linear regression Models were 27.187 and 7.562, respectively. Moreover, the study predicted the trend of the 2019-nCoV outbreak. Such predictions can support healthcare managers and policy makers with planning, allocating and deploying healthcare resources effectively. Reference [9] identified an intrinsic 2019-nCoV genomic signature using an ML-based alignment-free approach. This approach incorporated ML-controlled digital signal analysis of genome analysis, augmented decision-making process and Spearman's rank correlation coefficient analysis for validation result. The result of the study corroborates the research hypothesis of a bat as the origin 2019-nCoV pandemic and the study further classifies the pandemic as Sarbecovirus within betacoronavirus. More than 5000 unique genomic sequences from the dataset, totaling 61:8 million bp were analyzed with more than 90% accuracy. In the work of [7] the machine learning-based approach was developed for a real-time forecast of 2019-nCoV outbreak using news alerts reported by Media Cloud and official heath report from Chinese Center Disease for Control and Prevention, internet search activity from Baidu and daily forecast from GLEAM (an agent-based mechanistic model). The approach uses a clustering that enables exploration of geo-spatial synchronicities of 2019-nCoV activities across Chinese provinces. The approach is able to produce an accurate forecast two days ahead of time. The ML-driven approach was also used to predict the severity of the infection in patients. A clinical dataset from Wuhan was proposed in the study, with 15 patients admitted to a hospital in Wuhan, China between January 10th to February, 18th, 2020 being screened. There were 375 patients who were discharged including 201 survivors. The prognostic prediction model based on the ML XGboost algorithm was developed and was tested with 29 patients including 3 patients from other hospitals, who were cleared after 19th February 2020. The model was able to predict the mortality risk of 2019-nCoV patients and clinical route to the recognition of critical cases from severe cases, and more so the model helped the doctors with identification of 2019-nCoV patients and intervention with the model potentially being able to reduce the mortality risk. In the study of [8] ML and Vaxign reverse vaccinology tools were used to predict 2019-nCoV vaccine candidates. The Vaxign reverse vaccinology tool predicted S protein as a likely adhesion while Vaxign ML predicted S protein had a high protective antigenicity score. The predicted vaccine in the study provides new strategies for effective and safe 2019-nCoV vaccine development. Reference [18] presented a data-driven ML approach for the analysis of the 2019-nCoV pandemic from its early infection dynamics especially inflation counter over time, using US data starting from the first case on 20th January 2020. The actionable public health insight was extracted which includes infectious force, rate of the mild infection becoming serious, estimates for asymptomatic infections and prediction of new infections over time. The approach revealed a very significant number of cases of asymptomatic infections of pandemic 2019-nCoV, a lag of about ten days. It was quantitatively confirmed that the infectious force of the virus is strong, with about 0.14% transition from mild to serious infection.
The related works that have been reviewed so far indicate that ML techniques and other artificial intelligence techniques have played important roles in prediction, diagnosis and containment of the COVID-19 pandemic, which can help reduce the huge burden on limited healthcare systems. To the best of our knowledge, no work has been reported so far using epidemiology labeled datasets for positive and negative COVID-19 cases in Mexico for development of supervised ML models for prediction of the COVID-19 infection. Therefore, the present study intends to investigate these gaps.
Materials and Methods
The methodology on how to develop the supervised machine learning models for prediction of the COVID-19 infection using epidemiology dataset in this work has been shown in Fig. 2.
Fig. 2.
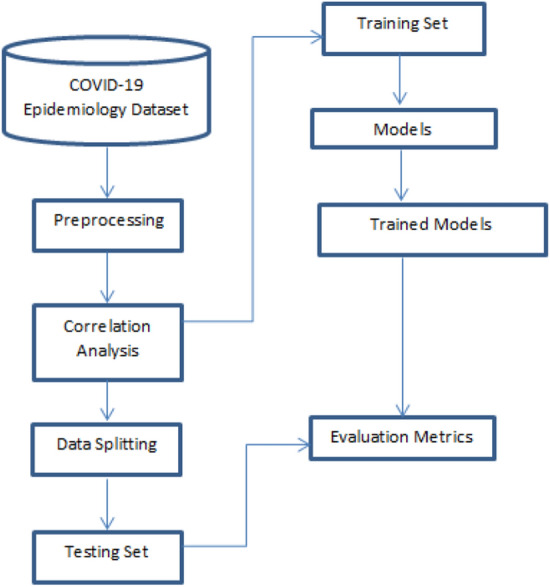
Methodology to build machine learning classification models for COVID-19 infection
Dataset
An epidemiology dataset of positive and negative COVID-19 cases from Mexico is used in this study; the dataset was reported by the General Directorate of Epidemiology, Secretariat of Health in Mexico and made available on their official website [41]. The dataset was obtained from the information of Viral Respiratory Diseases Epidemiological Surveillance System, which was reported by the 475 viral respiratory disease monitoring units (USMER) throughout the country. The dataset contains the lab Reverse Transcription Polymerase Chain Reaction (RT-PCR) testing results for COVID-19 cases in Mexico. The dataset has 263,007 instances or records with 41 features, and it contains demographic and clinical data as well as results of RT-PCR tests for COVID-19 in patients with a viral respiratory diagnosis.
Dataset Preparation and Analysis
The epidemiology dataset of positive and negative COVID-19 cases in Mexico has 41 features/columns written in Spanish. Therefore, the names of the features/columns were translated into English. For the purpose of this work only two (2) demographic features including age and sex and eight (8) clinical features which include pneumonia, diabetes, asthma, hypertension, cardiovascular diseases (CVDs), obesity, chronic kidney diseases (CKDs) and one high-risk factor which is tobacco and RT-PCR test result of COVID-19 in patients dataset were considered. The original dataset encoded 1 for positive and 2 for negative, but for this work we encoded 1 for positive and 0 for negative across the dataset instances including sex data feature which was encoded 1 for male and 0 for female. The dataset has no missing values. Table 1 shows the description of the dataset; Table 2 shows the profile information of the dataset which includes a minimum value, maximum value, mean value and standard deviation of each feature of the dataset while the dataset sample is shown in Table 3. The chart presentation of the profile information of the dataset is shown in Fig. 3, Fig. 4 shows age frequency of the patients, Fig. 5 shows the sex frequency of the patients and Fig. 6 shows the frequency of COVID-19 test results.
Table 1.
Dataset description
| S. No. | Feature | Description | Non-null count | Data type |
|---|---|---|---|---|
| 1 | Age | = > 0 | 263,007 non-null | int64 |
| 2 | Sex | 0 = female, 1 = male | 263,007 non-null | int64 |
| 3 | Pneumonia | 0 = negative, 1 = positive | 263,007 non-null | int64 |
| 4 | Diabetes | 0 = negative, 1 = positive | 263,007 non-null | int64 |
| 5 | Asthma | 0 = negative, 1 = positive | 263,007 non-null | int64 |
| 6 | Hypertension | 0 = negative, 1 = positive | 263,007 non-null | int64 |
| 7 | CVDs | 0 = negative, 1 = positive | 263,007 non-null | int64 |
| 8 | Obesity | 0 = negative, 1 = positive | 263,007 non-null | int64 |
| 9 | CKDs | 0 = negative, 1 = positive | 263,007 non-null | int64 |
| 10 | Tobacco | 0 = negative, 1 = positive | 263,007 non-null | int64 |
| 11 | Result | 0 = negative, 1 = positive | 263,007 non-null | int64 |
Table 2.
Profile information of the dataset
| S. No. | Feature | Minimum | Maximum | Mean | Std. deviation |
|---|---|---|---|---|---|
| 1 | Age | 0 | 120 | 42.59 | 16.90 |
| 2 | Sex | 0 | 1 | 0.49 | 0.50 |
| 3 | Pneumonia | 0 | 99 | 0.17 | 0.81 |
| 4 | Diabetes | 0 | 98 | 0.51 | 6.07 |
| 5 | Asthma | 0 | 98 | 0.38 | 5.80 |
| 6 | Hypertension | 0 | 98 | 0.52 | 5.84 |
| 7 | CVDs | 0 | 98 | 0.38 | 5.91 |
| 8 | Obesity | 0 | 98 | 0.53 | 5.92 |
| 9 | CKDs | 0 | 98 | 0.37 | 5.84 |
| 10 | Tobacco | 0 | 98 | 0.46 | 5.98 |
| 11 | Result | 0 | 1 | 0.39 | 0.49 |
Table 3.
Sample of the dataset
| Age | Sex | PM | DB | AM | HP | CVDs | OB | CKDs | TB | Result |
|---|---|---|---|---|---|---|---|---|---|---|
| 74 | 0 | 0 | 1 | 0 | 1 | 0 | 1 | 0 | 0 | 0 |
| 71 | 1 | 0 | 1 | 0 | 1 | 0 | 1 | 0 | 1 | 0 |
| 50 | 0 | 1 | 0 | 0 | 0 | 0 | 0 | 0 | 0 | 1 |
| 25 | 1 | 0 | 0 | 0 | 0 | 0 | 1 | 0 | 0 | 1 |
| 28 | 1 | 0 | 0 | 0 | 0 | 0 | 0 | 0 | 0 | 0 |
| 67 | 0 | 0 | 0 | 0 | 1 | 0 | 1 | 0 | 1 | 0 |
| 44 | 1 | 0 | 0 | 0 | 0 | 0 | 1 | 0 | 1 | 0 |
| 62 | 0 | 0 | 0 | 0 | 0 | 0 | 1 | 0 | 0 | 0 |
| 30 | 1 | 0 | 0 | 0 | 0 | 0 | 0 | 0 | 0 | 0 |
| 30 | 0 | 0 | 0 | 0 | 0 | 0 | 0 | 0 | 0 | 0 |
Fig. 3.
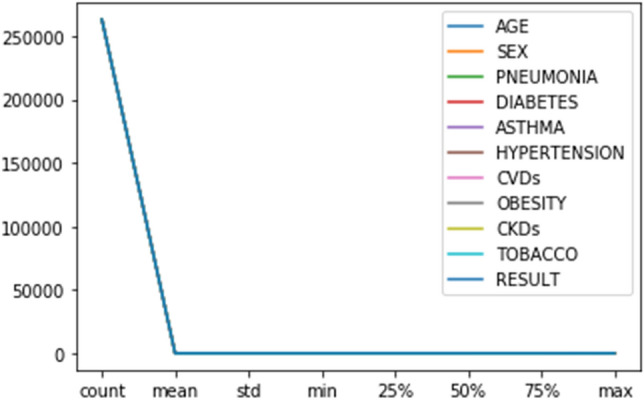
Chart presentation of the profile information of the dataset
Fig. 4.
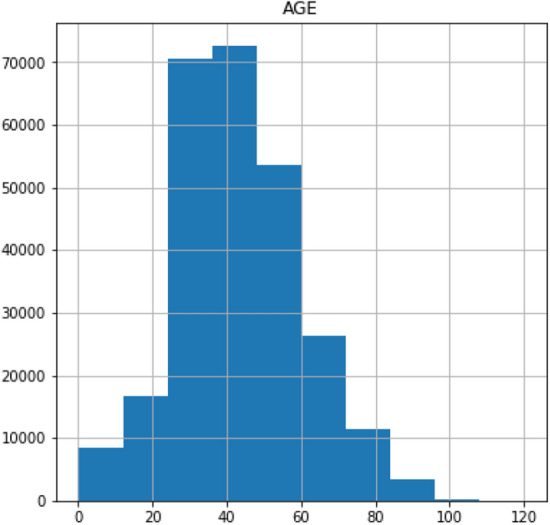
Age frequency of the patients
Fig. 5.
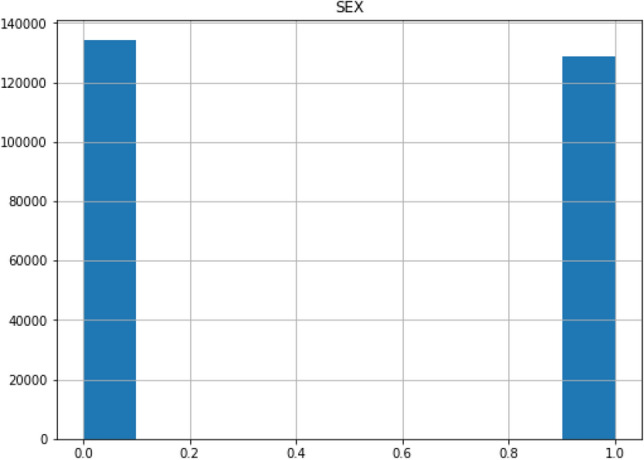
Sex frequency of the patients
Fig. 6.
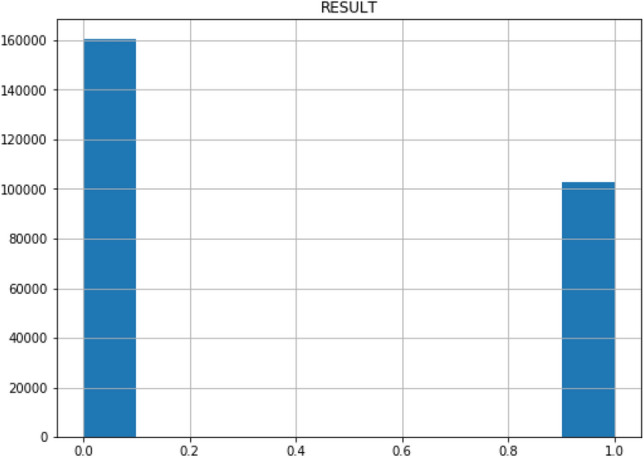
COVID-19 Result frequency of the patients
Supervised Machine Learning Algorithm
Supervised learning techniques need humans to provide input and required output respectively, in addition to providing feedback about the accuracy of the prediction in the training process [15]. In this work, naive Bayes, logistic regression and decision tree supervised learning algorithms would be used to develop the prediction model of COVID-19 infection using an epidemiology labeled dataset for positive and negative COVID-19 cases in Mexico.
Naïve Bayes Algorithm
The ML Naïve Bayes algorithm is used for classification learning tasks in which instances of the dataset are discriminated based on the specified feature [1]. The algorithm is probabilistic in nature and at the same time is based on Bayes Theorem [2]. The Eq. (1) below shows Bayes Theorem:
| 1 |
Logistic Regression Algorithm
Logistic Regression ML algorithm is used for classification learning tasks in which the association versus categorical dependent features against independent features are determined [3, 4, 13]. The learning algorithm is used when the dependent features has binary values such as 0 and 1, true or false, negative or positive, and no or yes [8]. Below is the logistic regression algorithm mathematical Eq. (2) used to calculate the association between dependent features and independent attributes or features of the dataset:
| 2 |
Decision Tree Algorithm
Decision tree ML algorithm is used to divide learning activities where the tree is constructed by dividing the dataset into smaller sets until each partition is clean and pure and the data classification depends on the type of data [22, 23]. The partition of the dataset attribute of numerical data type (B) ≤ z, where z is the value of B domain for the entire categorical attribute of the data type partition C, form the values of (C), D ∈ E when E is a small set (B). To remove noise from the dataset, the pruning method process is used for the final construction of the tree when fully grown [11, 25]. The decision tree algorithm has been used as one of the most effective learning algorithms due to its ability to handle all types of data (continuous types and detailed data), comprehension and simplicity [27].
Support Vector Machine
Support vector machine (SVM) is a learning algorithm that is being used for regression and classification learning tasks. The dataset points are represented in space in SVM and are divided into points and groups with similar structures that fall into the same groups [49]. The data are considered p-dimensional for linear SVM that can be partitioned by the size of p-1 planes known as hyper planes [48]. Therefore, the planes divide the set of boundaries and data space among the data groups for regression or classification learning task [5] as shown in Fig. 7. The best option is selected based on the distance between the divided classes [48]. Therefore, the plane with the highest limit between these two categories is called maximum margin hype aircraft.
Fig. 7.
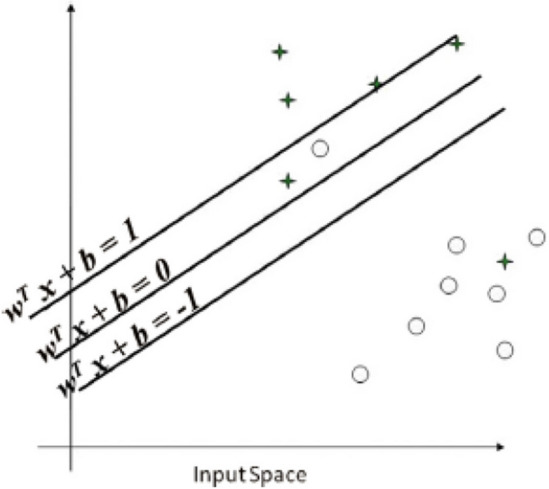
Representation of SVM
The n data point is defined as:-
| 3 |
The real vector is represented by which can be either be − 1 or 1, which is representing . Hyper plane is built so as to reduce the distance between y − 1 and y = 1 class, respectively, which are defined in Eq. (4) below:-
| 4 |
The normal vector is represented by while the offset of hyper place along is represented by .
Artificial Neural Network (ANN)
ANN imitates the functions and activities of the brain of human being which is identified as the nodes, which is technically known as or called artificial neurons [48]. The neurons communicate and transmit data and information among themselves in form of 0 s and 1 s or combination and each neuron has a specific weight given to it, which indicates its functions and roles to play in the system [48, 49]. The structure of ANN is divided into layers, right from data reception layer, input layer, middle or hidden layer to output layer which is called extraction or classification layer. Each layer has a specific function to perform and transform data into the relevant information to get the ultimate and optimum result [50]. The Activation and transfer function plays a critical role in the activities carry out by neurons. The transfer function added all the weighted input as:
| 5 |
Thus b represents the value of bias, which is often 1 value.
Correlation coefficient analysis
Correlation coefficient analysis is used to determine a strong relationship between two sets of dataset features which can be either dependent and independent features or variables [6, 26]. Therefore, the value r is a finite number between − 1 and + 1 which shows the strong relationship between two sets of dependent and independent features or variables [29]. The relationship can be positive if the number is positive; likewise, the relationship can be negative if the number is negative. The idea behind the correlation coefficient analysis approach is that the importance of a relevant feature set in a dataset can be determined by evaluating a strength relationship between dependent and independent features [6, 29]. A feature set is considered good for ML model if the dependent features are correlated with the independent features [26]. The feature can be evaluated by Eq. (3) below:-
| 6 |
where the Importance is the correlation coefficient between dependent feature set and independent feature and is the ranking criteria for evaluating the set of feature, (avg(corrfc)) is the average of the correlation between the dependent feature and the independent feature, avg(corrff) is the average of the correlation between feature set, and k is the number of features.
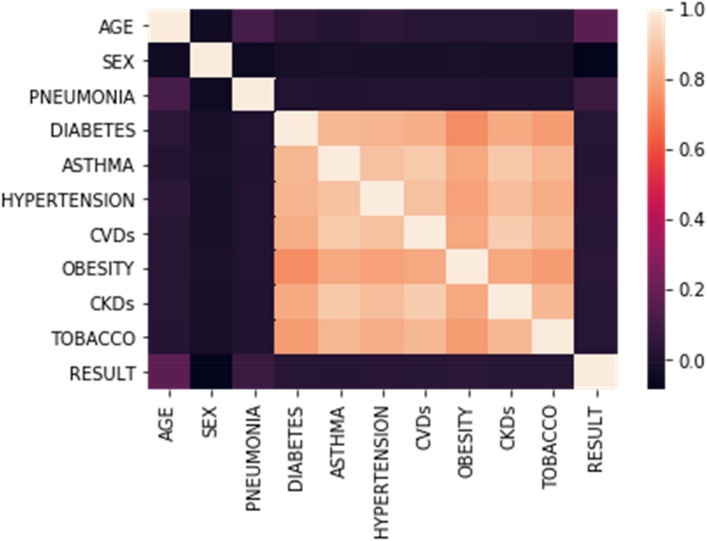
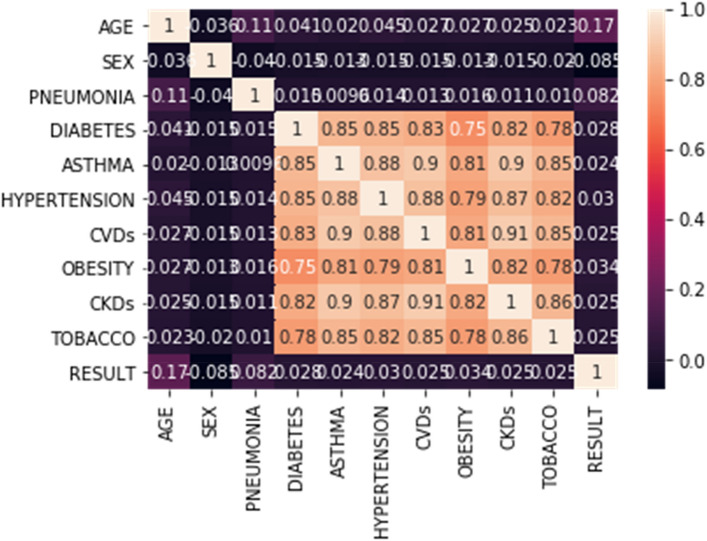
In this study, the correlation coefficient analysis between the various dependent and independent features was carried out to determine a strong relationship between each dependent feature and independent feature of the dataset. Figure 8 shows the scatterplot correlation coefficient of the various dependent features, including age, sex, pneumonia, diabetes, asthma, hypertension, CVDs, obesity, CKDs and tobacco use, against the result, which is an independent feature of the dataset. Figure 9 shows the corresponding correlation matrix of the independent dataset features against dependent features. Table 4 shows the relationship value (r value) of each dependent feature against the independent feature.
Fig. 8.
Scatterplot correlation coefficient of the feature of the dataset
Fig. 9.
The correlation matrix of the dataset features
Table 4.
r value and the status of correlation coefficient
| S. No. | Dependent feature | Independent feature | r value | correlation coefficient relationship |
|---|---|---|---|---|
| 1 | Age | RT-PCR COVID-19 test result | 0.17 | Weak positive correlation coefficient relationship |
| 2 | Sex | RT-PCR COVID-19 Test Result | 0.085 | Weak positive correlation coefficient relationship |
| 3 | Pneumonia | RT-PCR COVID-19 test result | 0.082 | Weak positive correlation coefficient relationship |
| 4 | Diabetes | RT-PCR COVID-19 test result | 0.028 | A weak positive correlation coefficient relationship |
| 5 | Asthma | RT-PCR COVID-19 test result | 0.024 | A weak positive correlation coefficient relationship |
| 6 | Hypertension | RT-PCR COVID-19 Test Result | 0.03 | A weak positive correlation coefficient relationship |
| 7 | CVDs | RT-PCR COVID-19 test result | 0.025 | A weak positive correlation coefficient relationship |
| 8 | Obesity | RT-PCR COVID-19 test result | 0.034 | A weak positive correlation coefficient relationship |
| 9 | CVDs | RT-PCR COVID-19 test result | 0.025 | Weak positive correlation coefficient relationship |
| 10 | Tobacco | RT-PCR COVID-19 test result | 0.025 | Weak positive correlation coefficient relationship |
Experimental Setup
The supervised machine learning algorithms were executed using a python programming language in window operating system environment deployed HP Branded computer system (Laptop), Corei5 with 8 GB of Ram and 2.8 GHz processor speed. All the necessary libraries were installed on python notebook and used for the data analysis including correlation analysis and development of the models.
Predictive Models for COVID-19 Infection
The supervised ML models for COVID-19 infection were developed with a decision tree, logistic regression, naive Bayes. SVM and ANN machine learning algorithms with an epidemiology dataset for positive and negative COVID-19 cases in Mexico. Before the development of the model, the correlation coefficient analysis between the various dependent and independent features was carried out to determine a strong relationship between each dependent feature and independent feature of the dataset. Table 4 shows the relationship value (r value) of each dependent feature against the independent feature of the dataset. All the dependent features have a positive correlation coefficient relationship with the independent feature of the dataset. However, it is a weak positive correlation coefficient relationship that all dependent features have on independent feature.
The epidemiology dataset for positive and negative COVID-19 cases in Mexico been partitioned into training and testing sets. Therefore, the model were trained the models with 80% training data and tested with the remaining 20% of the dataset. Five different models were developed using machine learning classification algorithms to predict whether the patient is infected with COVID-19 or otherwise using ML classification algorithms which include decision tree, logistic regression, naive Bayes, SVM and ANN.
The models were evaluated using an accuracy, sensitivity and specificity performance evaluation metric to determine their efficiency and quality.
The accuracy evaluation metric shows the percentage of the dataset instances correctly predicted by the model developed by the machine learning algorithm [28]. The accuracy is expressed in the equation below (7).
| 7 |
While, sensitivity evaluation metric shows the percentage of COVID-19 positive patients correctly by the models, as it is expressed in the equation below (8).
| 8 |
More so, the specificity evaluation metric shows the percentage of COVID-19 negative patients correctly by the models, as it is expressed in the equation below (9).
| 9 |
where tp is the true positive, tn is the true negative, fp is the false positive while fn is the false negative.
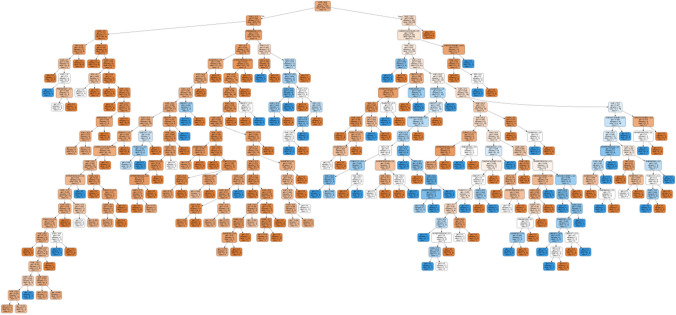
Figure 10 shows the decision tree model for prediction of COVID-19 Infection.
Fig. 10.
Decision tree model for prediction COVID-19 infection
Results and Discussion
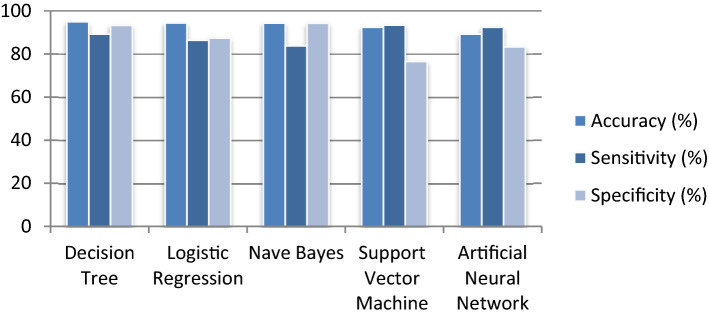
Early prediction of COVID-19 can be helpful in reducing the huge burden on healthcare systems by helping to diagnose COVID-19 patients. In this work, decision tree, logistic regression and naive, SVM and ANN supervised learning classification models for prediction of COVID-19 infection using an epidemiology dataset for positive and negative COVID-19 cases in Mexico were developed. The performance of all models was evaluated based on accuracy parameters. The performance result of the models is shown in Table 5 and Fig. 11 respectively.
Table 5.
Performance evaluation result
| S. No. | Model | Accuracy (%) | Sensitivity (%) | Specificity (%) |
|---|---|---|---|---|
| 1 | Decision tree | 94.99 | 89.2 | 93.22 |
| 2 | Logistic regression | 94.41 | 86.34 | 87.34 |
| 3 | Naive bayes | 94.36 | 83.76 | 94.3 |
| 4 | Support vector machine | 92.4 | 93.34 | 76.5 |
| 5 | Artificial neural network | 89.2 | 92.4 | 83.3 |
Fig. 11.
Performance evaluation result
The model developed with decision tree happened to be the best model among all models developed in terms of accuracy with 94.99% when compared with other models developed with logistic regression, naive Bayes, SVM and ANN which have 94.41%, 94.36%, 92.40% and 89.20% accuracy respectively. While for sensitivity which shows the percentage of COVID-19 positive patients correctly by the models, SVM emerged to be the best model among all models with 93.34%, followed by ANN Model which has 92.40% then Decision Model which has 89.20%, then logistic regression model which has 86.34% and followed by Naïve Beyes Model which has least with 83.76%. More so, for specificity which shows the percentage of COVID-19 negative patients correctly by the models, Naïve Bayes model emerged to be the best model among all models with 94.30%, followed by decision tree model which has 93.22% then logistic regression model which has 87.34%, then ANN model which has 83.30% and followed by SVM model which has least of 76.50%.
Decision tree model indicated that age feature is the most important feature among all the dependent features of the dataset including the clinical features. The model indicates that most of the people above the age of 45 are prone to be infected with SARS-CoV-2 when compared to people with lower ages. Similarly, people that are suffering from pneumonia, CKDs, CVDs, diabetes, asthma, obesity and hypertension more likely to be infected with COVID-19. Regarding gender, males are more susceptible to COVID-19 infection than females, and those who smoke tobacco are more likely to be infected than non-tobacco smokers. The model will help the health workers with a diagnosis of the suspected COVID-19 patients, and this will supplement RT-PCR COVID-19 testing thereby reducing the huge burden on healthcare systems.
The supervised ML models can be used as retrospective evaluation techniques or tools to validate COVID-19 infection cases. This study shows how ML Predictive COVID-19 infection models can be developed, validated and used as the tools for rapid diagnosis of COVID-19 infection cases. The study also shows the important roles playing by supervised ML algorithms in prediction, diagnosis and containment of the COVID-19 pandemic, which can help reduce the huge burden on limited healthcare systems in most of the nations around the world, especially developing nations.
Conclusion
The COVID-19 pandemic now appears to be endemic like other communicable diseases including HIV/AIDs, Tuberculosis, Measles and Hepatitis. It has affected nearly 213 countries and territories worldwide and 2 international conveyances thereby leading the World Health Organization (WHO) to declare the disease a public health emergency of international concern. COVID-19 is transmitted through direct contact with an infected person via sneezing and coughing and has no medically approved vaccine or medication. Non-clinical techniques such as ML techniques are being used as an alternative means for diagnosis and prognosis of 2019-nCoV pandemic patients with a view to complementing and reducing the huge burden on limited healthcare systems in almost all countries around the world, with the aim of reviving the deeply affected economic sector. Supervised ML models for COVID-19 infection were developed in this work with a decision tree, logistic regression and naive Bayes learning algorithms using an epidemiology labeled dataset of positive and negative COVID-19 cases in Mexico. The models were trained with 80% training data and tested with the remaining 20% of the data. The model developed with decision tree happened to be the best model among all models developed in terms of accuracy with 94.99%. In contrast, SVM and naive Bayes models emerged to be the best models among all models in terms of sensitivity and specificity with 93.34% and 94.30% respectively.
Funding
No funding sources.
Compliance with Ethical Standards
Conflict of interest
Authors have declared that no conflict of interest exists.
Footnotes
This article is part of the topical collection “Advances in Computational Approaches for Artificial Intelligence, Image Processing, IoT and Cloud Applications” guest edited by Bhanu Prakash KN and M. Shivakumar.
Publisher's Note
Springer Nature remains neutral with regard to jurisdictional claims in published maps and institutional affiliations.
Contributor Information
L. J. Muhammad, Email: lawan.jibril@fukashere.edu.ng
Ebrahem A. Algehyne, Email: e.algehyne@ut.edu.sa
Sani Sharif Usman, Email: ssu992@fukashere.edu.ng.
Abdulkadir Ahmad, Email: aayola99@gmail.com.
Chinmay Chakraborty, Email: cchakrabarty@bitmesra.ac.in.
I. A. Mohammed, Email: ibrahimsallau@gmail.com
References
- 1.Adrien PG, Yunpeng G, Gregory M, et al. A comparison of supervised machine learning algorithms for mosquito identification from backscattered optical signals. Ecol Inform. 2020;58:101090. doi: 10.1016/j.ecoinf.2020.101090. [DOI] [Google Scholar]
- 2.Ahmad IS, Bakar AA, Yaakub MR, et al. A survey on machine learning techniques in movie revenue prediction. SN Comput Sci. 2020;1:235. doi: 10.1007/s42979-020-00249-1. [DOI] [Google Scholar]
- 3.Asadi H, Dowling R, Yan B, Mitchell P, et al. Machine learning for outcome prediction of acute ischemic stroke post intra-arterial therapy. PLoS ONE. 2014;9:2. doi: 10.1371/journal.pone.0088225. [DOI] [PMC free article] [PubMed] [Google Scholar]
- 4.Ayyoubzadeh SM, Ayyoubzadeh SM, Zahedi H, et al. Predicting COVID-19 incidence through analysis of Google trends data in Iran: data mining and deep learning pilot study. JMIR Public Health Surveill. 2020;6(2):e18828. doi: 10.2196/18828. [DOI] [PMC free article] [PubMed] [Google Scholar]
- 5.Daniel R, Schrider A, Kern D. Supervised machine learning for population genetics: a new paradigm. Trend Genet. 2018;34–4:301–312. doi: 10.1016/j.tig.2017.12.005. [DOI] [PMC free article] [PubMed] [Google Scholar]
- 6.Deborah JR. How to Interpret a Correlation Coefficient r. Dummies. https://www.dummies.com/education/math/statistics/how-to-interpret-a-correlation-coefficient-r/. Accessed 12th Jul 2020.
- 7.Dianbo L, Leonardo C, Canelle P et al. (2020) A machine learning methodology for real-time forecasting of the 2019–2020 COVID-19 outbreak using Internet searches, news alerts, and estimates from mechanistic models, https://arxiv.org/abs/2004.04019.
- 8.Edison O, Mei UW, Anthony H et al. (2020) COVID-19 coronavirus vaccine design using reverse vaccinology and machine learning. bioRxiv preprint doi: https://doi.org/10.1101/2020.03.20.000141. [DOI] [PMC free article] [PubMed]
- 9.Gurjit SR, Soltysiak MPM, El Roz H, de Souza CPE, Hill KA, Kari L. Machine learning using intrinsic genomic signatures for rapid classification of novel pathogens: COVID-19 case study, bioRxiv 2020.02.03.932350; doi: https://doi.org/10.1101/2020.02.03.932350. [DOI] [PMC free article] [PubMed]
- 10.Haruna AA,. Muhammad LJ, Yahaya BZ, et al. (2019) An improved C4.5 data mining driven algorithm for the diagnosis of coronary artery disease. In: International Conference on Digitization (ICD), Sharjah, United Arab Emirates, pp 48–52.
- 11.Hussain S et al. (2019) Performance evaluation of various data mining algorithms on road traffic accident dataset. In: Satapathy S, Joshi A. (eds) Information and communication technology for intelligent systems. Smart innovation, systems and technologies, 106
- 12.Ishaq FS, Muhammad LJ, Yahaya BZ, et al. Fuzzy based expert system for diagnosis of diabetes mellitus. Int J Adv Sci Technol. 2020;136:39–50. [Google Scholar]
- 13.Ishaq FS, Muhammad LJ, Yahaya BZ, et al. Data mining driven models for diagnosis of diabetes mellitus: a survey. Indian J Sci Technol. 2018;11:42. doi: 10.17485/ijst/2018/v11i42/132665. [DOI] [Google Scholar]
- 14.Jebara T. Machine learning: discriminative and generative. Norwell: Springer; 2003. [Google Scholar]
- 15.Li Y, Hai-Tao Z, Jorge G et al. (2020) A machine learning-based model for survival prediction in patients with severe COVID-19 infection medRxiv 2020.02.27.20028027; doi: https://doi.org/10.1101/2020.02.27.20028027.
- 16.Lisa EG, Vineet DM. Return of the coronavirus: 2019-nCoV. Viruses. 2020;12(2):135. doi: 10.3390/v12020135. [DOI] [PMC free article] [PubMed] [Google Scholar]
- 17.Mahase E. China coronavirus: what do we know so far? BMJ. 2020;368:m308. doi: 10.1136/bmj.m308. [DOI] [PubMed] [Google Scholar]
- 18.Malik M (2020) Machine learning the phenomenology of COVID-19 from early infection dynamics, https://arxiv.org/abs/2003.07602
- 19.Mathkunti NM, Rangaswamy S. Machine learning techniques to identify dementia. SN Comput Sci. 2020;1:118. doi: 10.1007/s42979-020-0099-4. [DOI] [Google Scholar]
- 20.Mitchell T (1997) Machine learning. McGraw Hill0–07–042807–7
- 21.Morens DM, Daszak P, Taubenberger JK. Escaping Pandora’s Box—another novel coronavirusexternal icon. N Engl J Med. 2020 doi: 10.1056/NEJMp2002106. [DOI] [PubMed] [Google Scholar]
- 22.Muhammad LJ et al. (2019) Performance evaluation of classification data mining algorithms on coronary artery disease dataset. In: IEEE 9th International Conference on Computer and Knowledge Engineering (ICCKE 2019), Ferdowsi University of Mashhad. 2019.
- 23.Muhammad LJ, et al. Using decision tree data mining algorithm to predict causes of road traffic accidents, its prone locations and time along Kano–Wudil Highway. Int J Database Theory Appl. 2017;10(11):197–208. doi: 10.14257/ijdta.2017.10.1.18. [DOI] [Google Scholar]
- 24.Muhammad LJ, Usman SS (2020) Power of artificial intelligence to diagnose and prevent further COVID-19 outbreak: a short communication (2020); arXiv 2004.12463 [cs.CY]
- 25.Muhammad LJ, Islam MM, Usman SS, et al. Predictive data mining models for novel coronavirus (COVID-19) infected patients’ recovery. Springer Nat Comput Sci. 2020 doi: 10.1007/s42979-020-00216-w. [DOI] [PMC free article] [PubMed] [Google Scholar]
- 26.Muhammad LJ, Garba EJ, Oye ND, et al. On the problems of knowledge acquisition and representation of expert system for diagnosis of coronary artery Disease (CAD) Int J u- and e- Serv Sci Technol. 2018;11(3):50–59. [Google Scholar]
- 27.Muhammad LJ, Yahaya BZ, Garba A, et al. Multi query optimization algorithm using semantic and heuristic approaches. Int J Database Theory Appl. 2016;6(9):219. doi: 10.14257/ijdta.2016.9.6.22. [DOI] [Google Scholar]
- 28.Muhammad LJ, Algehyne EA, Usman SS. Predictive supervised machine learning models for diabetes mellitus. Sn Comput Sci. 2020;1:240. doi: 10.1007/s42979-020-00250-8. [DOI] [PMC free article] [PubMed] [Google Scholar]
- 29.Muhammad LJ, Garba A, Abba G. Security challenges for building knowledge based economy in Nigeria. Int J Secur Appl. 2015;9(1):119. [Google Scholar]
- 30.Narin A, Kaya C, Pamuk Z (2020) Automatic detection of coronavirus disease (COVID-19) using X-ray images and deep convolutional neural networks. arXiv 2003.10849 [DOI] [PMC free article] [PubMed]
- 31.Paul S. Machine learning for detection and diagnosis of disease. Annu Rev Biomed Eng. 2006;8(1):537–565. doi: 10.1146/annurev.bioeng.8.061505.095802. [DOI] [PubMed] [Google Scholar]
- 32.Raphael D, Stanley P. Novel Coronavirus from Wuhan China, 2019–2020, Chapter 155, Mandell, Douglas, and Bennett's Principles and Practice of Infectious Diseases, Ninth Edition (Elsevier, 2020)
- 33.Rasheed OA, Mohammed E, Iris S et al. (2020) Comparison of supervised machine learning classification techniques in prediction of locoregional recurrences in early oral tongue cancer. Int J Med Inform 136. [DOI] [PubMed]
- 34.Rustam F, et al. COVID-19 future forecasting using supervised machine learning models. IEEE Access. 2020 doi: 10.1109/access.2020.2997311. [DOI] [Google Scholar]
- 35.Sadiq H, Muhammad LJ, Yakubu A. Mining social media and DBpedia data using Gephi and R. J Appl Comput Sci Math. 2018;12(1):14–20. doi: 10.4316/JACSM.201801002. [DOI] [Google Scholar]
- 36.Saravanan R, Sujatha P (2018). A state of art techniques on machine learning algorithms: a perspective of supervised learning approaches in data classification. In: 2018 Second International Conference on Intelligent Computing and Control Systems (ICICCS), Madurai, India, 945–949, doi: 10.1109/ICCONS.2018.8663155.
- 37.Singh P (2019) Supervised machine learning. In: Learn PySpark. Apress, Berkeley.
- 38.WHO, Key messages and actions for COVID-19 prevention and control in schools, March 2020.
- 39.Wynants L, Van Calster B, Bonten MMJ, et al. Prediction models for diagnosis and prognosis of covid-19 infection: systematic review and critical appraisal. BMJ. 2020;7(369):m1328. doi: 10.1136/bmj.m1328. [DOI] [PMC free article] [PubMed] [Google Scholar]
- 40.Yang Z, Zeng Z, Wang K, et al. Modified SEIR and AI prediction of the epidemics trend of COVID-19 in China under public health interventions. J Thorac Dis. 2020;12(3):165–174. doi: 10.21037/jtd.2020.02.64. [DOI] [PMC free article] [PubMed] [Google Scholar]
- 41.https://www.kaggle.com/marianarfranklin/mexico-covid19-clinical-data/metadata Accessed 26 Jun 2020.
- 42.https://www.sciencemag.org/news/2020/05/unproven-herbal-remedy-against-covid-19 could-fuel-drug-resistant-malaria-scientists, Accessed 2 Jun 2020.
- 43.Dong L, Hu S, Gao J. Discovering drugs to treat coronavirus disease 2019 (COVID-19) Drug Discov Ther. 2020;14:58–60. doi: 10.5582/ddt.2020.01012. [DOI] [PubMed] [Google Scholar]
- 44.Wang D, Hu B, Hu C, et al. Clinical characteristics of 138 hospitalized patients with 219 novel coronavirus-infected pneumonia in Wuhan, China. JAMA. 2020 doi: 10.1001/jama.2020.1585. [DOI] [PMC free article] [PubMed] [Google Scholar]
- 45.Huang C, et al. (2020) Clinical features of patients infected with 2019 novel coronavirus in Wuhan, China. Lancet; ahead of print. [DOI] [PMC free article] [PubMed]
- 46.Chinese diagnosis and treatment plan of COVID-19 patients (The fifth edition). http://www.nhc.gov.cn/yzygj/s7653p/202002/3b09b894ac9b4204a79db5b8912d4440. shtml. 2020. Accessed 5 Jun 2020.
- 47.Chinese diagnosis and treatment plan of COVID-19 patients (The sixth edition). http://www.nhc.gov.cn/yzygj/s7653p/202002/8334a8326dd94d329df351d7da8aefc2.s html. 2020 Accessed 7 Jun 2020.
- 48.Kaur H, Kumari V. Predictive modeling and analytics for diabetes using a machine learning approach. Appl Comput Inform. 2018 doi: 10.1016/j.aci.2018.12.004. [DOI] [Google Scholar]
- 49.Hearst MA, Dumais ST, Osuna E, Platt J, Scholkopf B. Support vector machines. IEEE Intell Syst Appl. 1998;13(4):18–28. doi: 10.1109/5254.708428. [DOI] [Google Scholar]
- 50.Huang GB, Zhu QY, Siew CK. Extreme learning machine: theory and applications. Neurocomputing. 2006;70(1):489–501. doi: 10.1016/j.neucom.2005.12.126. [DOI] [Google Scholar]
- 51.Islam M, Mahmud S, Muhammad LJ, et al. Wearable technology to assist the patients infected with novel coronavirus (COVID-19) SN Comput Sci. 2020;1:320. doi: 10.1007/s42979-020-00335-4. [DOI] [PMC free article] [PubMed] [Google Scholar]


