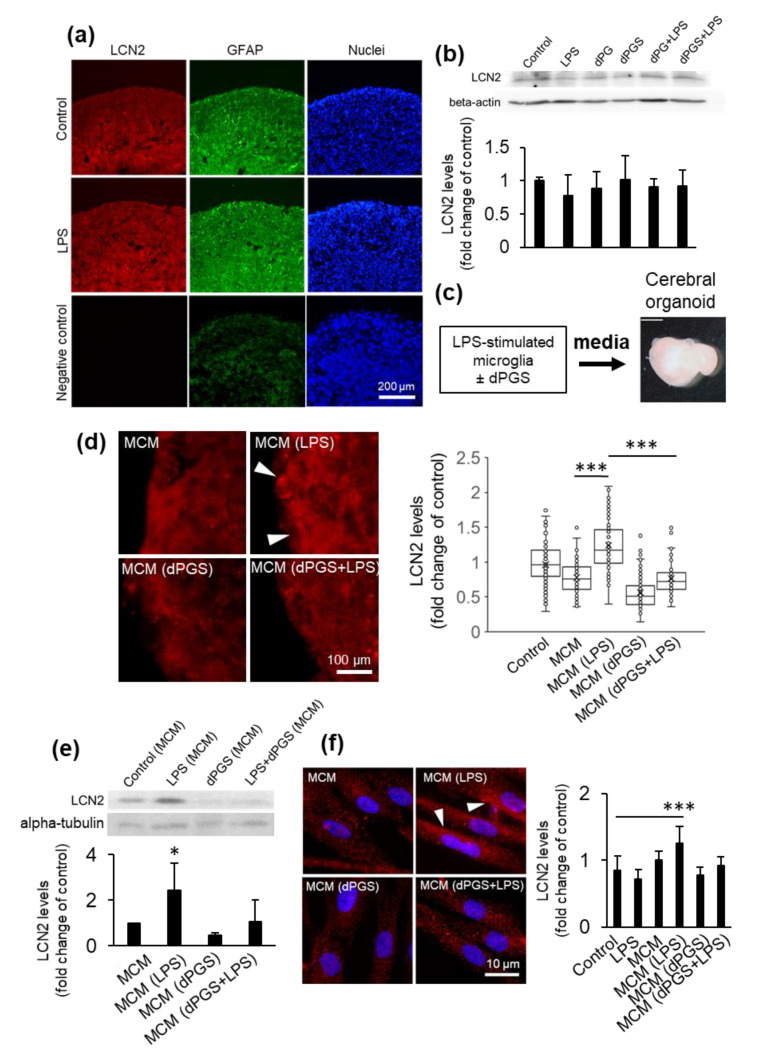
Figure 2.
Lipocalin-2 levels in human cerebral organoids. (a) Micrographs of lipocalin-2 (LCN2) detected by immunofluorescence in organoid cryosections following treatment with LPS (10 ng/mL) for 24 h. Astrocytes were labeled with GFAP and nuclei with Hoechst 33342. The negative control was prepared in the absence of primary antibodies to account for background fluorescence. Samples were imaged using a fluorescence microscope. (b) LCN2 levels in organoids treated with lipopolysaccharide (LPS) (10 ng/mL) with or without dPG (1 μM) and dPGS (1 μM) for 24 h and measured by Western blot, with beta-actin as loading control. Quantification shown are the average intracellular LCN2 levels ±SD in organoids based on immunofluorescence images shown in (a). A total of 27 samples were analyzed from three independent experiments. (c) Schematic representation of media conditioning from microglia used for cerebral organoid treatment. (d) Representative fluorescence micrographs of intracellular LCN2 levels in organoids treated with conditioned media from microglia (MCM) treated with LPS (10 ng/mL), dPGS (1 μM) for 24 h. Quantifications show the average and single-cell levels of LCN2 fluorescence in cryosections. A total of 1017 cells were analyzed from independent experiments. *** p < 0.001 (e) LCN2 levels from organoids treated as in (d) and measured by Western blot, with alpha-tubulin as loading control. Shown are the average LCN2 levels from two independent experiments. * p < 0.05 (f) Fluorescence micrographs of LCN2 abundance in primary human astrocytes treated as in (d) and measured using immunocytochemistry. Shown are the average intracellular LCN2 levels in astrocytes as fold increase of the untreated control. A total of 477 cells from two independent experiments were analyzed. *** p < 0.001.

