Figure 3.
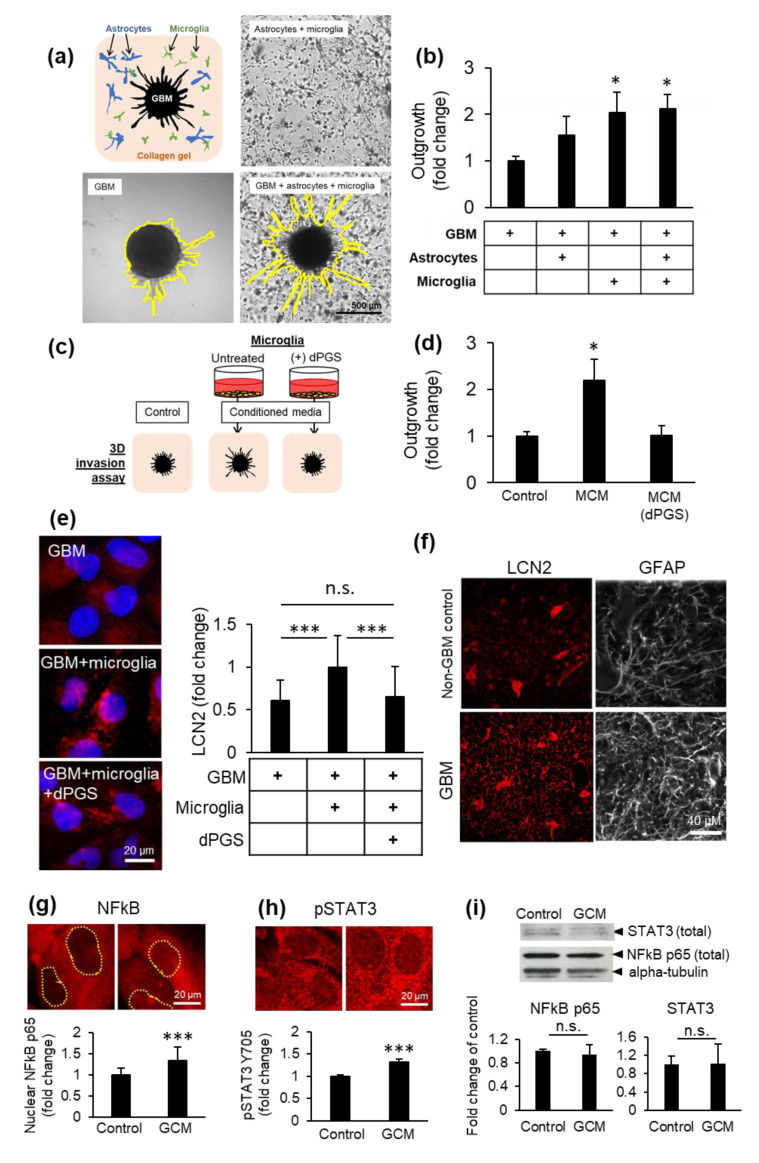
Glioblastoma (GBM) invasiveness in 3D co-cultures. (a) Collagen gels were seeded with human primary astrocytes and human HMC3 microglia in the presence or absence of a glioblastoma tumoroid. (b) Glioblastoma invasiveness in the presence or absence of microglia and astrocytes in 3D co-cultures after 6 days. Shown are the average distance of outgrowth from the tumoroid as a fold change of the tumoroid monoculture ±SEM. A total of 32 tumoroids were tested from at least three independent experiments. * p < 0.05 (c) Schematic representation of microglial conditioned media (MCM) used to treat collagen-embedded tumoroids. (d) Glioblastoma tumoroid outgrowth in the presence of conditioned media from microglia treated or not with dPGS (1 μM) after 6 days ±SEM. A total of 29 tumoroids were tested from at least four independent experiments. * p < 0.05 (e) Representative fluorescence micrographs showing intracellular LCN2 (red) in glioblastoma cells in the presence or absence of microglia cells in direct co-culture and dPGS (1 μM) for 24 h. LCN2 was fluorescently immunolabeled and cells were imaged using a fluorescence microscope. Quantifications show the average intracellular LCN2 levels ± SD per cell. At least 500 cells were analyzed from five independent experiments. *** p < 0.001; n.s. Non-significant. (f) Fluorescence micrographs of LCN2 (red) and GFAP (white) in human brain sections from non-cancerous brain or glioblastoma tumor tissues. LCN2 and GFAP were fluorescently labeled by immunohistochemistry and imaged using a fluorescence microscope. (g,h) Activation of transcription factors NFκB and STAT3 in microglia in response to glioblastoma secreted factors. Human HMC3 microglia were treated with glioblastoma conditioned media (GCM) for 24 h, after which NFκB p65 and phosphorylated STAT3 Tyr705 were fluorescently immunolabeled (red) and cells were imaged using a fluorescence microscope. Shown are (g) the average nuclear NFκB p65 level per cell ± SEM (237 cells from three independent experiments) and (h) the average pSTAT3 Y705 level per cell ± SEM (317 cells from three independent experiments) *** p < 0.001. (i) Total NFκB p65 and STAT3 protein abundance in microglia treated as in (g,h). Protein levels were determined by measurements of immunopositive bands in Western blots. Alpha-tubulin was used as loading control. Shown are the average protein abundance of NFκB p65 and STAT3 from three independent experiments. n.s. Non-significant.

