Abstract
Purpose:
The purpose of this study is to safely acquire the first human head images at 10.5T.
Methods:
To ensure safety of subjects, we validated the electromagnetic simulation model of our coil. We obtained quantitative agreement between simulated and experimental and specific absorption rate (SAR). Using the validated coil model, we calculated radiofrequency power levels to safely image human subjects. We conducted all experiments and imaging sessions in a controlled radiofrequency safety lab and the whole-body 10.5T scanner in the Center for Magnetic Resonance Research.
Results:
Quantitative agreement between the simulated and experimental results was obtained including S-parameters, maps, and SAR. We calculated peak 10 g average SAR using 4 different realistic human body models for a quadrature excitation and demonstrated that the peak 10 g SAR variation between subjects was less than 30%. We calculated safe power limits based on this set and used those limits to acquire T2- and -weighted images of human subjects at 10.5T.
Conclusions:
In this study, we acquired the first in vivo human head images at 10.5T using an 8-channel transmit/receive coil. We implemented and expanded a previously proposed workflow to validate the electromagnetic simulation model of the 8-channel transmit/receive coil. Using the validated coil model, we calculated radiofrequency power levels to safely image human subjects.
Keywords: 10.5T, head imaging, MRI, radiofrequency safety, ultra-high field
1 ∣. INTRODUCTION
Demand for ultra-high field (B0 ≥ 7T) MRI is continuously increasing due to its numerous benefits such as significant increase in signal-to-noise ratio1-6 and improved susceptibility contrast.7,8 However, increase in the static field strength (B0) leads to shorter electromagnetic (EM) wavelengths. As a result, destructive interference of the magnetic fields causes signal inhomogeneity and degradation in image quality. On the other hand, both local and global specific absorption rate (SAR) increase with B0.2,9-11 Local SAR turns out to be the most critical radiofrequency (RF) safety concern as its limit is typically reached earlier than global SAR11,12 based on international guidelines.13 Multichannel excitation solutions have been proposed in the literature to deal with these issues using hardware and software solutions.14-16
Recently, a whole-body 10.5T scanner was installed in the Center for Magnetic Resonance Research at the University of Minnesota providing a unique opportunity to investigate human body and brain. Along with other coil designs,17-23 a bumped dipole coil array was proposed24,25 which demonstrated improved SAR performance compared with standard loop and dipole designs. However, confidently using the RF coils at such new field strengths (i.e., 10.5T) essentially requires either a measurement or a proper prediction of the local SAR to ensure subject safety.
There exist different methods for assessing RF safety,26-33 but the assessments based on generic models are the most common approach.30-33 Usually, several generic models are used to compute the EM fields of a particular RF coil and then the field solutions are used to calculate power deposition in the tissue and to ensure safety under different RF excitation scenarios. Validation of the coil model is extremely important,32,33 however, it can be a challenging procedure (especially for multichannel arrays) mainly due to difficulties in modeling cable coupling and parasitic reactances, as well as inaccuracies in the geometrical model of the coil.
Improving geometrical accuracy could improve the overall accuracy of the validation procedure. Previously, it was shown that computerized tomography (CT) images of an experimental set-up can be used to construct accurate simulation models for RF heating studies.34 The difficulties related to modeling coupling and parasitic reactance may be overcome by using a previously described approach,35 which aims to improve the agreement between simulated and measured field patterns through the lumped elements’ (capacitors) values in the coil model. This approach presented by Restivo et al35 used co-simulation36 to determine the values in the simulation environment that minimized the root-mean-square (RMS) of the difference between the simulated and measured S-parameters rather than using the lumped element values as they are in the physical coil. To validate the RF coil model they demonstrated agreement between simulated and experimentally acquired maps of a 4-channel loop array at 7T. Another work presented by Hoffmann et al32 described a validation procedure that included a temperature study, whereas the validation by Restivo et al focused only on maps and did not involve the local SAR comparison. In both manuscripts, the excitation scenarios were limited to phase-only shimming scenarios and did not investigate the effect of the widely varying shims needed for practical applications14,15,37 and which are potentially more revealing in highlighting inconsistencies between the simulation and experimental environments.
In this study, we implemented a coil modeling and validation workflow that expands upon the simulation approach proposed previously by Restivo et al35 and validation methods proposed by Hoffman et al32.
The steps of the workflow are summarized: (1) An EM simulation model is configured using high-resolution segmented computerized tomography (CT) images of the setup (i.e., the Tx coil and the phantom). (2) Matching and tuning lumped elements along with the length of the extension cables are optimized using the co-simulation method to minimize the RMS of the difference between the simulated and measured S-parameters. (3) Validation is performed through experimental RF heating studies and measurements for different excitation scenarios in a phantom.
Using our workflow, we validated an 8-channel bumped dipole array24 at 10.5T. Using the validated coil model, we performed additional EM simulations with 4 realistic human head models to determine the safe RF power limits which were used to acquire the first human head images at 10.5T.
2 ∣. METHODS
2.1 ∣. RF coil and numerical validation
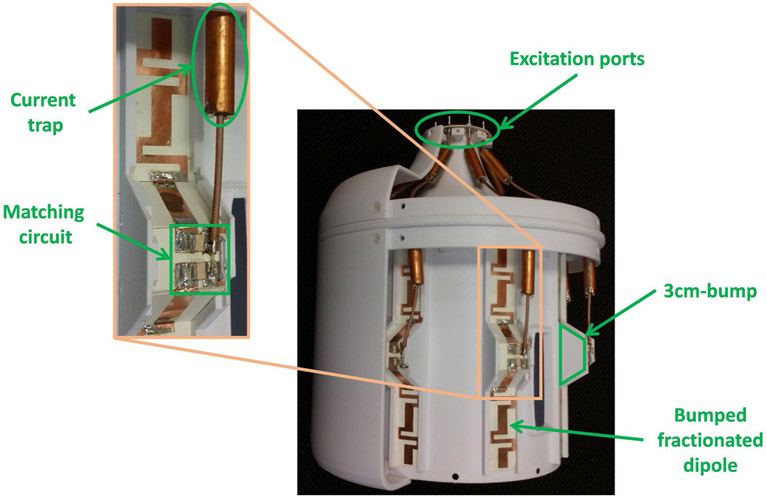
In this work we evaluated an 8-channel bumped dipole array as an RF transmit/receive (Tx/Rx) head coil operating at 447 MHz (Figure 1). The bumped dipole uses a previously demonstrated strategy of lifting the central feed point, where the highest E-fields exist, further away from the load with the goal of reducing peak local SAR.24 Each element of the transceiver array consisted of a 210-mm-long fractionated dipole with an optimal bump height of 30 mm at the feed point.24 The conductors were etched on an RO4003C (Rogers Corp.) laminate and mounted on a 3D printed elliptical holder composed of polyethylene terephthalate glycol. All channels were matched to better than −7.5 dB and decoupled by at least 9.9 dB. To model and validate this RF coil at 10.5T, we implemented a coil modeling and validation workflow to quantitatively evaluate agreement between simulated and experimentally measured results (see Figure 2).
FIGURE 1.
An 8-channel bumped fractionated dipole array used as an RF Tx/Rx coil for the human head imaging at 10.5T
FIGURE 2.

The expanded workflow to model and validate the EM model
A jar-shaped cylindrical phantom filled with a gel was used for all experimental and simulation studies in the validation workflow. The gel consisted of 14 g/L hydroxyethyl cellulose and 2.9 g/L NaCl with electrical properties of εr = 78 and σ = 0.5 S/m was used. The electrical properties of the phantom were measured by a dielectric assessment kit (DAK-12, Speag, Zurich, Switzerland). With the phantom positioned in the RF coil, S-parameters were measured on the bench using a 16-channel network analyzer (Rohde & Schwarz ZNBT8, Munich, Germany).
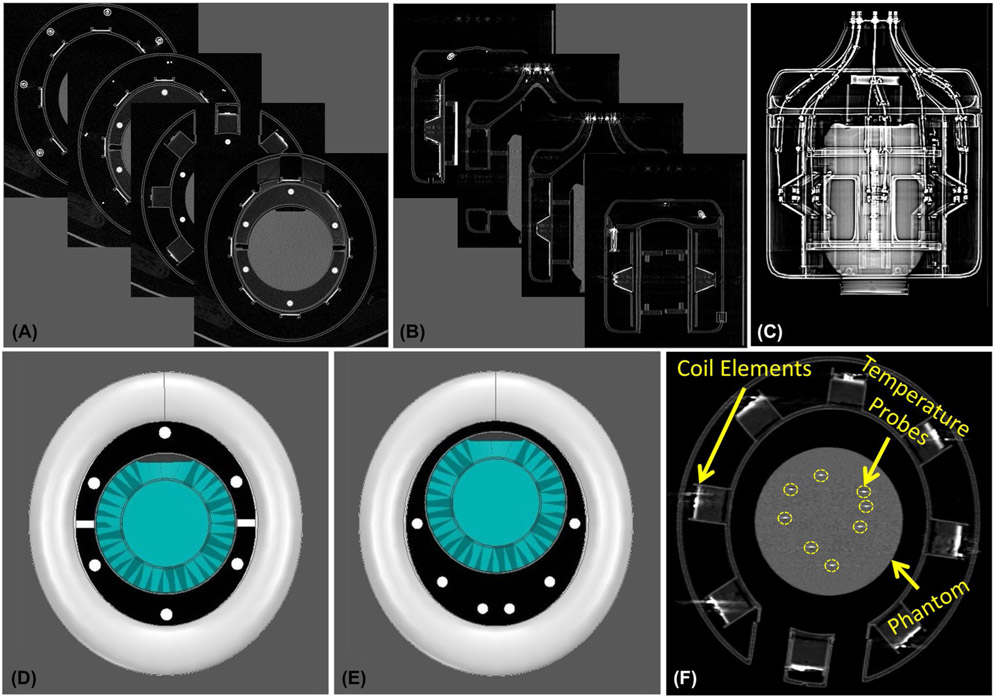
To configure an EM model for simulation in which the relative position of the phantom in the coil could be accurately represented, the phantom and coil setup were transported to a CT scanner. 3D high-resolution (0.6 × 0.6 × 0.7 mm3) CT images were acquired using a biograph PET/CT scanner (Siemens, Erlangen, Germany) (Figure 3A-C). The images were post processed to segment the RF coil and phantom and allow for a spatially accurate EM model (Figure 3D) of the experimental setup. Experimental measurements of the phantom with the bumped dipole array were then performed at 10.5T (Agilent, Santa Clara, CA, USA) equipped with a Siemens Magnetom console (Siemens Healthcare, Erlangen, Germany) and a 16-channel parallel transmit system.
FIGURE 3.
Modeling the experimental setup. A-C, High-resolution 3D CT images of the experimental setup including the transmit coil and the phantom. D, EM model of the coil and the centrally positioned phantom configured using the CT images. E, EM model of the coil and the off-centered phantom configured using the CT images. F, CT image that shows the configuration of the optical thermal probes immersed into the phantom
Transmit maps were experimentally acquired using various RF excitation patterns with 2 different phantom setups. For the first set-up, the phantom was centered in the coil (Figure 3D), and for the second set-up, it was placed off-center (Figure 3E). In each configuration, 4 RF excitation patterns were used, namely: circularly polarized (CP) mode, linear mode, zero phase-difference mode, and a random excitation. To fix the phantom in the intended position and orientation during different stages of the validation, 4 half-elliptic holders were 3D-printed as indicated by black pieces in Figure 3D,E. To keep these holders rigid and stable, 6 cylindrical rods (white dots in Figure 3D,E) were 3D-printed as well and passed through the holes on the holders. The coil was driven by eight 2 kW RF amplifiers (Stolberg HF-Technik AG, Stolberg, Germany) and the excitation parameters (i.e., magnitudes and phases) were measured using an 8-channel oscilloscope. To measure the RF excitation delivered by the system, the outputs at the MR patient table were connected to 50-dB directional couplers (Werlatone Inc, New York, NY, USA) using LMR-400–type cables. We measured the voltage of the attenuated forward signal from the directional couplers with an oscilloscope for all excitation patterns that were used in the mapping study. We disconnected the directional couplers and oscilloscope after we performed voltage measurements.
In addition, to demonstrate the robustness of the EM model to the load variations, the phantom was shifted off-center in the coil and the same mapping experiments were repeated (Figure 3E). All maps were acquired using the actual flip-angle imaging technique.38
For the experimental SAR results, we performed temperature measurements in an RF safety lab as described in a previous work.34 Eight RF amplifiers (Communications Power Corp., Hauppauge, NY, USA) with peak RF power of 500 W, operating at 447 MHz were used to deliver RF energy to the same coil-phantom setups, again with various RF excitation patterns matching those used for mapping. The output of the transmit system was confirmed using the same strategy described above using an oscilloscope. Eight fiber optic temperature probes (Lumasense Technologies, CA, USA) were used to measure the temperature inside the phantom at distinct locations (see Figure 3F). The slope of the initial linear regime of the temperature progression curve was later used to estimate the local SAR at the probe tips.
An initial EM simulation was performed using HFSS (ANSYS, Canonsburg, PA, USA) with all lumped elements replaced by excitation ports, similar to the co-simulation method.36 Subsequently, the RMS error (RMSE) between the simulated and measured complex S-matrices with the centrally positioned phantom (i.e., setup 1) was minimized by optimizing the lumped elements’ values using a circuit simulator (AWR Corp., El Segundo, CA, USA), as proposed by Restivo et al.35 For this purpose, the gradient descent method39 was used as the optimization algorithm provided by the circuit simulator. The extension cables (i.e., cables connecting the dipole feed points to the T/R switches) were modeled using the length-adjustable ideal transmission lines in the circuit simulator environment and the lengths were treated as variables for the optimization problem. The modeling of the RF coil was complete when the optimum values for the lumped elements and lengths of the transmission lines were determined.
In the next step, excitation voltages (measured during the and temperature experiments) were imported to the circuit simulator to calculate the complex voltage at the feed point of the dipoles. The calculated signals were then used to drive the coil model in the EM simulation environment. Finally, the corresponding and SAR maps were generated for each of the EM simulation models and the simulated and experimentally measured results were compared. Note, that no further EM simulation is required for calculating the and SAR maps because the initial simulation contains all necessary EM solutions. In other words, the calculated port voltages are used as the coefficients of initially solved electric and magnetic fields to calculate the and SAR maps.
2.2 ∣. RF safety analysis with realistic human models
To obtain safe RF power limits for human subjects, we performed additional EM simulations using the validated coil model and realistic human models. For this preliminary work, we limited the RF excitation to a CP mode. To investigate how local SAR levels would vary among different subjects, we ran EM simulations with 4 different realistic human head models using the CST Studio. The simulated human models included 2 females and 2 males: Ella of the virtual population (voxel size, 2 × 2 × 2 mm3; height, 1.63 m; weight, 57.3 kg), Donna of CST voxel family (voxel size, 1.875 × 1.875 × 2 mm3; height, 1.76 m; weight, 79 kg), Duke of the virtual population (voxel size, 2 × 2 × 2 m3; height, 1.77 m; weight, 70.3 kg), and Gustav of CST voxel family (voxel size, 2.08 × 2.08 × 2 mm3; height, 1.76 m; weight, 69 kg). The EM simulations used approximately 38 × 106, 18 × 106, 57 × 106, and 17 × 106 meshes for the models indicated above, respectively. We calculated the maximum 10 g local SAR among the 4 models, and it was used to determine the safe total power limit for head imaging in CP mode.
2.3 ∣. In vivo head imaging and pulse sequence parameters
FDA considers all MR scanners with B0 > 8.0T to be significant risk devices. Therefore, scanning human subjects at 10.5T required an investigational device exemption. Supported by previous work and additional preclinical studies our lab has performed,34,40,41 the initial research study approved under this investigational device exemption had a primary objective of assessing the short- and long-term effects of field exposure. This rather comprehensive study explored the cognitive, physiologic and vestibular performance of volunteers during an extensive set of tests totaling 4 visits over several weeks. During the fourth visit, we had the opportunity to perform a limited imaging study to accomplish the secondary objective, to explore the feasibility of imaging at 10.5T. Of the 26 volunteers that completed the study, 4 of them were scanned using our head coil (age, average 31.5 (21-54) years old; weight, average 79 (63.5-90.3) kg; height, average 169.3 (165.1-172.7) cm; 1 male / 3 females). The local institutional review board approved the protocol and written informed consent was obtained from all participants. The subjects who participated in the safety study were imaged with our safety-validated RF coil allowing us to acquire the first in vivo human brain images at 10.5T.
We acquired T2-weighted images using the TSE pulse sequence with refocusing flip angle (FA) = 200°, repetition time/echo time (TR/TE) = 5000 ms/72 ms, in-plane resolution = 0.4 mm, slice thickness = 3 mm, acquisition matrix = 512 × 408, TSE-factor 9, # of averages = 3, and pixel bandwidth = 488 Hz/pixel. In addition, -weighted images were acquired using a gradient-echo (GRE) pulse sequence with FA = 15°, TR/TE = 200ms/20 ms, in-plane resolution = 0.4 mm, slice thickness = 3 mm, acquisition matrix = 512 × 512, # of averages = 8, and pixel bandwidth = 391 Hz/pixel. The CP mode was used for RF excitation in all imaging sessions. No RF shimming was performed.
3 ∣. RESULTS
3.1 ∣. Numerical validation
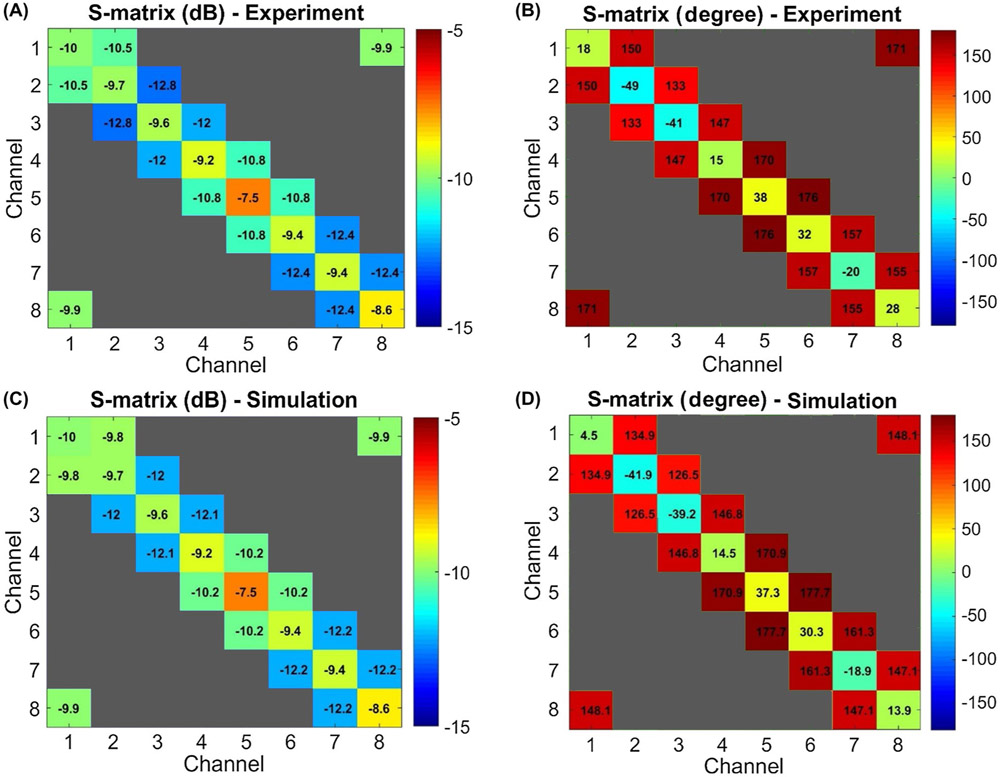
Figure 4A,B shows the magnitudes and phases of the S-parameters corresponding to the benchtop measurements. We ignored the interaction between the nonadjacent channels (i.e., the simulated maximum coupling between nonadjacent channels was −21 dB) and did not consider them in the validation process. Accordingly, the magnitudes and phases corresponding to S-parameters of nonadjacent channels are shown in gray in Figure 4 and do not necessarily represent the actual values. Figure 4C,D shows the S-parameters of the numerical model obtained after optimizing the lumped elements. The RMSE between the measured and simulated S-parameters was 0.33 dB for magnitude and 9° for phase.
FIGURE 4.
Measured and simulated S-parameters. The simulated S-parameters are obtained after the optimization of the lumped elements using the co-simulation model. A, Magnitude of the measured S-parameters in dB. B, Phase of the measured S-parameters in degree. C, Magnitude of the simulated S-parameters in dB. D, Phase of the simulated S-parameters in degree
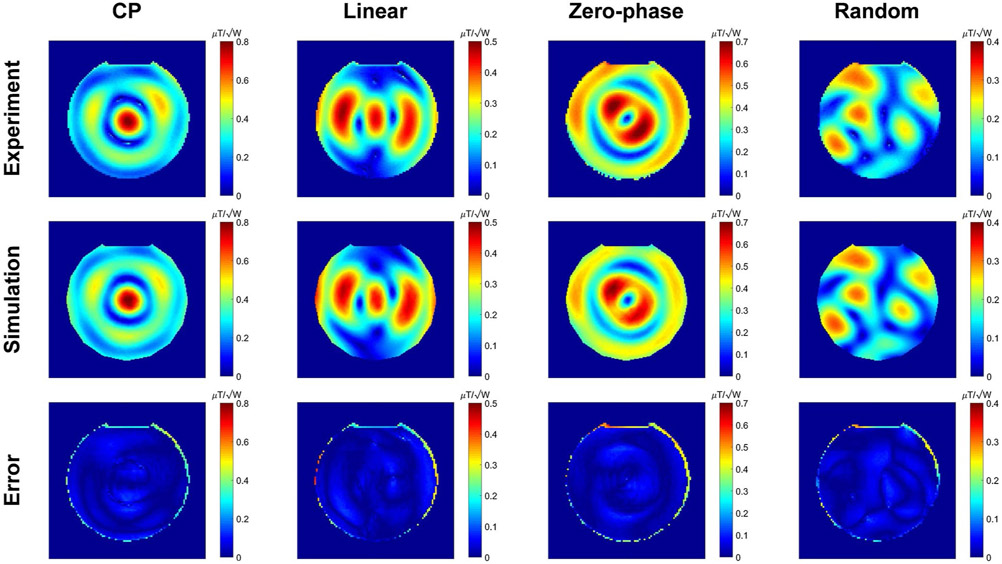
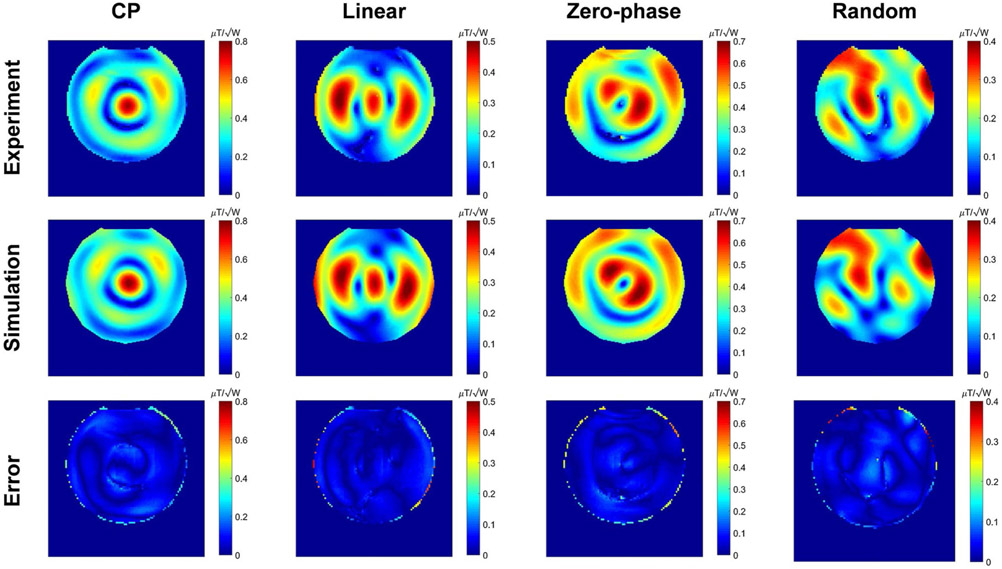
Figure 5 shows the maps corresponding to 4 different excitations obtained from the experiments and simulations. The difference between the measured and simulated maps are given in the third row of Figure 5. The results show a good agreement between simulated and measured maps. In this case, the phantom was positioned at the center of the coil.
FIGURE 5.
Experimental and simulated maps corresponding to 4 different excitations while the phantom is positioned at the center of the coil. The third row shows the difference maps between the experimental and simulated maps
To demonstrate the robustness of the validation method, the measured and simulated maps corresponding to the off-center phantom are shown in Figure 6. The results demonstrate that the agreement in results are robust with respect to varying the load from the conditions that were used to match the S-matrix parameters.
FIGURE 6.
Experimental and simulated maps corresponding to 4 different excitations while the phantom is positioned off-center with respect to the coil. The third row shows the difference maps between the experimental and simulated maps
Similar agreement was also observed between the maps corresponding to the individual channels obtained from the experiments and simulations while the phantom was positioned at the center of the coil (Supporting Information Figure S1, which is available online).
In addition to the visual agreements between the presented maps, quantitative agreement also exists (Supporting Information Table S1). As a parameter of similarity between the measured and simulated maps, the corresponding correlation was computed. Furthermore, normalized RMSE (NRMSE) between the measured and simulated maps is given as a percentage. The NRMSE values show a typical 10% error corresponding to 4 different shimming scenarios while the typical errors for individual channels are slightly larger (i.e., ~15%) (Supporting Information Table S1).
Scatter plots of the simulated versus measured maps, where each blue dot corresponds to single voxel, demonstrate that a relatively good voxel-wise agreement between the measured and simulated maps was achieved (Supporting Information Figures S2 and S3).
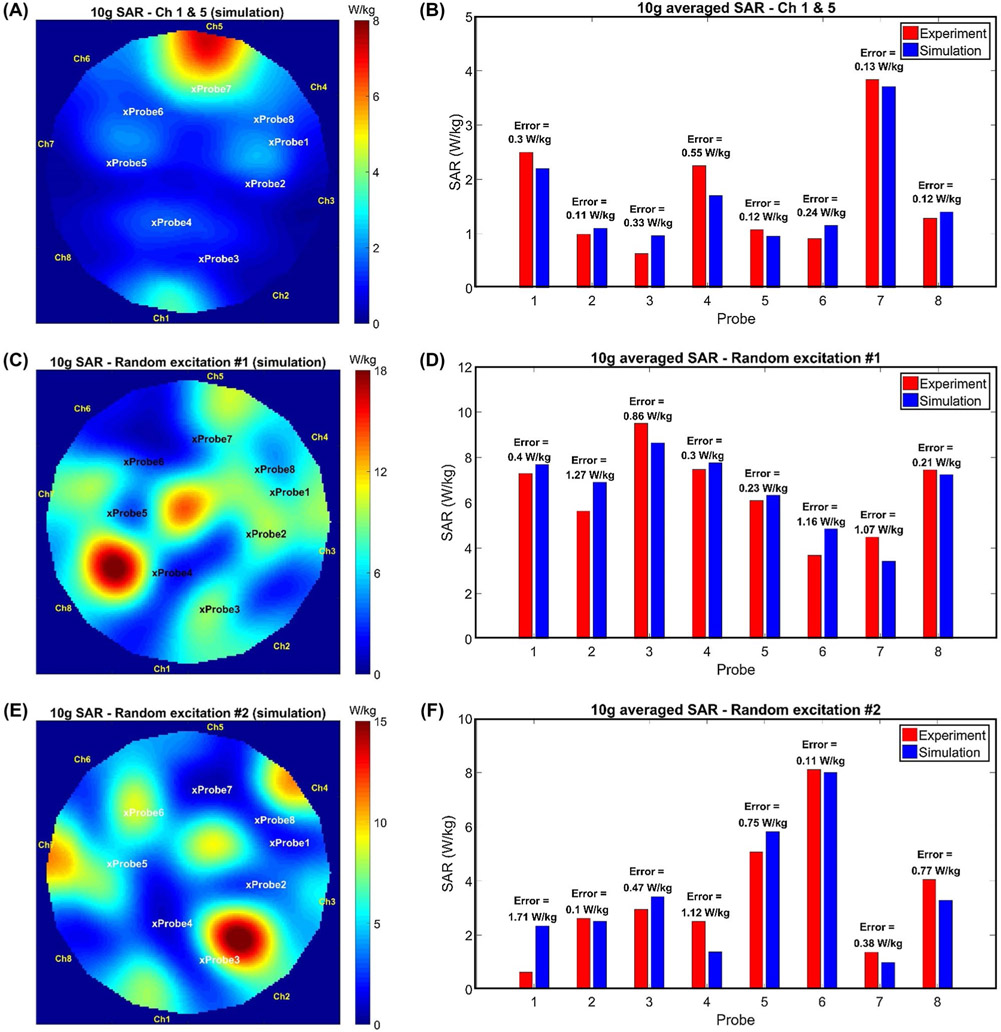
For the next step of the validation procedure, simulated and measured local SAR values were compared. Figure 7A shows the simulated SAR-map while only channels 1 and 5 were excited using unequal signals. Similarly, Figure 7C,E shows the simulated SAR-maps for 2 different random excitations. Figure 7B,D,F shows a comparison between the numerically calculated and measured SAR values at the tips of the temperature probes. A good agreement between the simulated and measured SAR values was achieved (i.e., RMSE = 0.69 W/kg).
FIGURE 7.
Validation using temperature measurement. A, Simulated SAR-map while only channel 1 and 5 are excited. B, Comparison between simulated and experimentally estimated SAR at the tip of the temperature probes corresponding to channel 1 and 5 excitation. C,E, Simulated SAR-maps corresponding to 2 random excitations. D,F, Comparison between simulated and experimentally estimated SAR at the tip of the temperature probes corresponding to 2 random excitations. Cross signs on the SAR maps are indicating the positions of the temperature probes’ tips
3.2 ∣. Investigating RF safety
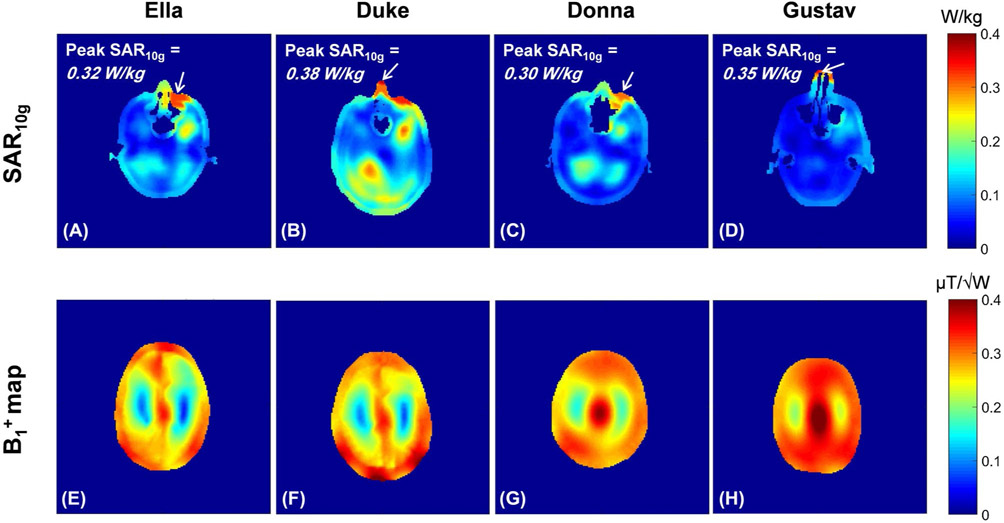
In this work, CP-mode of excitation was chosen for imaging. To determine a safe power limit for human head imaging of various subjects with different genders using the CP mode of the transmitter, EM simulations were performed on 4 different realistic human body models. Figure 8A-D shows the 10 g-averaged SAR maps for each model on the plane that contains the peak 10 g-averaged SAR point for a total input power of 1 W. To be conservative, the CP mode power limit was determined based on the Duke model which exhibited the highest local SAR estimates. According to these results and considering 10 W/kg IEC guideline for local SAR in the head, the maximum allowed total input power to the transmitter was limited to be 25 W for subsequent in vivo human head imaging. In addition, Figure 8E-H shows the corresponding simulated maps normalized to a total input power of 1 W. The maps are presented on the axial plane, which is fixed with respect to the feed point of the coil for all simulated human models.
FIGURE 8.
First row, Simulated 10 g-averaged SAR maps for 1W total input power for different realistic human body models at the plane of peak local SAR. Second row, Simulated maps for 1W total input power at the same axial plane with respect to the coil elements (i.e., 20 mm above the feed points plane in inferior-superior direction). All maps were determined using the validated coil model with CP-mode excitation
3.3 ∣. In vivo head imaging
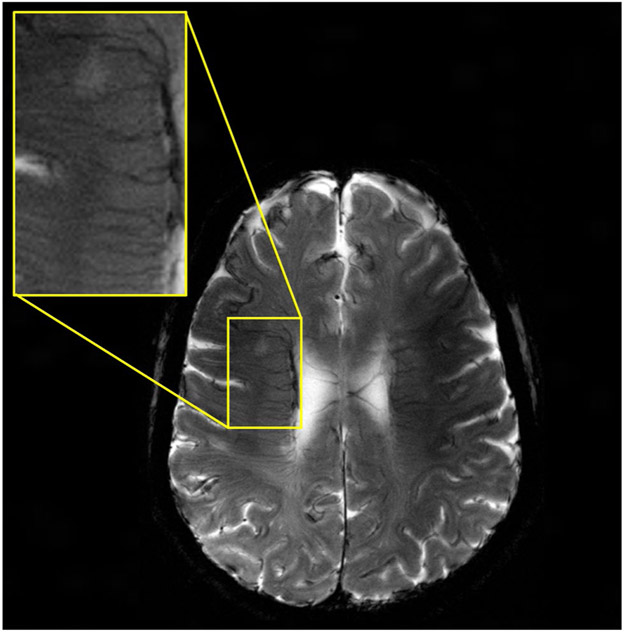
Using the CP mode of excitation and the total power limit of 25 W determined by the safety studies, we acquired MR images from volunteers at 10.5T. We focused on 2 basic pulse sequences for these preliminary studies, namely, -weighted GRE and T2-weighted TSE. Figure 9 shows 8 slices of the first T2-weighted human brain images at 10.5T acquired using the TSE pulse sequence in 611 s. Figure 10 shows 1 slice among 7 slices of the first -weighted human images at 10.5T acquired using the GRE pulse sequence in 430 s.
FIGURE 9.
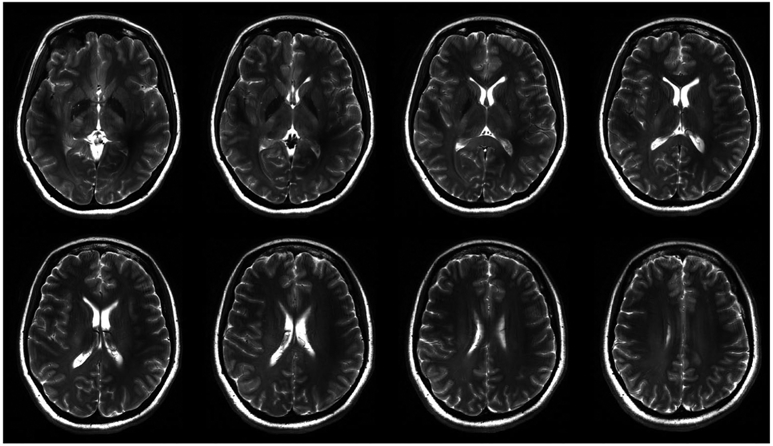
The first T2-weighted human brain image at 10.5T acquired using the TSE pulse sequence with TR/TE = 5000 ms/72 ms. Matrix = 512 × 408, in-plane resolution = 0.4 mm, slice thickness = 3 mm, # of averages = 3, and pixel bandwidth = 488
FIGURE 10.
The first -weighted human brain image at 10.5T acquired using the GRE pulse sequence with FA = 15°, TR/TE = 200 ms/20 ms, matrix = 512 × 512, in-plane resolution = 0.4 mm, slice thickness = 3 mm, # of averages = 8, and pixel bandwidth = 391
The T2-TSE images presented with expected tissue contrast between white and gray matter. GRE images revealed some of the venous structures in the brain due to contrast. For both studies, an acceptable signal homogeneity was achieved across the slices of interest.
4 ∣. DISCUSSION AND CONCLUSIONS
In this study, we acquired the first in vivo human head image at 10.5T using an 8-channel Tx/Rx coil. As a part of the RF-safety assessment, we expanded a previously proposed workflow for validating EM simulations of multichannel arrays. Using the validated simulation model of the coil, we calculated safe power limits for human head imaging and acquired the first in vivo T2- and -weighted human brain images at 10.5T.
The workflow requires constructing an accurate EM simulation model starting from high-resolution segmented CT images of the setup (i.e., the coil and the phantom). The lumped elements of the coil are optimized using the cosimulation method, as proposed by Restivo et al,35 to minimize the RMS of the difference between simulated and measured S-parameters. This is a critical step that is necessary to accurately model EM field quantities observed in the phantom. It is also necessary to capture the complex coupling behavior in multichannel arrays. To avoid a large and time-consuming optimization problem, we imposed a limit of 50% deviation from the nominal lumped elements values used in the actual coil. In this work, the simulated capacitor values resulting from the optimization were between 10 and 15 pF, while the nominal (actual) values were 15 pF.
To show the importance of optimization of the lumped elements, we omitted this optimization from the modeling part presented in the workflow. In other words, we plugged the nominal values of the lumped elements (i.e., the capacitors which are used for tuning and matching of the coil in the real-life) into the EM simulations without any further adjustment. The third row in Supporting Information Figure S5 shows the maps corresponding to 4 different excitations with the coil model resulting from using this method (i.e., excluding the co-simulation from the modeling part). The correlation and NRMSE between the maps in this scenario and the experimental maps are given in Supporting Information Table S2.
In addition to optimizing the lumped elements’ (i.e., capacitors) values, we also considered the length of extension cables as an optimization parameter. Inclusion of the cable lengths in the optimization significantly affects the phases of the complex S-parameters. The effect of minimizing the error between measured and simulated phases is directly reflected in the validation part as shown in Supporting Information Figure S5. The fourth row in Supporting Information Figure S5 shows the maps corresponding to 4 different excitations with the coil model resulting from excluding the cable length optimization from the presented workflow. The correlation and NRMSE between the maps in this scenario and the experimental maps are given in Supporting Information Table S2.
In the previous work presented by Restivo et al,35 the major criterion for the validation of the EM model is the comparison between the simulated and measured maps corresponding to some phase-only shimming scenarios such as CP-mode excitation. However, relatively small errors in such maps may result in relatively large errors in the peak SAR predictions. Supporting Information Figure S4 shows the statistical distributions of the error in the peak SAR predictions corresponding to the typical error values between the measured and simulated maps (i.e., NRMSE between simulated and experimental maps). These results were obtained using the Monte-Carlo method for 4 different types of excitations while the phantom was positioned in the center of the coil. For each excitation scenario, 4 different percentiles of errors in maps were propagated into the peak SAR prediction errors. For typical 10% error, the peak SAR underestimation ranges between 9% and 31% for the zero-phase excitation and the random excitation, respectively. The peak SAR underestimation becomes significantly larger if the error in maps increases. These effects were carefully considered before in vivo studies while choosing a safety factor for our imaging studies.
The workflow is implemented to validate the EM simulation models of multichannel coil arrays. Once the validation is complete, the coil model can be used to calculate field patterns in a different load. This concept was tested by using an off-centered phantom. The validated model accurately predicted field patterns in the shifted phantom without requiring additional optimization of the lumped elements a second time.
To demonstrate the accuracy of the workflow, we validated an 8-channel bumped dipole array24 at 10.5T. Using the validated coil model, we performed additional EM simulations with 4 realistic human head models to determine the safe RF power limits. Although differences in the SAR distribution were observed from subject to subject, the intersubject variation of peak 10 g-averaged SAR was relatively small (i.e., 27%) compared with the similar value, 76%, reported by de Greef et al.42
In previous studies, safety factors/margins were proposed based on intersubject variation of peak local SAR42-44 as well as variation with respect to EM properties of tissues and model translation.44-46 In this work, we used a safety buffer based on the RF loss in the pathway from the RFPAs to the feed point of the dipoles, which was measured as 3.9 dB. Considering the intersubject variability,42-46 this 3.9 dB safety buffer along with the calculated safe power limit based on our 4-model worst-case scenario ensures safe use of the CP mode at 10.5T in vivo imaging.
We achieved good signal homogeneity with the TSE sequence as shown in Figure 9. The following factors contributed to this result:
With multiple refocusing pulses, the relationship between signal and flip angle is close to sin(α/2). This allowed us to achieve a more homogeneous image intensity compared with a conventional spin-echo sequence.47
The transmit profile is strongest in the center whereas the receiver profile is strongest in the periphery. The image intensity depends on both, allowing us to achieve a more homogeneous image intensity than either would produce individually.
Targeting slightly higher than 180° flip angle at the center of the brain resulted in an extended region in the brain with acceptable homogeneity.
In this work, we used bench-top measurements of S-parameters for modeling our setup and demonstrated good agreement between experimental and simulated results. An alternative approach is to measure the S-matrix inside the scanner as demonstrated by Restivo et al.35 However, this approach requires additional hardware modification on the scanner (i.e., the installation of directional couplers).
A previously presented workflow35 is expanded for validating EM simulations of multichannel arrays. The workflow is used to validate the safety of an 8-channel Tx/Rx coil and to calculate safe power limits for human head imaging at 10.5T. Using the validated array, we acquired the first in vivo human brain images at 10.5T. Future studies will focus on using advanced RF parallel transmit48,49 methods as well as design and validation of novel coil arrays with higher channel count.
Supplementary Material
FIGURE S1 Experimental and simulated maps corresponding to 8 individual channel excitations while the phantom is positioned at the center of the coil
FIGURE S2 Simulated against measured values corresponding to 8 individual channel excitations on the axial plane of the phantom centered inside the coil
FIGURE S3 Simulated against measured values corresponding to 4 different excitation scenarios (i.e., CP mode, linear mode, zero phase difference, and random excitations) on the axial plane of the phantom centered (first row) and off-centered (second row) inside the coil
FIGURE S4 Statistics of the error in the peak SAR10g estimation corresponding to the possible error occurrence in map simulations for 4 different excitation scenarios (i.e., CP mode, linear mode, zero phase difference, and random excitations) inside the phantom positioned at the center of the coil. The Monte-Carlo simulation has been done using 1 million random perturbations in excitation signal of each individual channel (in each excitation scenario) then propagation these perturbations to the error in B1 maps and peak SAR estimation
FIGURE S5 maps corresponding to 4 different excitations while the phantom is positioned at the center of the coil. First row, Experimental results. Second row, Simulated results obtained using the workflow proposed in this study. Third row, Simulated results obtained by excluding the co-simulation optimization from the workflow proposed in this study. Fourth row, Simulated results obtained using the workflow proposed in this study and ignoring the cable lengths
TABLE S1 Quantitative comparison between the simulated and measure maps corresponding to Supporting Information Figure S1, Figure 5, and Figure 6
TABLE S2 Quantitative comparison between the simulated and measure maps corresponding to Supporting Information Figure S5 (third and fourth rows)
Acknowledgments
Funding information
National Institutes of Health, Grant/Award Number: P41 RR008079; National Institute of Biomedical Imaging and Bioengineering, Grant/Award Number: P41 EB027061
Footnotes
SUPPORTING INFORMATION
Additional supporting information may be found online in the Supporting Information section.
REFERENCES
- 1.Edelstein WA, Glover GH, Hardy CJ, Redington RW. The intrinsic signal-to-noise ratio in NMR imaging. Magn Reson Med. 1986;3:604–618. [DOI] [PubMed] [Google Scholar]
- 2.Ocali O, Atalar E. Ultimate intrinsic signal-to-noise ratio in MRI. Magn Reson Med. 1998;39:462–473. [DOI] [PubMed] [Google Scholar]
- 3.Cho Z-H, Kang C-K, Han J-Y, et al. Observation of the lenticulo-striate arteries in the human brain in vivo using 7.0 T MR angiography. Stroke. 2008;39:1604–1606. [DOI] [PubMed] [Google Scholar]
- 4.Duyn JH, van Gelderen P, Li T-Q, de Zwart JA, Koretsky AP, Fukunaga M. High-field MRI of brain cortical substructure based on signal phase. Proc Natl Acad Sci U S A. 2007;104:11796–11801. [DOI] [PMC free article] [PubMed] [Google Scholar]
- 5.Nakada T, Matsuzawa H, Igarashi H, Fujii Y, Kwee IL. In vivo visualization of senile-plaque-like pathology in Alzheimer’s disease patients by MR microscopy on a 7T system. J Neuroimaging. 2008;18:125–129. [DOI] [PubMed] [Google Scholar]
- 6.Vaughan T, DelaBarre L, Snyder C, et al. 9.4 T human MRI: preliminary results. Magn Reson Med. 2006;56:1274–1282. [DOI] [PMC free article] [PubMed] [Google Scholar]
- 7.Abduljalil AM, Schmalbrock P, Novak V, Chakeres DW. Enhanced gray and white matter contrast of phase susceptibility-weighted images in ultra-high-field magnetic resonance imaging. J Magn Reson Imaging. 2003;18:284–290. [DOI] [PubMed] [Google Scholar]
- 8.van der Zwaag W, Schäfer A, Marques JP, Turner R, Trampel R. Recent applications of UHF-MRI in the study of human brain function and structure: a review. NMR Biomed. 2016;29:1274–1288. [DOI] [PubMed] [Google Scholar]
- 9.Raaijmakers AJE, Steensma BR. Local SAR assessment for multi-transmit systems: a study on the peak local SAR value as a function of magnetic field strength. eMagRes. 2019:1–10. [Google Scholar]
- 10.Winter L, Niendorf T. Electrodynamics and radiofrequency antenna concepts for human magnetic resonance at 23.5 T (1 GHz) and beyond. Magn Reson Mater Phys Biol Med. 2016;29:641–656. [DOI] [PubMed] [Google Scholar]
- 11.Wang Z, Lin JC, Mao W, Liu W, Smith MB, Collins CM. SAR and temperature: simulations and comparison to regulatory limits for MRI. J Magn Reson Imaging. 2007;26:437–441. [DOI] [PMC free article] [PubMed] [Google Scholar]
- 12.Collins CM, Liu W, Wang J, et al. Temperature and SAR calculations for a human head within volume and surface coils at 64 and 300 MHz. J Magn Reson Imaging. 2004;19:650–656. [DOI] [PubMed] [Google Scholar]
- 13.International Electrotechnical C. International standard, medical equipment—IEC 60601-2-33: particular requirements for the safety of magnetic resonance equipment for medical diagnosis: Geneva, Switzerland: International Electrotechnical Commission, 2010. [Google Scholar]
- 14.Adriany G, Van de Moortele P-F, Wiesinger F, et al. Transmit and receive transmission line arrays for 7 Tesla parallel imaging. Magn Reson Med. 2005;53:434–445. [DOI] [PubMed] [Google Scholar]
- 15.Metzger GJ, Snyder C, Akgun C, Vaughan T, Ugurbil K, Van de Moortele PF. Local B1+ shimming for prostate imaging with transceiver arrays at 7T based on subject-dependent transmit phase measurements. Magn Reson Med. 2008;59:396–409. [DOI] [PMC free article] [PubMed] [Google Scholar]
- 16.Vaughan JT, Hetherington HP, Otu JO, Pan JW, Pohost GM. High frequency volume coils for clinical NMR imaging and spectroscopy. Magn Reson Med. 1994;32:206–218. [DOI] [PubMed] [Google Scholar]
- 17.Thalhammer C, Renz W, Winter L, et al. Two-dimensional sixteen channel transmit/receive coil array for cardiac MRI at 7.0 T: design, evaluation, and application. J Magn Reson Imaging. 2012;36:847–857. [DOI] [PMC free article] [PubMed] [Google Scholar]
- 18.Raaijmakers AJE, Ipek O, Klomp DWJ, et al. Design of a radiative surface coil array element at 7 T: the single-side adapted dipole antenna. Magn Reson Med. 2011;66:1488–1497. [DOI] [PubMed] [Google Scholar]
- 19.Raaijmakers AJE, Italiaander M, Voogt IJ, et al. The fractionated dipole antenna: a new antenna for body imaging at 7 Tesla. Magn Reson Med. 2016;75:1366–1374. [DOI] [PubMed] [Google Scholar]
- 20.Steensma B, Andrade AV, Klomp DW, Van den Berg CA, Luijten PR, Raaijmakers AJ. Body imaging at 7 Tesla with much lower SAR levels: an introduction of the Snake Antenna array. In: Proceedings of the 24th Annual Meeting of ISMRM, Singapore, 2016. Abstract 0395. [Google Scholar]
- 21.Lagore RL, DelaBarre L, Yang QX, et al. High dielectric constant (HDC) disk dipoles for 10.5T imaging. In: Proceedings of the 25th Annual Meeting of ISMRM, Honolulu, HI, 2017. Abstract 1128. [Google Scholar]
- 22.Chen G, Sodickson D, Wiggins G. 3D curved electric dipole antenna for propagation delay compensation. In: Proceedings of the 23rd Annual Meeting of ISMRM, Toronto, ON, Canada, 2015. Abstract 0857. [Google Scholar]
- 23.Oezerdem C, Winter L, Graessl A, et al. 16-channel bow tie antenna transceiver array for cardiac MR at 7.0 tesla. Magn Reson Med. 2016;75:2553–2565. [DOI] [PubMed] [Google Scholar]
- 24.Sadeghi-Tarakameh A, Torrado-Carvajal A, Ariyurek C, et al. Optimizing the topography of transmit coils for SAR management. In: Proceedings of the 26th Joint Annual Meeting of ISMRM-ESMRMB, Paris, France, 2018. Abstract 0297. [Google Scholar]
- 25.Sadeghi-Tarakameh A, Torrado-Carvajal A, Lagore RL, et al. Toward human head imaging at 10.5 T Using an eight-channel transmit/receive array of bumped fractionated dipoles. In: Proceedings of the 27th Annual Meeting of ISMRM, Montreal, QC, Canada, 2019. Abstract 0430. [Google Scholar]
- 26.Voigt T, Homann H, Katscher U, Doessel O. Patient-individual local SAR determination: in vivo measurements and numerical validation. Magn Reson Med. 2012;68:1117–1126. [DOI] [PubMed] [Google Scholar]
- 27.Alon L, Deniz CM, Brown R, Sodickson DK, Zhu Y. Method for in situ characterization of radiofrequency heating in parallel transmit MRI. Magn Reson Med. 2013;69:1457–1465. [DOI] [PMC free article] [PubMed] [Google Scholar]
- 28.Homann H, Börnert P, Eggers H, Nehrke K, Dössel O, Graesslin I. Toward individualized SAR models and in vivo validation. Magn Reson Med. 2011;66:1767–1776. [DOI] [PubMed] [Google Scholar]
- 29.Jin J, Liu F, Weber E, Crozier S. Improving SAR estimations in MRI using subject-specific models. Phys Med Biol. 2012;57:8153. [DOI] [PubMed] [Google Scholar]
- 30.Christ A, Kainz W, Hahn EG, et al. The Virtual Family—development of surface-based anatomical models of two adults and two children for dosimetric simulations. Phys Med Biol. 2009;55:N23. [DOI] [PubMed] [Google Scholar]
- 31.Dimbylow PJ. Fine resolution calculations of SAR in the human body for frequencies up to 3 GHz. Phys Med Biol. 2002;47:2835. [DOI] [PubMed] [Google Scholar]
- 32.Hoffmann J, Henning A, Giapitzakis IA, et al. Safety testing and operational procedures for self-developed radiofrequency coils. NMR Biomed. 2016;29:1131–1144. [DOI] [PubMed] [Google Scholar]
- 33.Bitz AK, Kraff O, Orzada S, et al. Assessment of RF safety of transmit coils at 7 Tesla by experimental and numerical procedures. In: Proceedings of the 19th Annual Meeting of ISMRM, Motreal, QC, Canada, 2011. Abstract 490. [Google Scholar]
- 34.Eryaman Y, Lagore RL, Ertürk MA, et al. Radiofrequency heating studies on anesthetized swine using fractionated dipole antennas at 10.5 T. Magn Reson Med. 2018;79:479–488. [DOI] [PMC free article] [PubMed] [Google Scholar]
- 35.Restivo M, Raaijmakers A, van den Berg C, Luijten P, Hoogduin H. Improving peak local SAR prediction in parallel transmit using in situ S-matrix measurements. Magn Reson Med. 2017;77:2040–2047. [DOI] [PubMed] [Google Scholar]
- 36.Kozlov M, Turner R. Fast MRI coil analysis based on 3-D electromagnetic and RF circuit co-simulation. J Magn Reson. 2009;200:147–152. [DOI] [PubMed] [Google Scholar]
- 37.Wu X, Schmitter S, Auerbach EJ, Uğurbil K, Van de Moortele P-F. Mitigating transmit B1 inhomogeneity in the liver at 7T using multi-spoke parallel transmit RF pulse design. Quant Imaging Med Surg. 2014;4:4. [DOI] [PMC free article] [PubMed] [Google Scholar]
- 38.Yarnykh VL. Actual flip-angle imaging in the pulsed steady state: a method for rapid three-dimensional mapping of the transmitted radiofrequency field. Magn Reson Med. 2007;57:192–200. [DOI] [PubMed] [Google Scholar]
- 39.Clarke FH. Optimization and nonsmooth analysis. Siam 1990;5:25–95. [Google Scholar]
- 40.Eryaman Y, Zhang P, Utecht L, et al. Investigating the physiological effects of 10.5T static field exposure on anesthetized swine. Magn Reson Med. 2018;79:511–514. [DOI] [PMC free article] [PubMed] [Google Scholar]
- 41.Grant A, Kulesa J, He X, et al. Safety evaluation of human exposure to a 10.5T whole body magnet: protocol design and preliminary results. In: Proceedings of the 27th Annual Meeting of ISMRM, Motreal, QC, Canada, 2019. Abstract 0797. [Google Scholar]
- 42.de Greef M, Ipek O, Raaijmakers AJE, Crezee J, van den Berg CAT. Specific absorption rate intersubject variability in 7T parallel transmit MRI of the head. Magn Reson Med. 2013;69:1476–1485. [DOI] [PubMed] [Google Scholar]
- 43.Wang Z, Collins CM, Zhao S, Robb FJ. The effect of human model resolution on numerical calculation of SAR and temperature in MRI. In: Proceedings of the 17th Annual Meeting of ISMRM, Honolulu, HI, 2009. Abstract 4797. [Google Scholar]
- 44.Le Garrec M, Gras V, Hang MF, Ferrand G, Luong M, Boulant N. Probabilistic analysis of the specific absorption rate intersubject variability safety factor in parallel transmission MRI. Magn Reson Med. 2017;78:1217–1223. [DOI] [PubMed] [Google Scholar]
- 45.Shao Y, Zeng P, Wang S. Statistical simulation of SAR variability with geometric and tissue property changes by using the unscented transform. Magn Reson Med. 2015;73:2357–2362. [DOI] [PMC free article] [PubMed] [Google Scholar]
- 46.Beqiri A, Hand JW, Hajnal JV, Malik SJ. Comparison between simulated decoupling regimes for specific absorption rate prediction in parallel transmit MRI. Magn Reson Med. 2015;74:1423–1434. [DOI] [PMC free article] [PubMed] [Google Scholar]
- 47.Hennig J Multiecho imaging sequences with low refocusing flip angles. J Magn Reson (1969). 1988;78:397–407. [Google Scholar]
- 48.Zhu Y Parallel excitation with an array of transmit coils. Magn Reson Med. 2004;51:775–784. [DOI] [PubMed] [Google Scholar]
- 49.Katscher U, Börnert P, Leussler C, Van Den Brink JS. Transmit sense. Magn Reson Med. 2003;49:144–150. [DOI] [PubMed] [Google Scholar]
Associated Data
This section collects any data citations, data availability statements, or supplementary materials included in this article.
Supplementary Materials
FIGURE S1 Experimental and simulated maps corresponding to 8 individual channel excitations while the phantom is positioned at the center of the coil
FIGURE S2 Simulated against measured values corresponding to 8 individual channel excitations on the axial plane of the phantom centered inside the coil
FIGURE S3 Simulated against measured values corresponding to 4 different excitation scenarios (i.e., CP mode, linear mode, zero phase difference, and random excitations) on the axial plane of the phantom centered (first row) and off-centered (second row) inside the coil
FIGURE S4 Statistics of the error in the peak SAR10g estimation corresponding to the possible error occurrence in map simulations for 4 different excitation scenarios (i.e., CP mode, linear mode, zero phase difference, and random excitations) inside the phantom positioned at the center of the coil. The Monte-Carlo simulation has been done using 1 million random perturbations in excitation signal of each individual channel (in each excitation scenario) then propagation these perturbations to the error in B1 maps and peak SAR estimation
FIGURE S5 maps corresponding to 4 different excitations while the phantom is positioned at the center of the coil. First row, Experimental results. Second row, Simulated results obtained using the workflow proposed in this study. Third row, Simulated results obtained by excluding the co-simulation optimization from the workflow proposed in this study. Fourth row, Simulated results obtained using the workflow proposed in this study and ignoring the cable lengths
TABLE S1 Quantitative comparison between the simulated and measure maps corresponding to Supporting Information Figure S1, Figure 5, and Figure 6
TABLE S2 Quantitative comparison between the simulated and measure maps corresponding to Supporting Information Figure S5 (third and fourth rows)


