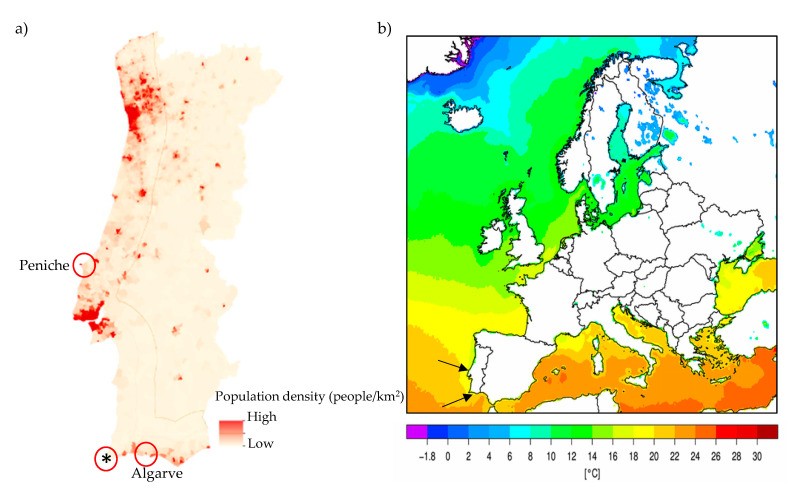
Figure 1.
Localization of the fish sampling regions studied. (a) Population density on Portuguese coast (adapted) [16]; * indicates aquaculture sampling site. (b) Sea surface temperature during the summer of 2017 in Europe. Black arrows indicate the sampling sites on the Portuguese coast (adapted) [17].

