. 2020 Oct 26;9:e58889. doi: 10.7554/eLife.58889

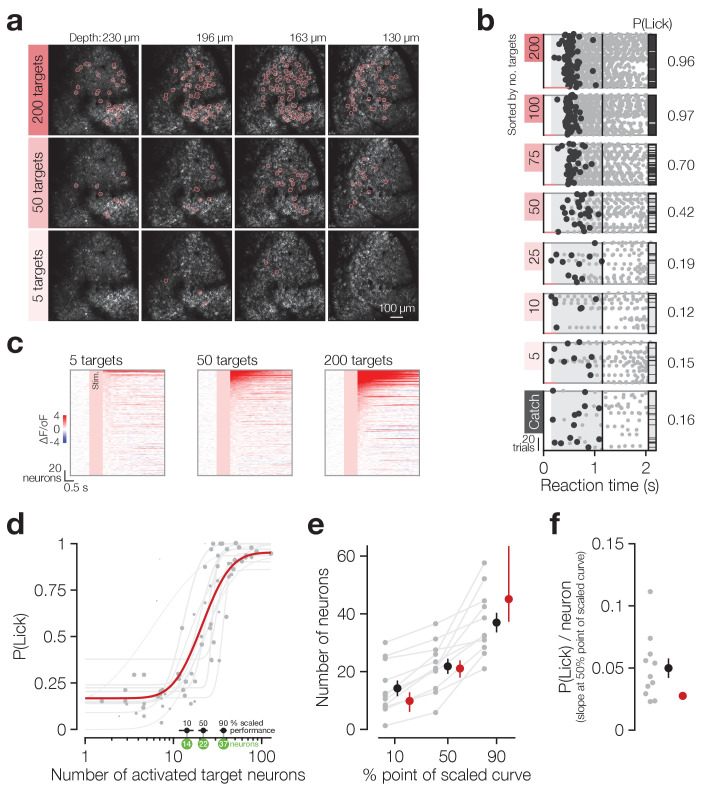
Figure 2. Animals detect the targeted activation of tens of neurons.

(a) Example imaging volumes from an experiment showing 200 (top), 50 (middle) and 5 (bottom) targeted C1V1-expressing neurons. (b) Example lick raster concatenating an animal’s two psychometric curve testing sessions. Trials were delivered pseudo-randomly (see Materials and methods) but have been sorted by trial type for display. Stimulus durations are indicated by coloured bars along the bottom of each raster. Animals respond on more trials and with less variable timing as more neurons are targeted. (c) Example responses across the top 200 most responsive neurons in the 200 target zones (see Materials and methods; Figure 2—figure supplement 1). Neurons have been sorted separately in each plot. Pink boxes indicate the stimulus artefact exclusion epoch which is consistent across all trial types (see Materials and methods for definition). (d) The psychometric function relating the number of activated target neurons to the behavioural detection rate for all 2P psychometric curve sessions. Individual data (grey dots) are grouped by trial type within session (number of target zones) and plotted as the average number of target neurons activated across all trials of each type. Data point size indicates the number of trials of each type (29 ± 8 trials, range 11–44, across data points). Individual psychometric curve fits for each session are plotted (grey lines) weighted by the total number of stimulus trials in the session (202 ± 50 trials, range 97–245, across sessions). The number of neurons required to reach the 10%, 50% and 90% points of these individual scaled psychometric curves are shown as black error bars and green circles about the x-axis. The aggregate psychometric curve fit across all trial types, all sessions, is plotted in red. Note that individual curves are often steeper than the aggregate curve. (e) The number of neurons required to reach the 10%, 50%, and 90% points of the scaled psychometric curves in (d). Grey data points/lines are quantified from individual psychometric curve fits (grey lines in d) and summarised by the black error bars. Red data points are quantified from the aggregate psychometric curve fit (red line in d) ± confidence intervals. (f) The slope at the 50% point of the scaled curves corresponding to the additional probability of detection (P(Lick)) added per target neuron activated. Grey data points are quantified from individual psychometric curve fits (grey lines in d) and are summarised by the black error bar. The red circle is quantified from the aggregate psychometric curve fit (red line in d) for which no confidence intervals can be calculated (see Materials and methods). N = 11 sessions, 6 mice, 1–2 sessions each. All data error bars are mean ± s.e.m. and all fit parameter error bars are estimate ± confidence intervals.

Figure 2.

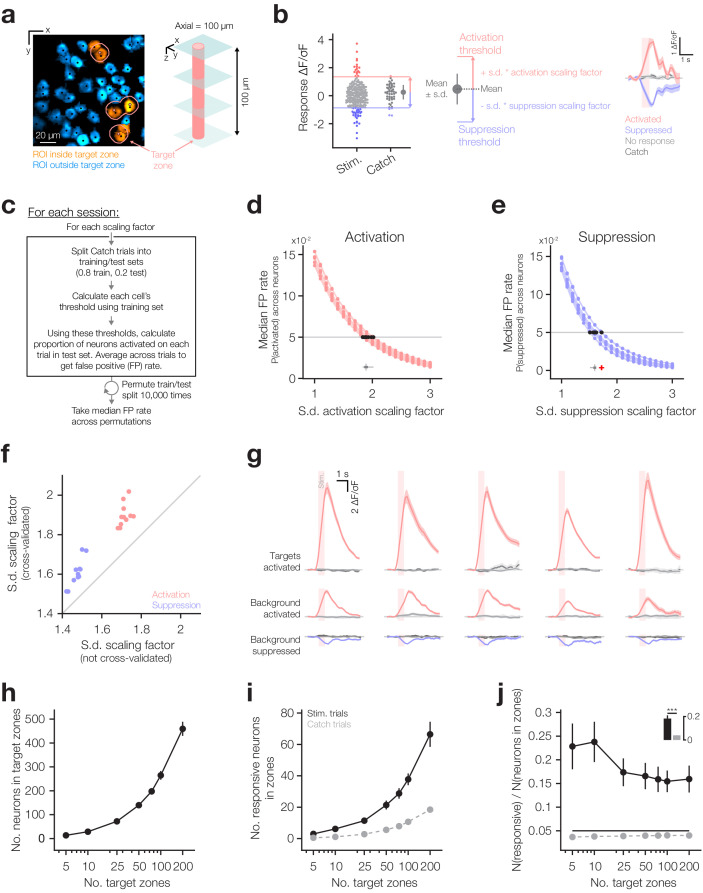
Figure 2—figure supplement 1. Quantification of neuronal responses.

Figure 2—figure supplement 1.

(a) Example target zones. Left: section of a plane in a volumetric FOV showing Suite2P ROIs (coloured regions), Suite2P centroids (black dots), target co-ordinates (pink dots) and lateral extent of target zone (pink circles; 10 µm radius). ROIs with centroids within the target exclusion zones are considered potential targets (orange ROIs), ROIs outside these regions are considered background neurons (blue ROIs). Right: schematic illustrating axial extent of target zone. (b) Rationale behind activation and suppression thresholds calculated from correct reject (CR) catch trial responses and illustration of the results of our threshold procedure (described in c–e). Left: trial-wise responses for a single non-target neuron on stimulus trials of all types and CR catch trials. The mean and standard deviation of responses on CR catch trials can be used to infer activation and suppression thresholds that separate stimulus evoked activation (red) and suppression (blue) responses from the majority of CR catch trial responses. Middle: activation and suppression thresholds are computed as the mean + or – the standard deviation respectively, scaled by a scaling factor (separate scaling factors for activation and suppression). Right: average responses on trials where this neuron was activated (red), suppressed (blue) or unresponsive (light grey). Catch trials are also included (dark grey). Such a procedure separates positive and negative going responses from non-responsive trials which should themselves be indistinguishable from catch trials. (c) Procedure for inferring cross-validated positive and negative standard deviation scaling factors that yield a 5% false positive response rate on catch trials for each session’s volumetric FOV. For each session’s data, and each threshold type (i.e. activation threshold), we sweep through a series of scaling factors. For each factor we permute a 80:20 train:test split of correct reject (CR) catch trials 10,000 times. On each permutation, we use the scaling factor and that permutation’s training CR catch trials to calculate each neuron’s threshold. Using these neuron-wise thresholds, we then compute the proportion of neurons activated on each testing CR catch trial and average across trials (false positive rate; FP). We then take the median FP across all permutations at this scaling factor before moving to the next scaling factor. We can then infer the scaling factor that yields a 5% FP rate on testing CR catch trials across permutations. (d) Relationship between standard deviation scaling factor and FP rate for the activation threshold. Data points are empirically quantified values, fits are cubic interpolations. The optimal scaling factor for each experiment (horizontal boxplot) is inferred by finding the scaling factor for which the fitted FP rate is 5% (horizontal line). (e) Relationship between the standard deviation scaling factor and FP rate for the suppression threshold. Data conventions and scaling factor inference the same as (d). (f) Scaling factors that yield 5% false positive rate when all correct reject catch trials are used (not cross-validated, i.e. thresholds inferred and tested on same trials) compared to those yielded by the cross-validation procedure described in (c–e). Cross-validation yields more stringent thresholds. (g) Example traces from one session for five activated target neurons (top row), five activated background neurons (middle row) and five suppressed background neurons (bottom row) illustrating responses yielded by our procedure. Averages across all activated/suppressed trials are shown in red/blue and averages across catch trials/non-responsive stimulus trials are shown in light and dark grey, respectively. Note that neurons in each column are unrelated. (h) The number of neurons in all target zones for each trial type (as defined in (a) and Materials and methods). (i) The number of responsive neurons in all target zones for each trial type on both stimulus trials (black) and catch trials (grey). (j) Proportion of responsive neurons in all target zones for each trial type on both stimulus trials (black) and catch trials (grey) quantified as the number of responsive neurons in target zones (i) divided by the number of neurons in target zones (h). Inset: Proportion of target zone neurons that are responsive on stimulus trials compared to catch trials. N = 11 sessions, 6 mice, 1–2 sessions each for all group data plots. Error bars and shading are s.e.m.
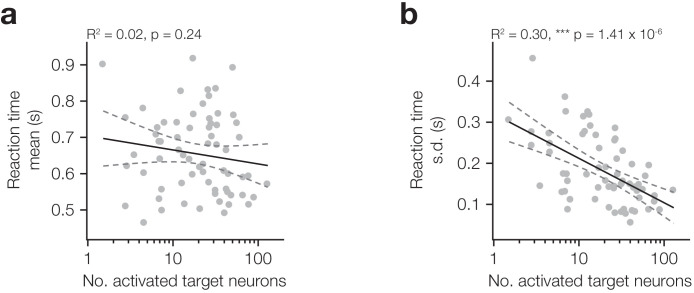
Figure 2—figure supplement 2. Reaction time standard deviation, but not mean, scales with the number of target neurons activated.

Figure 2—figure supplement 2.

(a–b) Relationship between mean (a) and standard deviation (b) of reaction time and the number of activated target neurons.
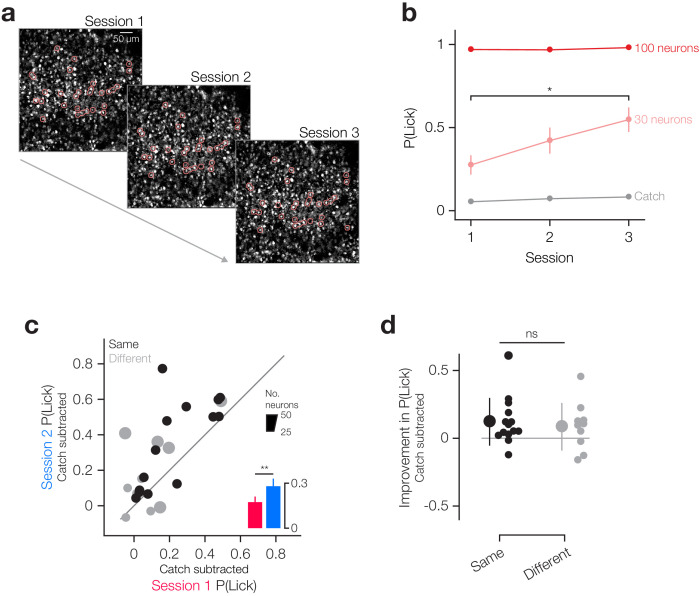
Figure 2—figure supplement 3. Detection of small ensembles of neurons improves across days irrespective of whether the same neurons were targeted.

Figure 2—figure supplement 3.

(a) FOV from training sessions across 3 consecutive days where we stimulated the same 30 neurons each day. (b) Average behavioural response rates for 100 neuron, 30 neuron and catch trial conditions for all sessions where we stimulated the same neurons across days (N = 14 mice). (c) Improvement in response rates from session 1 to session 2. Sessions in which we targeted the same neurons are shown in black and sessions where we targeted different neurons in grey. Data-point size denotes number of targeted neurons, scale inset (same neurons group N = 14 mice, different neurons group N = 5 mice, 2 stim types each). (d) Sessions targeting the same neurons showed a similar amount of improvement as sessions targeting different neurons (same neurons group N = 14 mice, different neurons group N = 5 mice, two stim types each). All error bars are s.e.m.