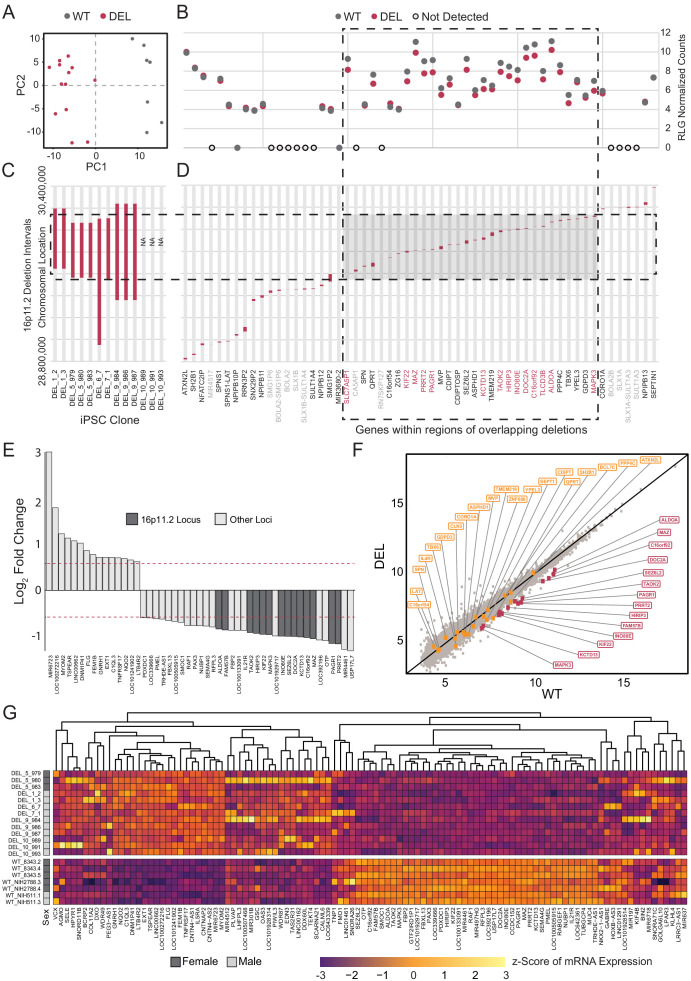
Figure 5. Deletion intervals and differential expression of genes at the 16p11.2 locus.
See also Supplementary files 5 and 6; Figure 5—figure supplements 1, 2, 3 and 4. (A) PCA of variance-stabilized count data after normalization and batch correction reveals that samples cluster by 16p11.2 deletion status within the first two PCs. Axes represent the first two principal components (PC1, PC2). (B) RLG normalized counts of each transcript within the 16p11.2 interval. WT = black symbols, DEL = red symbols, transcripts not detected = gray symbols. (C) Known deletion intervals in integration-free hiPSC clones that were included in the RNA-seq analysis of differentially expressed genes within the 16p11.2 locus. NA, breakpoint information was not available from the Simons Foundation. (D) Canonical gene symbols located between chromosome 16 location 28,800,000 and 30,400,000. Transcripts that reach significance as differentially expressed between WT and DEL clones (FDR < 0.05) are indicated in red. Labels for transcripts that were below detection limits are marked in light gray. (E) Differentially expressed genes that are up- or downregulated at least 1.5-fold. Red lines represent threshold of 1.5-fold change. Genes falling within the 16p11.2 deletion region are highlighted. (F) VST-normalized and batch corrected expression for all genes across all WT clones (X-axis) and DEL clones (Y-axis). Highlighted points represent 16p11.2 region genes that were either called differentially expressed (Red) or not differentially expressed in our pipeline (Orange). (G) Heatmap of gene expression for all the differentially expressed genes identified with DESeq2. Fill values represent counts that have been normalized and scaled using a variance-stabilizing transformation implemented by DESeq, and batch effect corrected using limma and SVA. Sex of the subject is indicated on the left.


