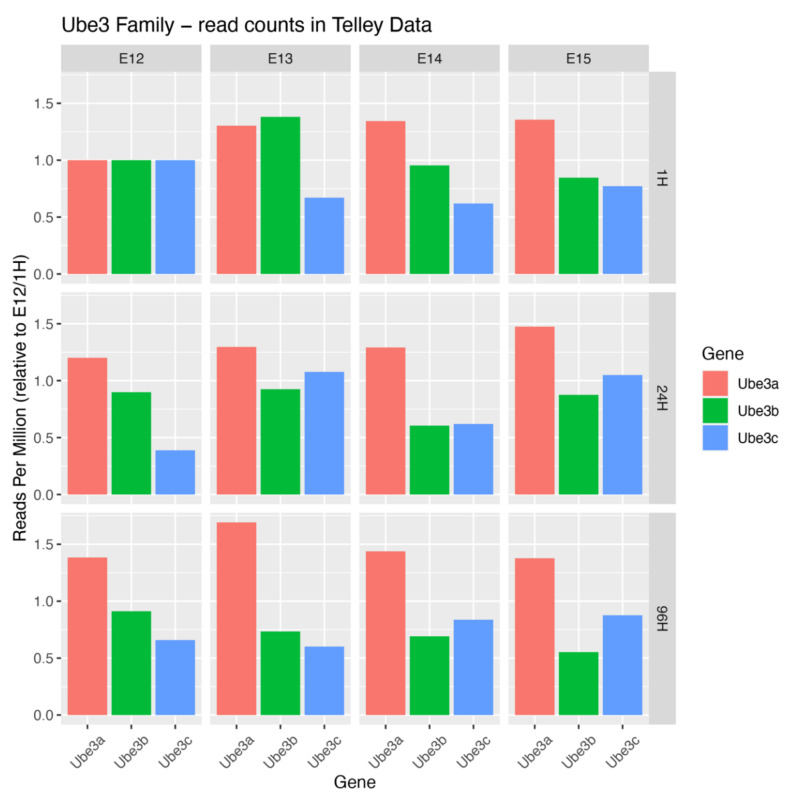
Figure 2.
Expression levels of Ube3 ligase genes in developing cortex. To plot expression levels of Ube genes, we downloaded the digital gene expression matrix (DGE) provided by Telley et al. [3], in which cells are annotated by the time of collection, and time since FlashTag labelling. We grouped all cells with the same annotation to counts per-gene, and by summing all such values we calculated a “library size” combination of variables, normalizing the counts to control for the number of cells of each type collected. For each gene, we then normalized the count values to the value at the earliest time of collection and “flashtagging”, in order to plot relative change in expression over time.

