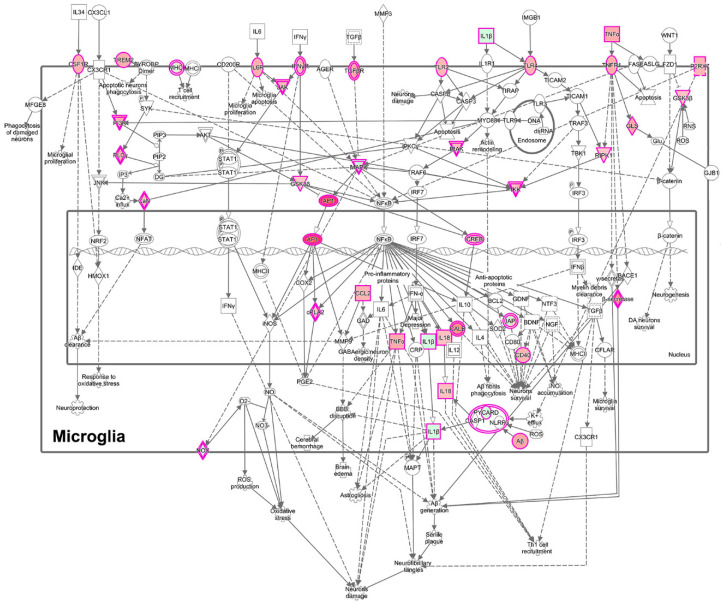
Figure 11.
Enrichment of the neuroinflammatory pathway in microglia in cluster 1, based on the DEGs between cluster 1 and clusters 2–5. Cluster 1 is comprised predominately of cells from SIVE animals. The pink border indicates molecules with expression data, and the double border indicates a group or complex of molecules. Orange fill indicates increased expression, green decreased expression. Figure adapted from an IPA-generated diagram.

