Abstract
Background:
Breast cancer is the most common cancer accounting for about one-fourth of total cancer cases and 15% of all cancer deaths among women worldwide. It is important to determine its trend across the regions in the world to find the high-focus regions. Hence, the current study was done to assess the global trends and deviations in the incidence of breast cancer.
Materials and Methods:
A descriptive trend analysis was done using the data on breast cancer incidence from the WHO Cancer Incidence Data of Five Continents plus database. Joinpoint regression was performed to determine the average annual percent change (AAPC), and age-period-cohort analysis was done to obtain age-, period-, and cohort-specific deviations and rate ratio.
Results:
All the regions showed an increasing trend in breast cancer incidence, with an exception of America. Maximum increase was observed in Asia (AAPC = 2.6%; 95% confidence interval [CI]: 2.4%–2.9%) followed by Europe (AAPC = 0.7%; 95% CI: 0.5%–1%). There was consistent rise in the breast cancer incidence across the age groups in all the four continents with maximum burden in elderly (P < 0.001). Except in America, all other regions showed consistent rise in the incidence of breast cancer through the periods 1998–2002 to 2007–2012 (P < 0.001). There was consistent increase across the cohorts from 1923–1927 to 1978–1982 in continents such as Asia and Oceania (P < 0.001).
Conclusion:
To summarize, the incidence of breast cancer shows an increasing trend globally with a maximum increase in the Asian region. This makes a strong need for newer strategies irrespective of current prevention and control interventions.
Keywords: Age-period-cohort analysis, breast cancer, incidence, joinpoint regression, trend analysis
INTRODUCTION
Cancer accounts to a maximum number of deaths worldwide among women in both high-income and middle-income countries.[1] Breast cancer primarily affects women of both developed and developing countries. It is now currently the most common cancer affecting women, with around 1.7 million cases and 521,900 deaths in 2012.[2] It is the most common cancer among 140 out of the 184 counties and accounts to about one-fourth of the cancer cases and 15% of all cancer deaths among women worldwide.[3]
The incidence rates of breast cancer vary from 19.3/100,000 women in Eastern Africa to 89.7/100,000 women in Western Europe, with most developing nations having rates <40/100,000.[4] The highest rates are observed in North America, Oceania, and Europe, while the lowest rates are recorded in Africa.[5] These increased rates can be attributed to differences in reproductive factors, use of hormone therapy, variation in dietary pattern, lower parity shorter breastfeeding, and better screening strategies between the countries.[6] The survival rates also vary greatly ranging from 80% among the developed countries to 40% in underdeveloped countries.[7] These differences are most likely be due to variations in the early detection strategies and availability of treatment modalities.[8]
An increasing trend is observed especially among the developing countries due to advances in life expectancy (availability of better healthcare services and improved health-seeking behavior), economic transition, changes in reproductive factors (late first child, early menarche, late menopause, and nulliparity), and risk factor patterns such as smoking, excess body weight, alcohol use, oral contraceptive pills usage, and reduced physical inactivity.[9] Despite the burden and mortality, these cancers can cause huge economic burden through direct medical and nonmedical and indirect costs.[10] It is thus important to focus on specific prevention and treatment strategies to prevent catastrophic health expenditure, especially among the developing and underdeveloped countries. Tackling these known risk factors, through primary prevention activities, could avert about one-third to one-half of the total cancer burden and mortality.[8] Before the initiation of preventive measures, it is important to determine the trend of breast cancer across the regions in the world. Worldwide comparisons of breast cancer trends would enable us to identify higher focus regions and also serve as an opportunity to assess the impact of screening efforts initiated by them. It will also help in finding whether there is any need for newer strategies if an increasing trend is found, irrespective of the current prevention and control interventions.
However, there is still a gap in the knowledge about trend of breast cancer over the years, especially during the period where epidemiological transition occurred from communicable to noncommunicable diseases. Hence, the current study was done to assess the trends and deviations in the incidence of breast cancer from 1993 to 2012 among individuals aged between 30 and 79 years using the WHO Cancer Incidence Data of Five Continents using joinpoint regression and age-period-cohort analysis.
MATERIALS AND METHODS
Study design and data sources
This is a descriptive trend analysis with secondary data obtained from the WHO Cancer Incidence in Five Continents plus database (CI5 plus) between 1993 and 2012.[11] Access to annual incidence rates for 41 countries (108 cancer registries) was obtained through CI5 plus, but national data were available for only 21 countries. Aggregated regional data from individual registries were considered as the proxy indicators for national data from the remaining nations. The parameters considered for obtaining data on new breast cancer cases were site (International Classification of Disease-10 Code C50), 5-year age groups from population-based cancer registries (national or regional), and year of diagnosis.
The five continents were Asia, America, Africa, Europe, and Oceania. However, Africa cannot be included in the analysis as the data were available for only one register with many zero values, which are difficult to analyze. Data were available from 1993 for Oceania while other continents had data available from 1998.
Statistical analysis
Joinpoint regression
First, the age-standardized incidence rate per 100,000 population was calculated by direct standardization. World standard population proposed by Segi and modified by Doll et al. was used for standardization.[12,13]
The Joinpoint Regression Program (version 4.7.0) is software developed by the United States (US) National Cancer Institute (NCI) to perform trend analysis for the incidence and mortality rates. It has been previously used to assess the trend of several other cancers, such as gastric cancer and esophageal cancer.[14,15,16] The annual percent change (APC) using joinpoint regression was used to examine the age-standardized rates (ASRs) during the study period.[17] The best fitting point called “joinpoint” where a statistically significant change occurs was identified by joinpoint analysis. Furthermore, the trends between the joinpoints can be assessed using this analysis. The grid search method was used for fitting the segmented line regression and hence to determine the best fit for each model.[18] Significance was tested using Monte Carlo permutation method with 4499 randomly selected datasets. P < 0.05 was considered as statistically significant.[19]
Joinpoint regression model of the natural log transformed rates, with a maximum number of three joinpoints, was used to calculate the APC, which was used to determine whether the incidence rate of breast cancer in the model differs from the null hypothesis. 95% confidence interval (CI) for each APC was calculated to determine the statistical significance of APC in each segment. The magnitude and direction of recent trends were determined using average APC (AAPC) with 95% CI.
Age-period-cohort analysis
Oceania had ten 5-year age interval (30–34, 35–39, 40–44, 45–49, 50–54, 55–59, 60–64, 65–69, 70–74, 75–79 years) and four 5-year calendar periods (1993–1997, 1998–2002, 2003–2007, and 2008–2012) for the calculation of incidence rate. However, only for three 5-year calendar periods from 1998 were available for Asia, America, and Europe. Age and period classifications were used to identify 13 (10 + 4 − 1 = 13) consecutive 5-year birth cohorts for Oceania data (i.e., 1918–1922, 1923–1927, 1928–1932, 1933–1937, 1938–1942, 1943–1947, 1948–1952, 1953–1957, 1958–1962, 1963–1967, 1968–1972, 1973–1977, and 1978–1982) and 12 (10 + 3 − 1 = 12) consecutive 5-year birth cohorts for Asia, America, and Europe, except 1918–1922. The secular trend for incidence rate of breast cancer was assessed for the period 1993–2012, and the age-specific incidence rates for each birth cohort were calculated.
A web tool (https://analysistools.nci.nih.gov/apc/) developed by the Division of Cancer Epidemiology and Genetics under the US NCI was used for age-period-cohort analysis.[20] There had been a longstanding problem in conducting analysis using age-period-cohort model because of perfect collinearity that existed between the variables: age, period, and cohort. Identifiability issue arises as a result of intrinsic mathematical relation (age + cohort = period). This results in methodological challenge as the standard techniques of regression cannot be applied.[21] Hence, weighted least squares regression has been employed to partition the effects of age, period, and cohort, thereby applying it to health outcomes. It overcomes the issue of identifiability by using an algorithm which optimizes the estimation for all the three components separately.
The APC of the expected age-specific rates over time referred to as local drifts with its test of significance was calculated. Other parameters calculated were age, period, and cohort deviations. These were done to show the local changes in the trend independent of the direction and magnitude of the overall trend. Cross-sectional age curve (i.e., expected age-specific rates in the reference period adjusted for cohort effects) was also calculated and depicted. The effect of period and cohort parameters was assessed using period rate ratio and cohort rate ratio with 95% CI.[20]
Wald test which follows Chi-square distribution was used for hypothesis testing and was performed to check the statistically significance of trend and deviations in the incidence rates of breast cancer according to age, period, and cohort factors. P < 0.05 was considered statistically significant.
Ethical considerations
Data were obtained from freely available public domains, and it does not require ethical approval.
RESULTS
Breast cancer incidence
Oceania had the highest ASR (197.50 per 100,000 population) of breast cancer incidence followed by America (180.64 per 100,000 population) in 2012. Asia had the least ASR of breast cancer incidence with 110.31 cases per 100,000 population in 2012. The trend of ASR was also examined for all these four continents using joinpoint regression during the available time period.
Joinpoint regression
America
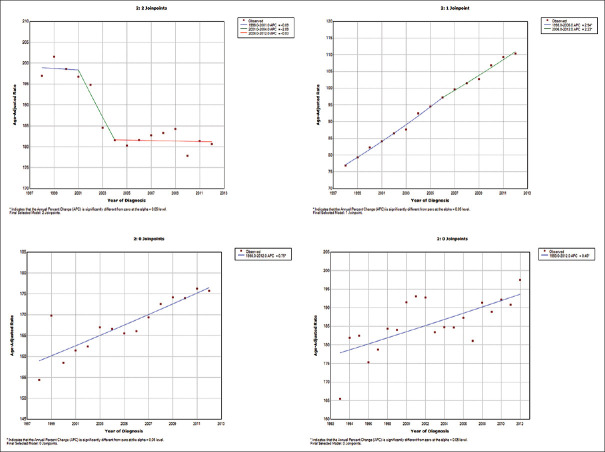
In America, the age-adjusted incidence per 100,000 population declined from 196.94 in 1998 to 180.64 in 2012. There was an annual declining trend in the breast cancer incidence during the study period (AAPC = −0.7; 95% CI: −1.5–0.2) [Figure 1a]. The number of joinpoints (i.e., statistically significant change in the trend) found was two (2001 and 2004). APC in the segment 1 (1998–2001) was − 0.1% (95% CI: −2.2%–2.1%), the segment 2 (2001–2004) was − 2.9% (−6.9%–1.3%), and the segment 3 (2004–2012) was − 0.1 (−0.5%–0.4%).
Figure 1.
(a) Trend of breast cancer incidence in America during the period 1993–2012 using joinpoint regression. (b) Trend of breast cancer incidence in Asia during the period 1998–2012 using joinpoint regression. (c) Trend of breast cancer incidence in Europe during the period 1998–2012 using joinpoint regression. (d) Trend of breast cancer incidence in Oceania during the period 1993–2012 using joinpoint regression
Asia
The age-adjusted incidence in Asia showed a significant increase over the years. It increased from 76.91 per 100,000 in 1998 to 110.31 per 100,000 in 2012 at an AAPC of 2.6% (95% CI: 2.4%–2.9%) [Figure 1b]. The number of joinpoint found was one (2006). APC in the segment 1 (1998–2006) was 2.9% (95% CI: 2.6%–3.3%) and the segment 2 (2006–2012) was 2.2% (95% CI: 1.8%–2.6%).
Europe
The age-adjusted incidence of breast cancer in Europe increased from 154.41 in 1998 to 175.69 per 100,000 population in 2012. The annual increasing trend in the breast cancer incidence was statistically significant (AAPC = 0.7%; 95% CI: 0.5%–1.0%) [Figure 1c]. There was no joinpoint during the study period.
Oceania
Oceania had an increase in the age-adjusted incidence rate from 165.52 in 1993 to 197.50 per 100,000 population in 2012. AAPC during the study period was 0.4% (95% CI: 0.2%–0.7%) [Figure 1d]. There was no joinpoint found during the study period.
Age-period-cohort analysis
America
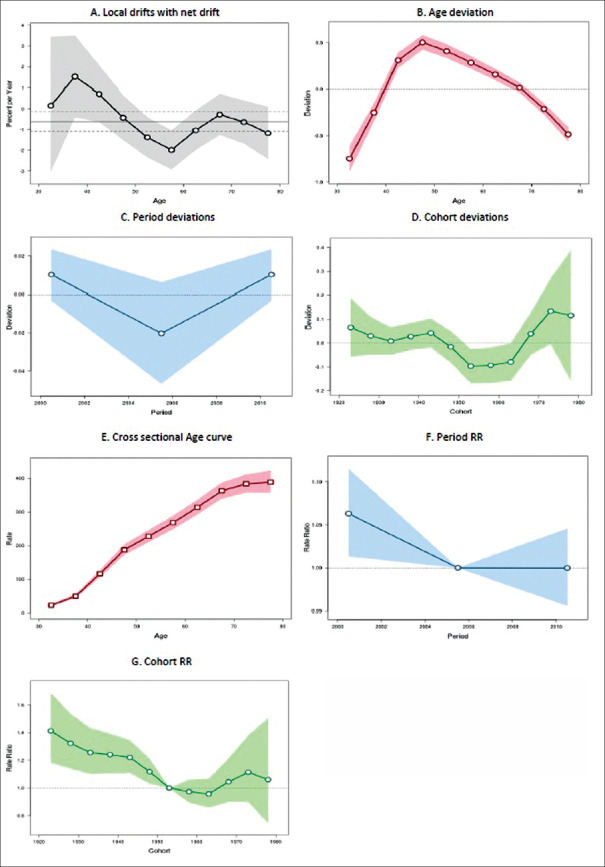
The incidence of breast cancer was significantly declining over time in America, with an annual decline rate of 0.61% (95% CI: −1.08 to − 0.14%). The annual age-specific incidence rate is shown in Figure 2a. An increasing trend was found in the earlier age groups from 30–34 to 40–44 years, after which there is a declining trend across all the other age groups, with a maximum decline in the 55–59 years of age group (P = 0.11).
Figure 2.
Trend of breast cancer incidence in America during the period 1998–2012: an age-period-cohort analysis. (a) Annual trend of age-specific breast cancer incidence rates (local drift). (b) Age deviations in breast cancer incidence. (c) Period deviations in breast cancer incidence. (d) Cohort deviations in breast cancer incidence. (e) Effect of age component of age-period-cohort model on breast cancer incidence. (f) Effect of period component of age-period-cohort model on breast cancer incidence. (g) Effect of cohort component of age-period-cohort model on breast cancer incidence
Figure 2b shows the significant age deviations (P < 0.001) in the incidence rate of breast cancer. Figure 2c shows that there were no significant deviations across the periods. Figure 2d shows an alternate declining and increasing trend across the cohorts (P = 0.11).
Figure 2e shows the cross-sectional age curve depicting an increase across all the age groups from 30–34 to 75–79 years. RR of the period effects showed significant consistent decline (P = 0.01) every 5-year period from 1998–2002 to 2008–2012 [Figure 2f]. RR of the cohort effects also showed significant consistent decline (P = 0.003) across the cohorts with late upward surge in the cohorts between 1968–1972 and 1978–1982 [Figure 2g].
Asia
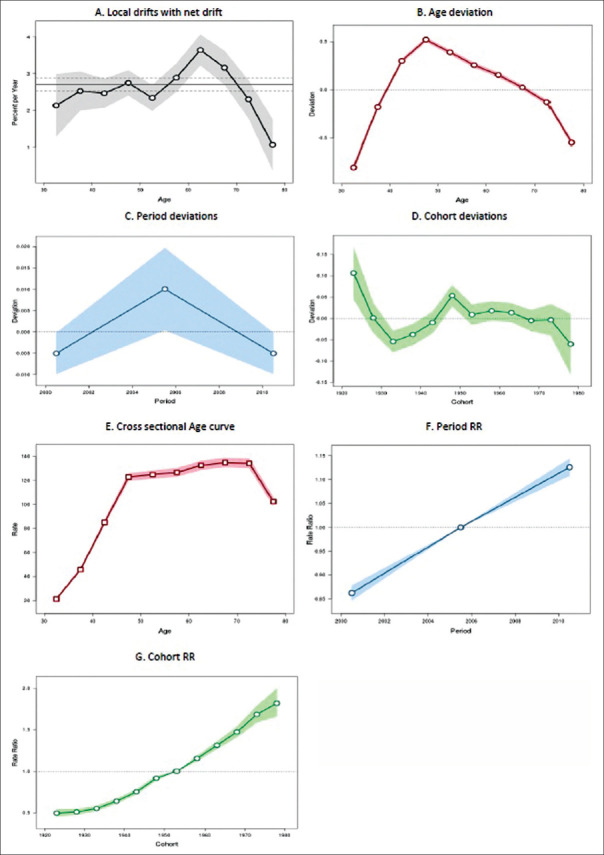
Asia showed a significant increasing trend in the breast cancer incidence over time at an annual rate of 2.70% (95% CI: 2.53%–2.88%). Figure 3a shows a significant increasing trend of age-specific incidence rates over time across all the age groups (P < 0.001).
Figure 3.
Trend of breast cancer incidence in Asia during the period 1998–2012: an age-period-cohort analysis. (a) Annual trend of age-specific breast cancer incidence rates (local drift). (b) Age deviations in breast cancer incidence. (c) Period deviations in breast cancer incidence. (d) Cohort deviations in breast cancer incidence. (e) Effect of age component of age-period-cohort model on breast cancer incidence. (f) Effect of period component of age-period-cohort model on breast cancer incidence. (g) Effect of cohort component of age-period-cohort model on breast cancer incidence
The incidence rate of breast cancer was significantly differing across the age groups (P < 0.001) as shown in Figure 3b. Figure 3c shows that there was a significant decline across three periods (P = 0.04). Analysis on cohort deviations [Figure 3d] showed an alternate increasing and decreasing trend across the cohorts (P < 0.001).
Cross-sectional age curve showed consistent increase across all the age groups from 30–34 to 75–79 years [Figure 3e]. RR of the period effects showed consistent increase with every 5-year period from 1998–2002 to 2008–2012 [Figure 3f]. RR of the cohort effects also showed consistent increase across all the cohorts [Figure 3g]. All these changes were statistically significant (P < 0.001)
Europe
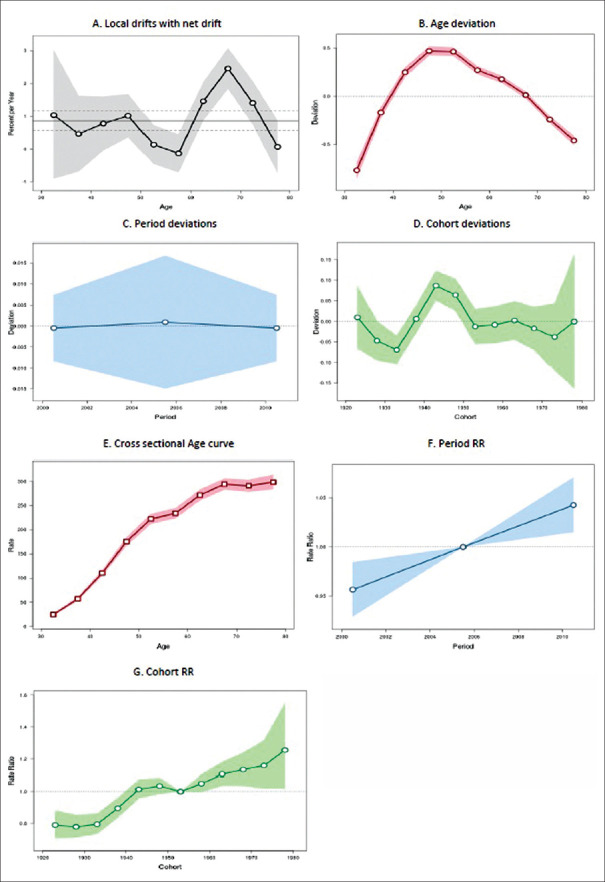
European region showed an increasing trend in the breast cancer incidence at a rate of 0.86% (95% CI: 0.57%–1.16%). Age-specific incidence rates also showed increasing trend over time across each of the age groups, with maximum increasing trend among the elderly age groups (P < 0.001) [Figure 4a]. The incidence rate of breast cancer was differing significantly across the age groups (P < 0.001) [Figure 4b]. Analysis on the period deviations [Figure 4c] showed that there was no change across all the three periods (P = 0.90). Figure 4d shows an alternate increasing and decreasing trend across all the cohorts (P < 0.001).
Figure 4.
Trend of breast cancer incidence in Europe during the period 1998–2012: an age-period-cohort analysis. (a) Annual trend of age-specific breast cancer incidence rates (local drift). (b) Age deviations in breast cancer incidence. (c) Period deviations in breast cancer incidence. (d) Cohort deviations in breast cancer incidence. (e) Effect of age component of age-period-cohort model on breast cancer incidence. (f) Effect of period component of age-period-cohort model on breast cancer incidence. (g) Effect of cohort component of age-period-cohort model on breast cancer incidence
Cross-sectional age curve showed consistent increase across all the age groups from 30–34 to 75–79 years [Figure 4e]. RR of the period effects showed consistent increase (P < 0.001) with every 5-year period from 1998–2002 to 2008–2012 [Figure 4f]. RR of the cohort effects also showed consistent increase (P < 0.001) with each of the cohorts [Figure 4g].
Oceania
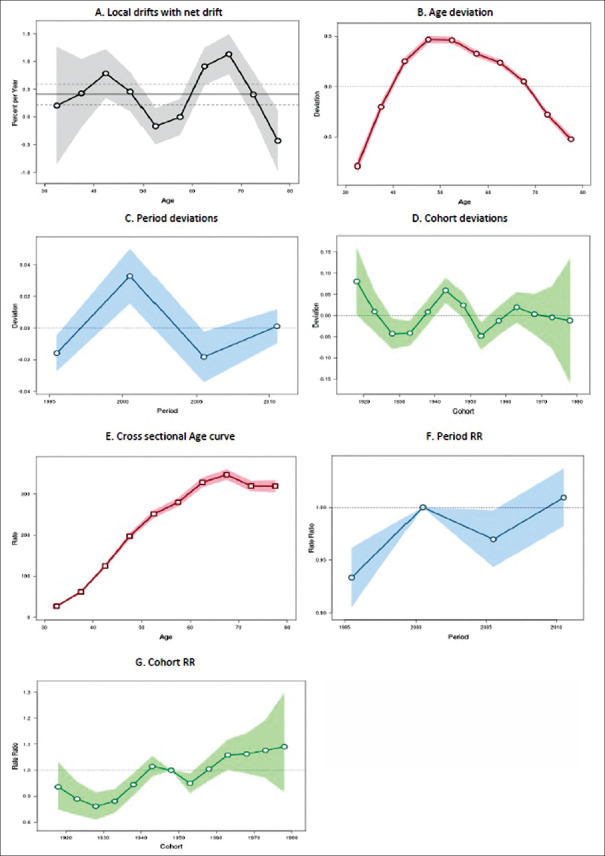
Oceania continent showed an annual increase rate of 0.41% (95% CI: 0.22%–0.59%; P < 0.001). Figure 5a shows that the age-specific incidence rates have increasing trend over time across almost all the age groups, except 50–54, 55–59, and 75–79 years (P < 0.001). Significant age deviation was found in the incidence of breast cancer (P < 0.001) as shown in Figure 5b. Figure 5c shows that there was an alternate increasing and declining across all the four periods (P < 0.001). Figure 5d shows that the incidence rates of breast cancer also show an alternate increasing and decreasing trend across the cohorts (P < 0.001).
Figure 5.
Trend of breast cancer incidence in Oceania during the period 1993–2012: an age-period-cohort analysis. (a) Annual trend of age-specific breast cancer incidence rates (local drift). (b) Age deviations in breast cancer incidence. (c) Period deviations in breast cancer incidence. (d) Cohort deviations in breast cancer incidence. (e) Effect of age component of age-period-cohort model on breast cancer incidence. (f) Effect of period component of age-period-cohort model on breast cancer incidence. (g) Effect of cohort component of age-period-cohort model on breast cancer incidence
Cross-sectional age curve showed consistent increase across all the age groups from 30–34 to 75–79 years [Figure 5e]. RR of the period effects showed alternate increasing and decreasing trend with every 5-year period from 1993–1997 to 2008–2012 [Figure 5f. RR of the cohort effects showed a consistent increasing trend (P < 0.001) across almost all of the cohorts [Figure 5g].
DISCUSSION
This study was conducted to demonstrate the global profile of breast cancer incidence between 1993 and 2012. Geographical variation was found in the incidence of breast cancer between the four continents using the joinpoint regression. High-income regions continue to have higher breast cancer incidence rate when compared to low-middle-income or low-income regions. Oceania had the highest age-adjusted incidence rate of breast cancer (197.50 per 100,000 populations in 2012) followed by America (180.64 per 100,000 populations in 2012).
Out of the four regions studied, only America showed a declining trend in the breast cancer incidence (AAPC = −0.7%). All other regions showed an increasing trend with maximum increase in Asia (AAPC = 2.6%) followed by Europe (AAPC = 0.7%). Declining trend in America may be due to early detection and improved management of the condition. It could also be due to the reach of plateaus in breast cancer screening coverage.[22] However, the rise in the incidence in other regions can be explained by the increased uptake of breast cancer screening program, such as clinical breast examination or mammography, especially by low-middle-income countries, and high coverage of breast cancer screening in high-income countries. Another reason could be the increase in risk factors related to breast cancer such as obesity, increased use of menopausal hormone therapy, alcohol consumption, physical activity, or irregular reproductive pattern.[23,24,25]
We further explored the cancer incidence trend by accessing the age-, cohort-, and period specific trends. It helped to gain additional knowledge on the overall trend. There was consistent rise in the breast cancer incidence across the age groups in all the four continents, with maximum burden in elderly age groups. The more worrying trend is that younger adults in age groups between 30 and 44 years have also reported increase in the breast cancer incidence rates over the past two decades. Higher risk of breast cancer among elderly age group can be explained possibly by the use of postmenopausal hormone replacement therapy or obesity (more risk of breast cancer among postmenopausal women when compared to premenopausal women).[26] However, the increasing trend in the younger age group might be due to rise in irregular reproductive pattern, such as long menstrual history, delay in first child birth, or lack of breastfeeding practices.[26]
Except in America, all the other regions showed consistent rise in incidence of breast cancer through the periods 1998–2002 to 2007–2012. Declining or stable trend in America can be partly attributed to the early adoption of national breast cancer screening program, which reached the coverage rate of >70% in the early 2000s and reached a plateau during the study period.[22,27] However, other regions in the world adopted the program during this period which might have influenced the consistent rise in the incidence of breast cancer.
There was also a consistent increase in the breast cancer incidence across the cohorts from 1923–1927 to 1978–1982 in continents such as Asia and Oceania, while alternate declining and increasing trend was found across the cohorts in Europe and declining trend in the American region. Changes in the pattern of risk factors manifest themselves as variations in risk ratio across the successive birth cohorts. Hence, this rise in the incidence with each birth cohort may be due to the drastic change into sedentary lifestyle among the later cohorts which is responsible for various behavioral risk factors, such as high-fat diet, physical inactivity, alcohol use, and obesity.[26]
Limitations of our study were the limited availability or unavailability of data for many countries, which hinders the understanding of true burden or generalizability of the current study findings. Further, this is a secondary data analysis and may not reflect all the cases in the community, because of misclassification and under-reporting bias. Africa cannot be included in the analysis as the data were available for only one register with many zero values, which are difficult to analyze.
Breast cancer incidence is expected to rise over the next few decades due to rise in lifestyle changes that accompany improved economic conditions such as sedentary work style, delayed child bearing, lack of breastfeeding practices, or low parity. Downstaging of breast cancer is one the most effective strategies to achieve this and needs heavy investment from the country to carry out the screening activities.[28] Apart from these, strong political will, high-quality data generation from cancer registries, raising awareness among healthcare professionals and community members, and public–private partnerships can help in making vital progress in reducing this unacceptable rise in the global burden of breast cancer. Further studies should be done to explore the specific epidemiological risk factors responsible and understand the complexity of global burden of breast cancer.
CONCLUSION
The incidence of breast cancer showed an increasing trend throughout the world, with maximum increase in Asia over the past two decades. The alarming finding was increasing trend among younger age groups between 30 and 44 years across all the continents. This makes a strong need for targeted screening program among these populations throughout the world to ensure early detection and adequate management of the condition.
Financial support and sponsorship
Nil.
Conflicts of interest
There are no conflicts of interest.
REFERENCES
- 1.Hortobagyi GN, de la Garza Salazar J, Pritchard K, Amadori D, Haidinger R, Hudis CA, et al. The global breast cancer burden: Variations in epidemiology and survival. Clin Breast Cancer. 2005;6:391–401. doi: 10.3816/cbc.2005.n.043. [DOI] [PubMed] [Google Scholar]
- 2.Azubuike SO, Muirhead C, Hayes L, McNally R. Rising global burden of breast cancer: The case of sub-Saharan Africa (with emphasis on Nigeria) and implications for regional development: A review. World J Surg Oncol. 2018;16:63. doi: 10.1186/s12957-018-1345-2. [DOI] [PMC free article] [PubMed] [Google Scholar]
- 3.Torre LA, Islami F, Siegel RL, Ward EM, Jemal A. Global cancer in women: Burden and trends. Cancer Epidemiol Biomarkers Prev. 2017;26:444–57. doi: 10.1158/1055-9965.EPI-16-0858. [DOI] [PubMed] [Google Scholar]
- 4.Ferlay J, Shin HR, Bray F, Forman D, Mathers C, Parkin DM. Estimates of worldwide burden of cancer in 2008: GLOBOCAN 2008. Int J Cancer. 2010;127:2893–917. doi: 10.1002/ijc.25516. [DOI] [PubMed] [Google Scholar]
- 5.Steponaviciene L, Briediene R, Vanseviciute R, Smailyte G. Trends in breast cancer incidence and stage distribution before and during the introduction of the mammography screening program in Lithuania. Cancer Control. 2019;26:1073274818821096. doi: 10.1177/1073274818821096. [DOI] [PMC free article] [PubMed] [Google Scholar]
- 6.Peto J. Breast cancer susceptibility-A new look at an old model. Cancer Cell. 2002;1:411–2. doi: 10.1016/s1535-6108(02)00079-x. [DOI] [PubMed] [Google Scholar]
- 7.Coleman MP, Quaresma M, Berrino F, Lutz JM, de Angelis R, Capocaccia R, et al. Cancer survival in five continents: A worldwide population-based study (CONCORD) Lancet Oncol. 2008;9:730–56. doi: 10.1016/S1470-2045(08)70179-7. [DOI] [PubMed] [Google Scholar]
- 8.Global Burden of Cancer in Women. American Cancer Society. [[Last accessed on 2019 Jul 29]]. Available from: https://wwwcancerorg/content/dam/cancer-org/research/cancer-facts-and-statistics/breast-cancer-facts-and-figures/breast-cancer-facts-and-figures-2017-2018pdf .
- 9.Breast Cancer facts and Figures 2017-2018. American Cancer Society. [[Last accessed on 2019 Jul 29]]. Available from: https://wwwcancerorg/content/dam/cancer-org/research/cancer-facts-and-statistics/global-cancer-facts-and-figures/global-burden-of-cancer-in-womenpdf .
- 10.Lacey JV, Jr, Kreimer AR, Buys SS, Marcus PM, Chang SC, Leitzmann MF, et al. Breast cancer epidemiology according to recognized breast cancer risk factors in the Prostate, Lung, Colorectal and Ovarian (PLCO) Cancer Screening Trial Cohort. BMC Cancer. 2009;9:84. doi: 10.1186/1471-2407-9-84. [DOI] [PMC free article] [PubMed] [Google Scholar]
- 11.Ferlay J, Colombet M, Bray F. Cancer Incidence in Five Continents, CI5plus: IARC CancerBase No. Lyon, France: International Agency for Research on Cancer; 2018. [[Last accessed on 2019 Jul 29]]. Available from: http://ci5iarcfr . [Google Scholar]
- 12.Segi M. Cancer mortality for Selected Sites in 24 Countries (1950–57) Sendai, Japan: Department of Public Health, Tohoku University School of Medicine; 1960. [Google Scholar]
- 13.Doll R, Payne P, Waterhouse J. Berlin: Springer-Verlag (for UICC); 1966. Cancer Incidence in Five Continents: A Technical Report. [Google Scholar]
- 14.Moradzadeh R, Anoushirvani AA. Trend of Gastric Cancer Incidence in an Area Located in the Center of Iran: 2009-2014. J Gastrointest Cancer. 2020;51:159–64. doi: 10.1007/s12029-019-00227-8. [DOI] [PubMed] [Google Scholar]
- 15.Politis M, Higuera G, Chang LR, Gomez B, Bares J, Motta J. Trend analysis of cancer mortality and incidence in Panama, using joinpoint regression analysis. Medicine (Baltimore) 2015;94:e970. doi: 10.1097/MD.0000000000000970. [DOI] [PMC free article] [PubMed] [Google Scholar]
- 16.Moradzadeh R, Golmohammadi P, Ghaitasi B, Nadrian H, Najafi A. Incidence of esophageal cancer in Iran, a population-based study: 2001-2015. J Gastrointest Cancer. 2019;50:507–12. doi: 10.1007/s12029-018-0114-3. [DOI] [PubMed] [Google Scholar]
- 17.Clegg LX, Hankey BF, Tiwari R, Feuer EJ, Edwards BK. Estimating average annual per cent change in trend analysis. Stat Med. 2009;28:3670–82. doi: 10.1002/sim.3733. [DOI] [PMC free article] [PubMed] [Google Scholar]
- 18.Lerman PM. Fitting segmented regression models by grid search. Appl Stat. 1980;29:77–84. [Google Scholar]
- 19.Kim HJ, Fay MP, Feuer EJ, Midthune DN. Permutation tests for joinpoint regression with applications to cancer rates. Stat Med. 2000;19:335–51. doi: 10.1002/(sici)1097-0258(20000215)19:3<335::aid-sim336>3.0.co;2-z. [DOI] [PubMed] [Google Scholar]
- 20.Rosenberg PS, Check DP, Anderson WF. A web tool for age-period-cohort analysis of cancer incidence and mortality rates. Cancer Epidemiol Biomarkers Prev. 2014;23:2296–302. doi: 10.1158/1055-9965.EPI-14-0300. [DOI] [PMC free article] [PubMed] [Google Scholar]
- 21.McNally RJ, Alexander FE, Staines A, Cartwright RA. A comparison of three methods of analysis for age-period-cohort models with application to incidence data on non-Hodgkin's lymphoma. Int J Epidemiol. 1997;26:32–46. doi: 10.1093/ije/26.1.32. [DOI] [PubMed] [Google Scholar]
- 22.Ryerson AB, Benard VB, Major A. National Breast and Cervical Cancer Early Detection Program: 1991–2002 National Report. 2004 [Google Scholar]
- 23.Ginsburg OM. Breast and cervical cancer control in low and middle-income countries: Human rights meet sound health policy. J Cancer Policy. 2013;1:e35–41. [Google Scholar]
- 24.Chlebowski RT, Manson JE, Anderson GL, Cauley JA, Aragaki AK, Stefanick ML, et al. Estrogen plus progestin and breast cancer incidence and mortality in the Women's Health Initiative Observational Study. J Natl Cancer Inst. 2013;105:526–35. doi: 10.1093/jnci/djt043. [DOI] [PMC free article] [PubMed] [Google Scholar]
- 25.Colditz GA, Baer HJ, Tamimi RM. Breast cancer. In: Schottenfeld D, Fraumeni JF Jr, editors. Cancer Epidemiology and Prevention. 3rd ed. New York: Oxford University Press; 2006. pp. 995–1012. [Google Scholar]
- 26.Althuis MD, Dozier JM, Anderson WF, Devesa SS, Brinton LA. Global trends in breast cancer incidence and mortality 1973-1997. Int J Epidemiol. 2005;34:405–12. doi: 10.1093/ije/dyh414. [DOI] [PubMed] [Google Scholar]
- 27.Smigal C, Jemal A, Ward E, Cokkinides V, Smith R, Howe HL, et al. Trends in breast cancer by race and ethnicity: Update 2006. CA Cancer J Clin. 2006;56:168–83. doi: 10.3322/canjclin.56.3.168. [DOI] [PubMed] [Google Scholar]
- 28.WHO. Breast Cancer: Prevention and Control. [[Last accessed on 2019 Jul 29]]. Available from: http://wwwwhoint/cancer/detection/breastcancer/en/


