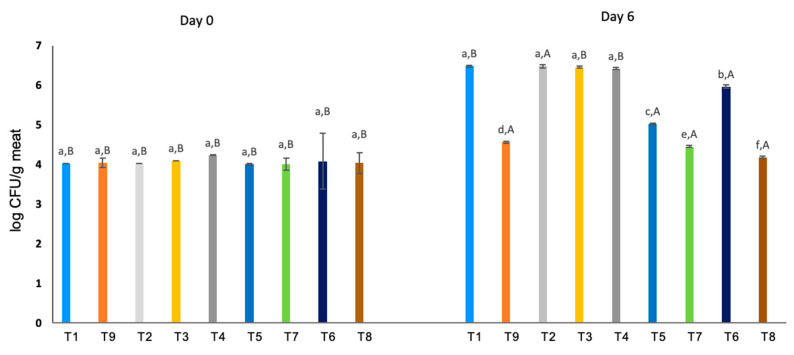
Figure 1.
Microbiological analysis at days 0 and 6 in beef patties in refrigerated storage at 4 °C. Results are given with standard error. Different small letters, a–f, across the same day indicate significant differences between samples and different capital letters, A,B, in the same sample indicate significant differences between days. T1: CM (control), T2: 2% PSW, T3: 4% PSW, T4: 0.35% CA, T5: 2% RS, T6: 2% PSW + 0.35% CA, T7: 2% PSW + 0.35% CA + 2% RS, T8: 4% PSW + 0.35% CA + 2% RS and T9: 0.7% CAMPA N.3 (A).

