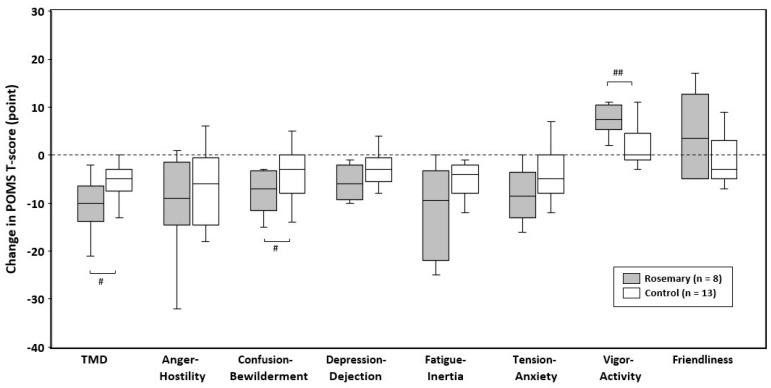
Figure 2.
Changes in POMS T-scores during the intervention. Box-and-whisker plot representing the median (line within the box), IQR (length of the box), and the maximum and minimum values (whiskers above and below the box). Significant differences between groups were based on Quade test with each baseline value as covariate: # p < 0.05, ## p < 0.01. TMD: total mood disturbance.

