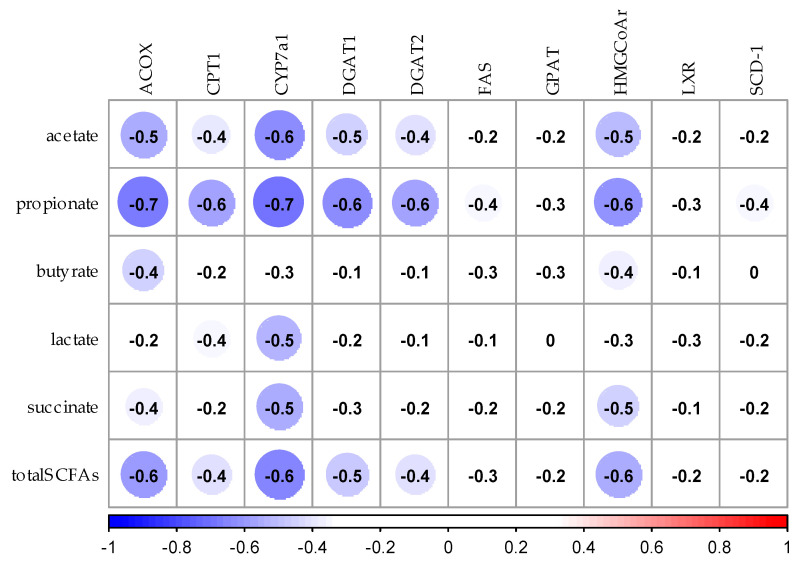
Figure 7.
Spearman’s rank correlation analysis between SCFAs and expression of mRNA related to lipid metabolism in the liver. The values in the figure shows the correlation coeffcient. Blue circles show negative correlation and red circles show positive correlation. ACOX, Acyl-CoA oxidase; CPT1, Carnitine palmitoyl Table 1. CYP7a1, Cholesterol 7alpha-hydroxylase 1; DGAT1, Diacylglycerol acyltransferase-1; DGAT2, Diacylglycerol acyltransferase-2; FAS, Fatty acid synthase; GPAT, glycerol-3-phosphate acyltransferase; HMGCoAr, Hydroxymethylglutaryl-CoA reductase, reductase; LXR, Liver X receptor; SCD-1, Stearoyl-CoA desaturase 1; total SCFAs, total short-chain fatty acids.

