

SUMMARY
Polycomb repressive complex 2 (PRC2) maintains gene silencing by catalyzing methylation of histone H3 at lysine 27 (H3K27me2/3) within chromatin. By designing a system whereby PRC2-mediated repressive domains were collapsed and then reconstructed in an inducible fashion in vivo, a two-step mechanism of H3K27me2/3 domain formation became evident. First, PRC2 is stably recruited by the actions of JARID2 and MTF2 to a limited number of spatially interacting “nucleation sites,” creating H3K27me3-forming Polycomb foci within the nucleus. Second, PRC2 is allosterically activated via its binding to H3K27me3 and rapidly spreads H3K27me2/3 both in cis and in far-cis via long-range contacts. As PRC2 proceeds further from the nucleation sites, its stability on chromatin decreases such that domains of H3K27me3 remain proximal, and those of H3K27me2 distal, to the nucleation sites. This study demonstrates the principles of de novo establishment of PRC2-mediated repressive domains across the genome.
In Brief
Oksuz et al. define nucleation and spreading regions for Polycomb repressive complex 2 (PRC2), demonstrating the principle of PRC2 domain formation in mammals. They elucidate the role of genome architecture in formation of these domains and identify JARID2 and MTF2 as being crucial for full recruitment of PRC2 to chromatin.
Graphical Abstract
INTRODUCTION
Cellular diversity during development arises from the formation of stable and heritable repertoires of gene expression profiles, unique to individual lineages. Genetic and biochemical studies have demonstrated that some histone post-translational modifications are critical determinants to establishing and maintaining cellular identity (Bonasio et al., 2010; Margueron and Reinberg, 2010). Among them, di- and tri-methylation of histone H3 at lysine 27 (H3K27me2/3)–modifications catalyzed by Polycomb repressive complex 2 (PRC2)–are associated with a repressive chromatin state (Pengelly et al., 2013; Simon and Kingston, 2013; Lee et al., 2015; Ferrari et al., 2014; Margueron and Reinberg, 2011). PRC2 can bind to the products of its own catalysis, H3K27me2/3, through an aromatic cage present in its EED subunit (Margueron et al., 2009). In particular, binding to H3K27me3 leads to an allosteric activation of its methyltransferase activity. We proposed a model whereby the initial catalysis of H3K27me3 at specific sequences could serve to stimulate further H3K27me3 catalysis via a “read-write” mechanism to form large repressive domains as found, for example, across the Hox clusters (Boyer et al., 2006).
While there is a large body of data focusing on Polycomb genomic localization in mammals, the mechanism(s) by which PRC2 is initially recruited to specific genomic loci and how PRC2 sets up repressive domains comprising H3K27me2 or H3K27me3 remain unclear. We and others discovered that the genomic targeting of PRC2 is facilitated at developmental genes by its interacting partner JARID2 (Li et al., 2010; Landeira et al., 2010; Peng et al., 2009; Pasini et al., 2010; Shen et al., 2009), a protein that can bind directly to nucleosomes (Son et al., 2013) and exhibits a low affinity for GC-rich sequences in vitro (Li et al., 2010). In addition, a recent study demonstrated that MTF2, a member of the Polycomb-like (PCL) proteins that forms a PRC2 sub-complex excluding JARID2 (Grijzenhout et al., 2016), is required for efficient recruitment of PRC2 to CpG islands in mouse embryonic stem cells (mESCs) (Li et al., 2017). Both of these studies, as well as others (Holoch and Margueron, 2017), were performed in mESCs under steady-state conditions, not conducive to tracking the de novo establishment of PRC2-mediated repressive domains, including the dynamics of and determinants to initial PRC2 recruitment and PRC2 behavior as it progressively builds up H3K27me2/3 domains.
Thus, we devised a genetic system in mESCs by which we could inducibly reconstruct these domains from scratch. Employing this system, we defined the exact genomic coordinates of PRC2 nucleation and spreading and identified the key factors for its initial recruitment and stability on chromatin.
RESULTS
Disruption of EED-H3K27me3 Interaction Reduced H3K27me3 Levels in mESCs
The crystal structure of EED shows that H3K27me3 is located within an aromatic cage formed by the WD40 repeats of EED and that three amino acids, Phe97, Tyr148, and Tyr365, directly contact the tri-methylated lysine residue (Margueron et al., 2009). To test whether this interaction was necessary for the maintenance of repressive chromatin domains in vivo, we generated EED cage mutants having Phe97 or Tyr365 substituted with alanine (F97A or Y365A) in mESCs using the CRISPR/Cas9 system. As a control, we mutated Tyr358 (Y358A), which does not contact the tri-methylated lysine. A western blot (WB) of whole-cell extract preparations from these cage-mutant lines showed a significant reduction in H3K27me3 levels (Figure 1A), while those of the control Y358A mutant were unaffected. The global levels of another repressive mark, H3K9me3, remained unperturbed, suggesting that the effect was specific to H3K27me3 (Figure 1A). Quantitative mass spectrometry of acid-extracted histones demonstrated a precipitous drop in the percentage of the H3K27me3 modification, from 20% in wild-type (WT) ESCs to approximately 1% in each of the cage-mutant backgrounds, compared to 0% in the EED knockout (KO) control (Figure 1B).
Figure 1. Disruption of the EED-H3K27me3 Interaction Leads to Reduced H3K27me3 Levels in mESCs.

(A) WB using the indicated antibodies on whole-cell extracts from E14-TG2a mESCs with the following EED genotypes: WT, wild-type; F97A, Y365A, cage mutants; Y358A, control mutant. The same tubulin blot is also used in Figure S1B.
(B) Global percentage of H3K27 methylation levels in mESCs with the indicated EED genotypes, as identified by quantitative histone mass spectrometry.
(C and D) Heatmaps of SUZ12 (C) and H3K27me3
(D) ChIP-seq read density from the indicated EED genotypes within a 20-kb window centered on the maximum value of the peak signal in WT mESCs. H3K27me3 peaks (total = 27,281 peaks) were sorted by decreasing signal intensity in Y365A mESCs (scales for SUZ12 and H3K27me3: 0–1).
(E)H3K27me3 density profiles of the top 200 peaks (top plot) and remaining bottom peaks (bottom plot) from the indicated EED genotypes. Of note, EED KO cells have a homozygous frameshift mutation in exon 10, which leads to a premature stop codon and destabilization of the protein.
(F and G) Representative H3K27me3 ChIP-seq tracks at the HoxC (F) and HoxD (G) clusters.
EED cage-mutant cells also showed a substantial decrease in H3K27me2 levels (Figures 1A and 1B) and a reciprocal increase in the levels of H3K36me2, a modification associated with active transcription (Figure S1A), and mutually exclusive with H3K27me3 (Yuan et al., 2011; Schmitges et al., 2011; Zheng et al., 2012). No other quantifiable histone modifications were significantly altered (Table S1). Importantly, the cage mutation did not disrupt the integrity of the PRC2 complex, in contrast to the EED KO (Figures S1B and S1C). Furthermore, similar to Polycomb mutants (Margueron and Reinberg, 2011), cage-mutant mESCs exhibited WT morphology and gene expression profiles (Figures S1D and S1E) but failed to differentiate (Figures S1F–S1H). These results suggest that the EED-H3K27me3 interaction is dispensable for maintaining the self-renewal of mESCs but required for de novo H3K27me3 repressive chromatin domains during differentiation.
Though significantly diminished, H3K27me3 was still detectable in cage-mutant mESCs. To identify the genomic coordinates of the residual ~1% of H3K27me3 and genomic occupancy of SUZ12/PRC2, we performed quantitative chromatin immunoprecipitation sequencing (ChIP-seq) (Orlando et al., 2014; Bonhoure et al., 2014; Egan et al., 2016) in WT and cage-mutant cells (Figures 1C and 1D). As expected from our global analysis, the cage mutants showed a significant reduction in H3K27me3 levels across all PRC2 target genes (Figures 1D and S2A–S2D, left plots). For example, H3K27me3 was undetectable across the entire HoxC cluster, mimicking the EED KO setting (Figure 1F). Nonetheless, approximate WT levels of H3K27me3 were maintained in cage-mutant mESCs at a limited number of discrete regions within larger Polycomb domains in contrast to other regions in the genome, with a progressive decrease distal to these sites (Figures 1E, cf. top and bottom plots, and S2A–S2D, cf. left and right plots). Of ~200 such sites, 73% localized to within ±5 kb of the transcriptional start sites (TSSs) of genes. For example, Y365A mESCs displayed WT levels of H3K27me3 at the Evx2 promoter, yet these levels progressively diminished across the neighboring HoxD cluster as a function of the genomic distance from the Evx2 TSSs (Figure 1G). These ChIP-seq results were validated by ChIP-qPCR at a number of target loci (Figures S2E–S2H). Of note, PRC2 was strictly localized to sites retaining H3K27me3 in the EED cage-mutant mESCs as evidenced by ChIP-seq for SUZ12 (Figure 1C). Furthermore, these sites had high levels of H3K27me3 and PRC2 in the EED WT cells as evidenced by the heatmaps (Figures 1C and 1D) and log ratio mean average (MA) plots (Figures S2A–S2D). However, the reduction in H3K27me3 levels in the cage mutants did not occur uniformly over the genome. Thus, PRC2 is actively recruited to a discrete number of sites on the genome, and its EED-H3K27me3 interaction is required for spreading H3K27me3 in cis along the chromosome.
Initial Deposition and Spreading Mechanism of H3K27me2/3 Domains
To test whether regions of active PRC2 recruitment identified above might serve as nucleation sites for the initial establishment of Polycomb chromatin domains, we devised a Cre-lox-based system in which new domains could be established “de novo” in an inducible fashion in vivo, and their formation was tracked over time. To this end, we deleted the endogenous copy of EED in mESCs possessing a CreERT2 transgene (Figure 2A; see STAR Methods for details). The cells were propagated until H3K27me2/3 was completely depleted (Figures S3A, see 0 hr, and S3E). We then expressed FLAG-HA-tagged versions of WT or cage-mutant EED (Y365A) from its endogenous locus in response to 4-Hydroxytamoxifen (4-OHT) to follow de novo H3K27me2/3 deposition (Figures 2A, bottom, and S3A). These inducible WT or cage-mutant rescue cells were termed “i-WT-r” or “i-MT-r,” respectively. ChIP-seq in i-WT-r cells after 12-hr induction of EED expression led to H3K27me3 deposition as well as the presence of EED and SUZ12 at precisely those sites that retained H3K27me3 and PRC2 in the steady-state cage-mutant setting (Figures 2B, cf. i-WT-r 12 hr with steady-state cage-MT (mutant), and 2C, cf. lanes 1 and 8; Figure S3, cf. Figures S3F versus S3G and S3I versus S3J; Figure S3B). We termed these “nucleation sites,” as they were the first regions where PRC2 was recruited and H3K27me3 deposited. Nucleation sites were grouped as either strong or weak with respect to the levels of PRC2 and H3K27me2/3 deposition at 12 hr of EED expression (left graphs in Figures 2D–2F). Of note, these sites were specifically enriched for dense CpG islands (CGIs) (Figure 2C, lane 12). By 36 hr of EED induction in i-WT-r cells, H3K27me3 appeared at genomic regions distal from the initial nucleation sites, both at neighboring regions in cis and at distant intra-chromosomal regions, such that the steady-state WT distribution of H3K27me3 was approximated (Figures 2B, cf. i-WT-r 36 hr with steady-state WT, and 2C, cf. lane 3 with lane 10). These temporally established downstream sites of H3K27me3 deposition that emanated from an initiation site were termed “spreading sites.” Spreading sites were grouped as either proximal (±10 kb) to at least one nucleation site (strong or weak) or distal and lacking a nucleation site in close proximity (Figure 2C, lane 1). In both cases, PRC2 levels were low as evidenced by the SUZ12 binding profile (Figure 2F).
Figure 2. PRC2 Activity Propagates from Initial Regions of High CGI Density Enriched with Specific Motifs.

(A) Targeting scheme to conditionally rescue EED KO mESCs (C57BL/6) with EED, either WT or Y365A (see STAR Methods for details). Briefly, the endogenous copy of EED was deleted in mESCs possessing a CreERT2 transgene. Next, a Cre-lox-based inducible system was devised to induce expression of WT or MT EED in response to 4-OHT from the endogenous EED locus.
(B) ChIP-seq tracks for H3K27me3 (me3) and H3K27me2 (me2) near the Emx1 gene in the EED KO, or in i-WT-r or i-MT-r cells after EED expression for the indicated times, or in steady-state cells expressing Y365A or WT EED.
(C) Heatmaps of H3K27me3 and H3K27me2 for the rescue experiments performed as in (B), and CGI density within a 20-kb window centered on the maximum value of peak signal in WT mESCs. H3K27me3 peaks were sorted in descending order by signal intensity at the 12-hr time point. Strong nucleation sites are marked in red (total = 237), weak nucleation sites in blue (total = 1,389), proximal spreading sites in cyan, and distal spreading sites in green (total = 36,618, representative of randomly selected 2,500 peaks are used for the heatmaps) (scales: 0–2 for H3K27me3 and H3K27me2 0–50 for CGIs).
(D–F) Average density profiles of H3K27me3 (D) H3K27me2 (E) and SUZ12 (F) on nucleation sites (strong and weak) and spreading sites (D = distal, p = proximal) derived from the genotypes indicated within a 20-kb window centered on the maximum value of peak signal in WT mESCs. i-WT-r and i-MT-r cells after EED expression for 12 (left) or 36 (right) hr.
(G) Motif analysis of strong nucleation site CGIs (~200 sites) using Multiple EM for Motif Elicitation (MEME).
WT EED rescue as a function of time revealed the dynamic buildup of H3K27me2 and -me3 domains. At 12 hr, H3K27me3 was deposited at the nucleation sites and mostly absent from the spreading sites (Figures 2B, i-WT-r 12 hr, 2C, lane 1, and 2D, left graph). H3K27me2 was also predominantly deposited at the nucleation sites; however, its presence was detected at spreading sites (Figures 2B, i-WT-r 12 hr, 2C, lane 2, and 2E, left graph). At 36 hr, H3K27me3 was detected at both nucleation and spreading sites, although the former were more enriched for this modification (Figures 2B, i-WT-r 36 hr, 2C, lane 3, and 2D, right graph). In contrast, H3K27me2 was depleted at the nucleation sites and enriched at the spreading sites (Figures 2B, i-WT-r 36 hr, 2C, lane 4, and 2E, right graph). As H3K27me3 levels accumulated over time in the i-WT-r, the H3K27me2 levels decreased at these same loci, displaying an anti-correlation between the two marks. This phenotype was similar to the steady-state WT scenario (Figures 2B, cf. i-WT-r 36 hr with steady-state WT, and 2C, cf. lanes 3 and 4 with lanes 10 and 11, respectively). Thus, deposition of H3K27me2 preceded that of H3K27me3 at the nucleation sites such that H3K27me2 was converted to H3K27me3 at 36 hr. Importantly and consistent with previous studies, H3K27me2 appropriately decorated intergenic regions and gene bodies (Ferrari et al., 2014; Lee et al., 2015), and not CGIs (Figure 2C, cf. lanes 4 and 12; Figure S4A), while 71% of H3K27me3 spread ±5 kb outside of the TSSs.
The cage-mutant EED displayed very different dynamics in the rescue experiment. H3K27me3 deposition was severely compromised in the i-MT-r cells (Figure 2C, lane 6), and instead H3K27me2 dynamics mirrored those of H3K27me3 in the WT rescue. At 12 hr, H3K27me2 was found at nucleation sites and was absent from spreading sites (Figure 2C, lane 5), and, by 36 hr, H3K27me2 deposition intensified at nucleation sites and inefficiently deposited at spreading sites as compared to the WT EED rescue (Figure 2C, cf. lane 4 with lane 7). Relative to the WT rescue, EED and SUZ12 were recruited at similar levels to nucleation sites in the cage-mutant rescue at 12 hr, but at reduced levels at 36 hr (Figures 2F for SUZ12 and S3C and S3D for tracks; Figures S3G, S3H, S3J, and S3K for heatmaps). At both time points, EED/SUZ12 occupancy at spreading sites in i-MT-r cells was minimal.
Taken together, our data suggest that the EED aromatic cage is not required for initial PRC2 recruitment and di-methylation but is required for the efficient catalysis of the di-to tri-methyl reaction at nucleation sites. This outcome likely reflects both the increased stability of WT EED on chromatin, imparted via the binding affinity of the aromatic cage for both di- and tri-methylated nucleosomes, and the allosteric activation of PRC2 via its binding to the tri-methylated version (Margueron et al., 2009). Defects in such binding affinity and in allosteric activation as in the i-MT-r case result in H3K27me2 deposition at nucleation sites with subsequent, suboptimal H3K27me2 spreading, and the absence of a tri-methylated domain (Figures 2D and 2E). Notably, this profile contrasts in part with the steady-state case in which significant H3K27me3 deposition persisted at nucleation sites even without an intact aromatic cage (Figure 2C, cf. lane 6 with lane 8). This discrepancy is not surprising as, in contrast to the i-MT-r case that was devoid of pre-existing H3K27me3, H3K27me3 nucleosomes were pre-existing at nucleation sites prior to introducing the cage mutation in the steady-state case. Therefore, PRC2 is more challenged in attaining appropriate de novo levels of H3K27me3 than in preserving those already established in the EED cage-mutant cells. Hence, at sites of active PRC2 recruitment (nucleation sites), the aromatic cage is required for de novo H3K27me3 domain formation, rather than its maintenance.
The average CpG counts at CGIs comprising strong and weak nucleation sites were significantly higher than at CGIs comprising spreading sites and all CGIs (Figure S4B). A motif analysis at strong nucleation sites revealed an overrepresentation of “GA”-rich and “GCN” tandem repeat motifs (Figure 2G), relative to all CGIs in the genome. In total, 78% of strong nucleation sites had at least one of these motifs (Figure S4C). Furthermore, these motifs were unique relative to CGIs near the TSSs of genes subject to spreading (Figure S4D). Although less significantly enriched, we did observe that similar GA-rich and GCN tandem repeat motifs were overrepresented at the weak nucleation sites. However, the distribution of GA content was slightly different and the GCN tandem repeats were shorter (Figure S4E).
To substantiate that PRC2 can indeed traverse the distance between nucleosomes to propagate its activity in cis, we reconstituted the spread of H3K27me3 from a neighboring pre-modified nucleosome in vitro. Oligonucleosome arrays were designed to contain a 2:6 ratio of effector:substrate histone octamer such that effector octamers contained either unmodified (-me0), pre-modified H3K27me3, or control K27A histones (Figure 3A). Substrate octamers were assembled using FLAG-H3 such that PRC2 histone methyltransferase activity on effector versus substrate nucleosomes could be distinguished. Increasing levels of PRC2 resulted in a stimulation of activity toward the substrate with pre-modified H3K27me3 (Figures 3B and 3C). Importantly, this stimulation was dependent on the aromatic cage of EED, as recombinant PRC2 harboring the EED Y365A mutation was ineffectual in this regard. Thus, the EED-H3K27me3 binding module underlies the spread of PRC2 activity in cis from an initial nucleation site.
Figure 3. EED-H3K27me3 Interaction Stimulates PRC2 Activity in cis.

(A) Design of the in vitro histone methyltransferase assay (HMT). The oligonucleosome arrays comprised K27me0 (WT), K27A, or K27me3 modifications on both histone H3 within the effector nucleosome (green) and FLAG-tagged unmodified histone H3 within the substrate nucleosome (gray), at a ratio of 2 effector:6 substrate nucleosomes. Recombinant PRC2 reconstituted with either WT or Y365A was gauged for activity toward substrate nucleosomes.
(B) Quantification of the methylation levels scored by autoradiography (below) on the unmodified FLAG-tagged H3 with indicated concentrations of PRC2 (n = 3, one-sided paired test: ***p value <0.005). Error bars represent the SD of the mean.
(C) Extent of methylation obtained the in vitro HMT assay, as scored by autoradiography. Total levels of histones and PRC2 components are shown by Coomassie blue staining.
MTF2, along with JARID2, Is Necessary for De Novo PRC2 Targeting to Chromatin
To identify the factor(s) involved in the recruitment and stabilization of PRC2 on chromatin, we analyzed proteins enriched at the nucleation sites using an unbiased approach. We took advantage of the steady-state EED cage mutant that failed to efficiently spread H3K27me2/3 and was stuck at the nucleation sites (Figure 2). Native ChIP-mass spectrometry (ChIP-MS) identified proteins associated with WT EED chromatin versus EED cage-mutant chromatin (Figure 4A). In addition to the expected, core PRC2 subunits, proteins previously identified as PRC2 partners, were enriched at the EED cage-mutant-containing nucleation sites (Figure 4B; Table S2). Among the top candidates, we identified JARID2, AEBP2, and MTF2, which were reported to have functional DNA binding activity, as well as roles in PRC2 recruitment and/or activity (Li et al., 2010, 2017; Peng et al., 2009; Pasini et al., 2010; Landeira et al., 2010; Shen et al., 2009; Kim et al., 2009). Of note, elimination of these factors individually in steady-state mESCs did not completely disrupt PRC2 recruitment and had minimal effect on H3K27me3 levels. Importantly, MTF2 and JARID2 were shown to localize to GC-rich motifs (Li et al., 2017; Peng et al., 2009), which are similar to the GCN tandem repeat motif identified here as being enriched at the nucleation sites. We next gauged PRC2 recruitment to and stability on chromatin in i-WT-r cells as a function of time of WT EED expression and the presence of JARID2/AEBP2/MTF2.
Figure 4. Deletion of MTF2 along with JARID2 Abolishes De Novo PRC2 Targeting to Chromatin.

(A) Scheme for native ChIP-MS approach to identify proteins enriched at chromatin comprising FLAG-HA-tagged EED (FH-EED), either Y365A or WT.
(B) List of proteins enriched at the chromatin of EED cage mutant versus WT EED. Proteins highlighted in gray are core PRC2 components and previously reported PRC2 interactors.
(C and D) Heatmaps of SUZ12, 24 hr (C) and 8 days (D) after 4-OHT treatment to express WT EED, within a 20-kb window centered on the maximum value of peak signal in WT mESCs, comparing the genotypes indicated (scale: 0–5 for SUZ12).
When both JARID2 and MTF2 were eliminated in the i-WT-r cells, we observed a complete loss in the initial recruitment of PRC2 to chromatin (Figures 4C and 4D; Figures S4F and S4G). Consistent with our ChIP-MS data, ChIP-seq revealed that JARID2 and MTF2 were enriched at nucleation rather than spreading sites (Figures S4H and S4I). Elimination of JARID2 alone showed a mild effect on PRC2 recruitment, while elimination of MTF2 alone resulted in a loss of PRC2 recruitment to chromatin at 12 and 24 hr after EED expression (Figures S4G and 4C). However, when the cells were cultured for longer periods and reached steady-state levels (8 days), we observed some recruitment of PRC2 in MTF2 KO cells, yet PRC2 recruitment was still undetectable in JARID2/MTF2 double knockout (dKO) cells (Figure 4D). Depletion of AEBP2 did not alter the de novo deposition of PRC2 activity in i-WT-r cells (data not shown). We tested KDM2B, which interacts with unmethylated CGIs and has been suggested to recruit PRC2 to chromatin (Blackledge et al., 2014; He et al., 2013). Although the deposition of KDM2B exhibited significant differences at nucleation versus spreading sites (Figure S4J), it was also associated with some of the spreading sites, such as the HoxC cluster (Figure S4K), and regions independent of the presence of PRC2 (Figure S4L). These findings are consistent with a previous report (He et al., 2013), arguing against KDM2B being relevant in the initial recruitment of PRC2. Furthermore, deposition of KDM2B slightly increased during the WT EED rescue at 12 and 36 hr as compared to 0 hr (Figures S4J and S4K), indicating that PRC2 might stabilize KDM2B on chromatin.
These results indicate that both JARID2 and MTF2 are necessary for the initial recruitment and stable binding of PRC2 to nucleation sites (see below). Of note, previous reports identified two major classes of PRC2 complexes (Grijzenhout et al., 2016), one comprising Jarid2/AEBP2 and the other comprising MTF2. Our results indicate that PRC2 candidates from either class can be recruited to nucleation sites through their JARID2 or MTF2 constituents.
Deletion of a Nucleation Site Delays H3K27me3 Spreading
We postulated that nucleation sites might function to initiate the spread of PRC2 activity both locally and to regions that are genomically distant, but in close proximity as a result of 3D contacts. A purely cis-based propagation model would predict that cells lacking an intact nucleation site would no longer exhibit efficient deposition and spreading of H3K27me3 to neighboring regions. Thus, we generated an 8-kb genetic deletion in WT mESCs of a nucleation site identified on the Evx2 promoter from which PRC2 activity spreads in cis across the HoxD cluster. The levels of H3K27me3 across the cluster remained unaffected by loss of the nucleation site (Figure S5A). However, pre-existing H3K27me3 adjacent to the deletion site might have been sufficient to recruit and stabilize PRC2 activity across the HoxD cluster. To control for this possibility, we generated the equivalent deletion of the Evx2 nucleation site in uninduced i-WT-r cells, devoid of any adjacent H3K27me3 (Figure 5A). As expected, induced EED expression led to H3K27me3 deposition across the HoxD cluster, but, importantly, in a delayed manner relative to cells possessing an intact nucleation site (Figure 5B). Deletion of two other nucleation sites resulted in a similar delayed deposition and spreading of H3K27me3 to neighboring regions (Figures S5B and S5C). In each case, H3K27me3 levels were significantly reduced relative to cells with the intact nucleation site after 24 hr of EED expression, but almost fully recovered by 36 hr (Figure 5B; Figures S5B and S5C). This delayed deposition was specific to regions in cis with respect to the deletion site, as H3K27me3 levels were restored to WT levels within just 24 hr near other intact nucleation sites (Figures S5D–S5F). Thus, nucleation sites can facilitate the spread of PRC2 activity in cis, but a redundant network of interactions exists between genomic sites, pointing to a mechanism by which only a small number of nucleation sites can lead to the formation of thousands of H3K27me2/3 domains.
Figure 5. Functional and Structural Characterization of Nucleation Sites.

(A) Approach to assay for the formation of H3K27me3 domains in the absence of a nucleation site. The Evx2 nucleation site (red) is deleted within the i-WT-r rescue system (Figure 2A), and spreading (green) of PRC2 activity in cis was assayed by ChIP-qPCR.
(B) H3K27me3 ChIP-qPCR in i-WT-r cells harboring an intact versus deleted nucleation site, at the positions indicated relative to the TSSs of Evx2 (n = 2). WT EED rescue was performed with 4-OHT treatment for 24 and 36 hr, as indicated. Enrichment is calculated as percentage of input. One-tailed paired t test comparing Evx2 Del versus Intact site excluding the deleted region; p values: 24 hr 0.0293* and 36 hr 0.2478 (ns). Error bars represent the SD of the mean.
(C) Average H3K27me3 ChIP-seq density in Y365A EED mESCs was plotted within a 20-kb window centered around the TSSs of the top 293 H3K27me3 target genes (closest genes to 200 peaks identified in Figure 1E) in these cells (blue, positive control). Similarly, H3K27me3 density was plotted across a set of spatially interacting Polycomb target genes from Joshi et al. (2015) (red, 186 genes), Schoenfelder et al. (2015) (green, 195 genes), and across a random set of H3K27me3 target genes (black, 359 genes), in WT mESCs.
(D) 4C-seq track depicting the interaction frequency with respect to the Evx2 (strong nucleation site) viewpoint. 4C interacting regions (in black) and nucleation sites (in red) are indicated above. 4C interacting regions represent the intersection of 2 replicate experiments. Overlap between nucleation sites and 4C interacting regions are highlighted in gray. Nucleation sites are significantly enriched within 4C regions interacting with Evx2 (p value = 3.91E-13). Nucleation sites (Lhx2 and Pax6) having reduced interactions with the Evx2 viewpoint in the EED KO, but not cage mutant (Y365A) or WT setting, are labeled with an asterisk and their interaction profiles are plotted (top right, see asterisks for statistically significant regions). EED WT versus KO p values: Lhx2: from left to right 0.012, 0.004, 0.003; Pax6: 0.015).
Nucleation Sites Spatially Interact in the Nucleus
Recent 3C-based approaches have shown that Polycomb targets form a cluster of highly enriched H3K27me3 regions in mESCs (Denholtz et al., 2013; Vieux-Rochas et al., 2015; Schoenfelder et al., 2015; Joshi et al., 2015) as a result of long-range interactions. As this chromatin organization could conceivably orchestrate the long-distance spread of PRC2 activity, we next explored whether the nucleation sites we identified were enriched within published sets of spatially interacting Polycomb targets. We first plotted H3K27me3 density in the Y365A cage-mutant cells, centered around the TSSs of genes reported by two independent groups to lie in close spatial proximity. Strikingly, the average H3K27me3 density across these genes was similar to the positive control set of nucleation sites (Y365A) and was enriched over a randomized negative control (Figure 5C). Furthermore, another group recently identified 10 genomic sites via 4C sequencing (4C-seq) that frequently interact with the HoxD13 locus (Vieux-Rochas et al., 2015), which lies adjacent to the Evx2 nucleation site. Of these reported HoxD13 interactions, 70% overlapped with the set of nucleation sites we identified (data not shown). Thus, nucleation sites likely represent a large portion of the Polycomb target interaction network that is formed in mESCs.
To confirm the spatial proximity of nucleation sites, we performed 4C-seq in WT mESCs using nucleation sites as viewpoints. In agreement with our model, the Evx2 nucleation site was significantly enriched for interactions with other intra-chromosomal nucleation sites in WT mESCs (Figure 5D). We confirmed the spatial proximity of nucleation sites with 4C-seq using four other nucleation sites as viewpoints: Lhx2, Cyp26b1, HoxA, and HoxB clusters (Table S3). As controls, we used viewpoints placed at each of three different spreading sites (HoxC cluster, Specc1, and Irak4), the active gene Pou5f1, and a gene desert, which did not demonstrate significant interactions with PRC2 nucleation sites on the same chromosome (Table S3). Of note, although spreading sites are not at the core of the nucleation sites interaction network, they could still interact with some of the nucleation sites (Table S3), suggesting a crosstalk between spreading and nucleation sites. These observations suggest that spatial clustering can facilitate the spreading of H3K27me3 activity via long-range chromatin contacts such that one nucleation site can compensate for the absence of another, albeit with delayed dynamics (Figures 5B, S5B, and S5C).
We next asked whether chromatin contacts of nucleation sites are dependent on Polycomb activity itself. We observed no significant changes in the 4C interactome in WT versus cage-mutant EED (Y365A) cells across all 11 nucleation sites that interacted with Evx2. However, 2 nucleation sites (Lhx2 and Pax6) had a significantly reduced interaction frequency in EED KO cells as compared to WT mESCs (Figure 5D, top right, see asterisks). Taken together, our data strongly suggest that nucleation sites are in spatial proximity to each other and that, consistent with recent reports, this sub-nuclear architecture is partially dependent on Polycomb repressive chromatin domains (Denholtz et al., 2013; Schoenfelder et al., 2015).
PRC2 Spreading from a Group of Foci to Proximal and Distal Regions on Chromatin
Our 4C data demonstrating the spatial proximity of PRC2 nucleation sites can be seen as a molecular representation of Polycomb bodies within the nucleus. To visualize the progression of H3K27me3 foci formation, we performed immunofluorescence in i-WT-r cells using antibodies against H3K27me3 and EZH2, at 12-hr increments after EED expression was induced. Indeed, we were able to detect H3K27me3 foci starting just 12 hr after EED induction (Figure 6A), which corresponds to the initial appearance of H3K27me3 peaks by ChIP-seq (Figures 2B and 2C). Immuno fluorescence in situ hybridization (immuno-FISH) experiments confirmed that these 12-hr foci overlapped with a nucleation site (Evx2, near HoxD) at a significantly higher frequency than with a spreading site (HoxC) (Figure 6B; Figures S6A and S6B; Table S4). Importantly, Evx2 alleles overlapped with denser H3K27me3 foci, as compared to HoxC alleles (Figures S6A and S6B; Table S4). The observed foci (Figure 6A) increased in number and size by 24 hr and eventually spread to large regions of the nucleus by 36 hr. These data together with our 4C data demonstrating the spatial proximity of PRC2 nucleation sites and our ChIP-seq data tracking the initial deposition and spreading of H3K27me3 domains suggest that the observed foci are formed at spatially interacting nucleation sites and that H3K27me3 spreads from these foci to neighboring regions. Some of the observed foci at 24 hr are likely due to a local increase in EED concentration, for instance, in the case of weak nucleation sites that are not in spatial contact with strong ones. EZH2 exhibited a diffuse staining pattern, likely due to its promiscuous binding to nascent RNA transcripts (Kaneko et al., 2013; Davidovich et al., 2013) and/or its dynamic interaction with these foci, as evidenced by Drosophila fluorescence recovery after photobleaching experiments in which Polycomb group (PcG) proteins exhibited short residency times on chromatin in stem cells (Fonseca et al., 2012). Thus, the earliest phase of PRC2 recruitment occurred at a limited discrete group of foci, consistent with our model of nucleation followed by spreading to proximal and distal regions.
Figure 6. H3K27me3 Domains Initiate within Nuclear Hubs of PRC2 Activity, from which H3K27me3 Spreads in cis and far-cis via Long-Range Interactions.

(A) Immunofluorescence using the indicated antibodies at 0, 12, 24, and 36 hr after EED expression in i-WT-r mESCs. H3K27me3 staining at 36 hr is shown at lower exposures. The rightmost panel is a zoomed-in image of the cell labeled with a red arrow.
(B) Quantification of percentage of alleles colocalized with H3K27me3 foci using immuno-FISH, comparing probes for a nucleation site (Evx2) and a spreading site (HoxC) at 12 hr after EED expression in i-WT-r cells. n for Evx2: 98; n for HoxC: 100. Fisher’s exact test of a combination of two biological replicates: ****p value <0.0001. Error bars represent the SD of the mean.
(C) Immunofluorescence using H3K27me3 antibodies at 12 (left) and 24 (right) hr after rescue of EED expression in i-WT-r mESCs with the indicated genotypes. H3K27me3 staining at 24 hr is shown at lower exposures. The rightmost panel is a zoomed-in image of the cell labeled with a red arrow. Staining of EED KO cells (0 hr, without 4-OHT) is shown at bottom left as a control.
(D) Scheme for ectopic targeting of PRC2 to test proximal and distal spreading of its activity using the Tet repressor and Tet operator system in i-WT-r cells (see STAR Methods for details).
(E) Average scaled ChIP-seq read density of H3K27me3 plotted near the recruitment site using a 10-kb window centered around H3K27me3 peaks found in WT cells, before (–Dox) and 24 hr after (+Dox) induction of PRC2 recruitment downstream of the HoxC cluster and EED expression in i-WT-r mESCs. HoxC10 spatially interacted with the recruitment site downstream of the HoxC cluster and with the genes indicated and with CpGs, as determined by 4C-seq.
We performed similar analyses using i-WT-r cells having a KO of both JARID2 and MTF2 and rescued with WT EED expression. As expected, H3K27me3 foci formation in JARID2/MTF2 dKO cells were undetectable after 12-hr rescue (Figure 6C). Importantly, delayed H3K27me3 foci formation was detected in JARID2/MTF2 dKO cells after 24 hr of rescue. However, we failed to detect (stable) PRC2 recruitment to chromatin in JARID2/MTF2 dKO cells, even after 8 days of rescue with WT EED (Figures 4C and 4D). This result strongly suggests that PRC2 can be transiently recruited to nucleation sites (a “hit- and-run” mechanism, see below) and thereby generate H3K27me3-forming foci yet fails to be stabilized on chromatin in the absence of JARID2 and MTF2.
To examine the distal spreading from initial nucleation sites within H3K27me3 foci, we devised an artificial Tet repressor (TetR) and Tet operator (TetO) system in i-WT-r cells such that PRC2 can be recruited in a doxycycline-inducible manner to a region with known spatial interactions and lacking H3K27me3 (Figure 6D; see STAR Methods for details). Using endogenously tagged TetR-EZH2, PRC2 was recruited ~150 kb downstream of a region that interacts broadly across the HoxC cluster, or as a control, to a gene desert that does not exhibit detectable interactions with the HoxC cluster. Recruitment of PRC2 and expression of WT EED at 24 hr resulted in the formation of H3K27me3 domains of ~5 kb in size at both artificial recruitment sites in i-WT-r cells (Figures S6C and S6D). Importantly, as opposed to the case of the gene desert, recruitment of TetR-EZH2 to the region downstream of and in contact with HoxC led to a specific and significant increase in H3K27me3 signal on the entire HoxC locus (Figure 6E). These observations support our model that PRC2 activity spreads from an initial nucleation site not only to proximal regions in cis, but also to distal, contacting regions.
We next took advantage of the published data from Zheng et al. (2016) that mapped H3K27me3 domains during development. They showed that H3K27me3 was depleted from promoters in preimplantation embryos and de novo H3K27me3 was deposited in the epiblast, indicating a massive epigenetic reprogramming. We examined whether our nucleation sites overlapped with the de novo H3K27me3 peaks observed in the E5.5 epiblast. Indeed, the proportion of nucleation sites that significantly overlap with H3K27me3 peaks increased progressively during the transition from the 8-cell to the inner cell mass (ICM), and finally to the E5.5 epiblast stage (Figures S7A–S7C). Strikingly, almost all the PRC2 nucleation sites overlap those of the E5.5 epiblast. However, there were considerably more de novo peaks at the E5.5 epiblast stage that were exclusive (Figure S7C), suggesting that spreading from the nucleation sites had already begun. Interestingly, Polycomb deposition at nucleation sites occurs as early as the ICM stage (Figure S7D), suggesting that the critical chromatin rewiring decision is made at this phase. These observations provide evidence that the two-step mechanism that we detail below is applicable during in vivo epigenetic reprogramming.
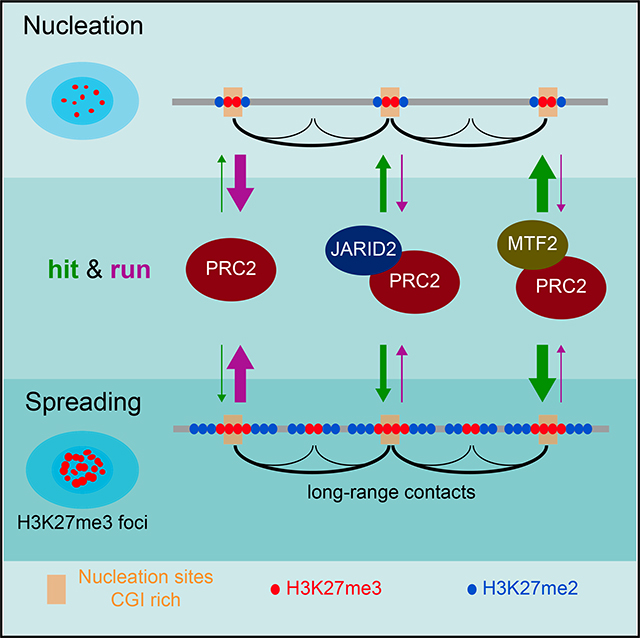
DISCUSSION
Taken together, our findings support the following model in which Polycomb foci are formed at a subset of Polycomb target genes (Figure 7) that are predominantly developmentally regulated and maintained in a silent state in mESCs. Nucleation sites comprising specific CGIs in general can engage in the nucleus to initiate a network of interactions (nucleation hubs) partially dependent on PRC2. From these initial nucleation sites, PRC2 spreads H3K27me2/3 to neighboring regions proximally as well as distally via long-range 3D contacts, all within sub-nuclear foci of Polycomb activity. PRC2 recruitment and stability on chromatin is dependent on its on and off rates, shown by arrows pointed “to” and “from” PRC2 recruitment site(s), respectively, in Figure 7. PRC2 alone may interact with the nucleation sites through a hit-and-run mechanism, an unstable interaction with a higher off than on rate. Its on rate is increased when associated with JARID2 and further increased when associated with MTF2. Once PRC2 reaches sufficient concentrations, it catalyzes H3K27me2 first and converts it to H3K27me3 at the nucleation sites, where it is more stably bound. From this initial nucleation event, PRC2 rapidly spreads H3K27me2/3 domains across the genome, such that its residency time on chromatin is decreased as it moves further from the nucleation sites, resulting in a more pronounced deposition of H3K27me2 than H3K27me3. The cage of EED is required for the stability and increased trimethylation activity of PRC2 through its interaction with H3K27me3 and thus for efficient spreading of both H3K27 di- and tri-methylation.
Figure 7. Model for PRC2 Recruitment to Chromatin and Establishment of H3K27me2/3 Domains.

In EED KO mESCs, spatial interactions among some, but not all nucleation sites are lost. Upon expression of EED, PRC2 is first recruited to regions called “nucleation hubs” that have a specific subset of CGIs forming spatial clusters in the nucleus. The stable binding of PRC2 to chromatin depends on its on and off rates, shown by arrows pointed “to” and “from” chromatin, respectively, with the size of the arrowheads reflecting relative PRC2 binding. PRC2 alone exhibits the lowest stability on chromatin, but its stability is increased when complexed with Jarid2 and further increased when complexed with MTF2. Upon reaching sufficient concentrations, PRC2 catalyzes H3K27me2 first and converts it to H3K27me3 at the nucleation sites, where it is more stably bound. From this initial nucleation event, PRC2 rapidly spreads H3K27me3 proximal to and H3K27me2 distal to the nucleation sites.
A recent study of the de novo establishment of H3K27me documented that the accurate de novo deposition of H3K27me proceeds without the need for this modification and that recruitment of PRC2 to CGIs is mediated by the N-terminal portion of Suz12 (Højfeldt et al., 2018). These findings are in accordance with our nucleation and spreading model. As we indicated here, nucleation of PRC2 requires specific CGIs and accessory factors such as JARID2 and MTF2, each of which interacts with distinct surfaces of N-terminal Suz12 (Chen et al., 2018). Importantly, as shown here and in our previous report (Lee et al., 2018), the efficient spreading of PRC2 activity requires its interaction with H3K27me3 for allosteric activation, which could not be addressed in Højfeldt et al. (2018) due to limitations in their system. While our system starts with chromatin devoid of any substrate, i.e., H3K27me2–3, which could serve as a recruiter and activator of the complex, residual H3K27me on chromatin was observed 7 days after treatment with an EZH2 inhibitor in the other study. Of note, the initial events and the kinetics upon rescue of PRC2 can be followed with our in vivo system, while steady-state analyses cannot capture such transitions.
Attempts to identify an analog of the Polycomb response element (PRE)-based recruitment paradigm from Drosophila (Woo et al., 2010; Schorderet et al., 2013; Mendenhall et al., 2010; Sing et al., 2009; Cuddapah et al., 2012) have been challenging in the case of the mammalian Polycomb system. Two putative mammalian PREs have been identified—a 1.4-kb region on mouse HoxD10 (Schorderet et al., 2013) and a 1.8-kb region between human HoxD11 and HoxD12 (Woo et al., 2010). While both regions retained H3K27me3 in the cage-mutant setting, their levels were significantly lower than in WT cells, unlike the neighboring Evx2 nucleation site. This finding suggests that Evx2 may be the strong “PRE” from which PRC2 activity spreads in cis through the HoxD cluster. Though specific mammalian PREs have remained elusive, genome-wide studies have identified correlations between PRC2 targets and CGIs, raising the possibility that these sequences influence recruitment (Ku et al., 2008; Mohn et al., 2008). Indeed, exogenous insertion of GC-rich elements in mESCs was sufficient to recruit PRC2 activity (Mendenhall et al., 2010; Lynch et al., 2012). This effect requires that a given CGI be devoid of activating motifs (Mendenhall et al., 2010), and, in accordance, PRC2 binds only to CGIs of non-transcribed genes (Riising et al., 2014). Interestingly, despite its high density CGIs, the HoxC cluster did not retain H3K27me3 in the cage mutants (Figure 1F), classifying it as a spreading site. Nonetheless, we have identified GCN motifs within CGIs near HoxC9 and HoxC12, suggesting that these CGIs may serve as nucleation sites to spread PRC2 activity through the HoxC cluster. However, HoxC12 was devoid of H3K27me3 and decorated by RNA Pol II, indicating that it is transcriptionally active. On the other hand, the CGI near HoxC9 was decorated by an active mark, H3K27ac, flanked by H3K27me3, implying that it is prone to activation. These observations reinforce our previous findings that transcriptional activity and/or accompanying active chromatin features may counteract Polycomb nucleation and spreading (Narendra et al., 2015).
Recent reports proposed that heterochromatin domain formation is driven by liquid phase separation (Hyman et al., 2014), which is induced by a high local concentration of HP1α, in Drosophila and mammals (Strom et al., 2017; Larson et al., 2017). Such a mechanism may pertain to the formation of sub-nuclear foci comprising nucleation sites with high, local concentrations of PRC2/MTF2 and/or PRC2/Jarid2 (Figures 2F, S4H, and S4I). This assemblage could drive the effective catalysis of H3K27me2/3.
Our finding that JARID2 and MTF2 are crucial for full recruitment of PRC2 to chromatin and for the establishment of de novo chromatin domains provides insights as to how metastable transcriptional states are established in normal and disease states in response to developmental and environmental signals. The approaches used herein might pioneer future studies aimed at identifying the dynamic development of other features of Polycomb domains, as well as other types of chromatin domains.
STAR★METHODS
CONTACT FOR REAGENT AND RESOURCE SHARING
Further information and requests for resources and reagents should be directed to and will be fulfilled by the Lead Contact, Danny Reinberg (danny.reinberg@nyumc.org).
METHOD DETAILS
Mouse ESC culture and differentiation
E14Tga2 (ATCC, CRL-1821) and C57BL/6 (gift from Agnel Sfeir) ESCs were grown in standard medium supplemented with LIF, 1 μM MEK1/2 inhibitor (PD0325901, Stemgent) and 3 μM GSK3 inhibitor (CHIR99021, Stemgent). For motor neuron differentiation, the protocol in Narendra et al. was used (Narendra et al., 2015). For neural progenitor differentiation, 300K ESCs were plated in suspension plates with medium containing 50% Advanced DMEM/F12 (Life Technologies: 12634–028), 50% Neurobasal Medium (Life Technologies: 21103–049), 15% Knockout Serum Replacement (Life Technologies: 10828–028), 1% Pen/Strep, 2 mM L-Glutamine, and 0.1 mM 2-mercaptoethanol to generate embryoid bodies (EBs). Four days later, the EBs were treated with 5 μM all-trans-Retinoic acid (RA, Sigma) for 4 days to generate neuronal progenitor cells. For cardiac differentiation, the protocol in Takahashi et al. was used (Takahashi et al., 2003). Briefly, 600K ESCs were plated in suspension plates with medium containing DMEM (Life Technologies: 11965–118), 20% FBS, 1% NEAA, 1% Pen/Strep, 2 mM L-Glutamine, 100 μM Ascorbic acid (Sigma). After 4 days, EB colonies were transferred into adherent plates. The media was changed every 2 days. Spontaneously beating colonies could be observed after 7 days in the WT cells.
CRISPR genome editing
gRNAs were designed using CRISPR design tool in https://benchling.com. All gRNAs in Table S5 were cloned in pSpCas9(BB)-2A-GFP (PX458, a gift from Feng Zhang, Addgene plasmid #48138) and transfected into ESCs either with oligo donor (ODN) or donor DNA (Table S5) cloned in PCR Blunt vector (Life Technologies), using Lipofectamine 2000 (Life Technologies). Single clones from GFP-positive cells were genotyped and confirmed by sequencing.
Generation of inducible WT or cage mutant EED rescue cells
See also Figure 2A. First, exon 10 and 11 of the endogenous copy of EED was deleted in mESCs (C57BL/6) possessing a CreERT2 transgene. Then a cassette within the intron following exon 9 of EED was introduced, which comprised its remaining 3′ cDNA sequence and a C-terminal Flag-HA tag upstream of T2A-GFP, all in reverse orientation with respect to the endogenous gene sequence. The cassette was flanked by a splice-acceptor and polyadenylation sequence nested between heterologous inverted loxP sites (lox66 and lox71) (Zhang and Lutz, 2002). Cells were propagated until a complete loss in H3K27me2/3 on chromatin was obtained (Figure S3E). Upon tamoxifen administration (4-OHT), exon 9 spliced directly into the cassette, producing an epitope-tagged WT or cage mutant EED protein along with a T2A-GFP marker to identify cells in which recombination was successful. All genome editing studies were performed using gRNAs and donor DNAs in Table S5.
Ectopic targeting of PRC2 using the Tet repressor and Tet operator system in i-WT-r cells
See also Figure 6D. Using CRISPR/Cas9 in i-WT-r cells, a cassette containing 5 copies of the Tet operator sequence (5xTetO) was integrated within a gene dense region ~150 kb downstream of the HoxC cluster with which it interacts broadly (located at chromosome 15). As a control, the same cassette was inserted within a gene desert on chromosome 5 that had no detectable interactions with the HoxC cluster (Figure 6D). Both endogenous EZH2 alleles were tagged with a mutant version of the Tet-repressor (TetR) DNA binding domain that binds to inserted TetO sequence arrays only in the presence of doxycycline. Expression of WT EED is induced by 4-OHT treatment for 24 hr. TetR-EZH2 is recruited to inserted TetO sequence arrays by 1 μg/μL doxycycline treatment 24 hr prior to 4-OHT treatment. Doxycycline was kept in the media until the end of the experiment.
Immunofluorescence
ESCs were fixed with 4% paraformaldehyde in PBS and permeabilized with PBS/0.25% Triton X-100 at RT for 30 min. After incubation with blocking buffer (PBS/5% donkey serum/0.1% Triton X-100) at RT for 30 min, primary antibodies were incubated overnight at 4°C. Several washes were performed with washing buffer (PBS/0.1% Triton X-100), before secondary antibody incubation. After several more washes and DAPI staining, cells were mounted with Aqua mount (Ref 13800) and imaged with Zeiss Airyscan 880 confocal microscopy at 63X magnification. Images are processed and pseudo-colored using a distribution of ImageJ, Fiji (Schindelin et al., 2012).
Immunoprecipitation
Nuclear extracts were prepared as in Gang Li et al. (Li et al., 2010). Following overnight antibody incubation, agarose beads were added and incubated for 2 hr at 4°C. After washing with BC200 with 0.1% NP40, antibody-antigen interactions were eluted with 2X Laemmli buffer and subjected to WB.
Chromatin immunoprecipitation followed by mass spectrometry (ChIP-MS)
Nuclei were extracted using HMSD buffer (20 mM HEPES, pH 7.5 at 4°C, 5 mM MgCl2, 250 mM sucrose, 1 mM DTT). Nuclei were resuspended in Mnase buffer (20 mM HEPES, pH 7.5 at 4°C, 100 mM NaCl, 5 mM CaCl2). Nuclei were treated with a limiting amount of Mnase at 37°C for 10 min, adjusted to yield nucleosomal lengths that average from 2 to 7 nucleosomes. The reaction was terminated with an equal volume of buffer with 10 mM EGTA and nuclei were ruptured by brief sonication to liberate the nucleosomal chains. Supernatant was collected and incubated with Flag beads to pull down Flag-HA tagged cage mutant (Y365A) or WT EED (Sigma) for 4 hr at 4°C. The beads were then washed with BC50 (20 mM HEPES, pH 7.5 at 4°C, 50 mM NaCl, 5 mM MgCl2) and elution was done with Flag peptide in BC50 (Sigma). All buffers included protease and phosphatase inhibitors as well 5 mM sodium butyrate. Eluted samples were trypsinized and subjected to standard data-dependent LC-MS/MS over a two-hour reverse phase gradient. Peptides were identified by Mascot and summed peptide peak integration values for individual proteins were acquired using Skyline Software.
ChIP-seq
ChIP-seq experiments were performed as described previously (Gao et al., 2012). Briefly, cells were fixed with 1% Formaldehyde. Nuclei were isolated using buffers in the following order: LB1 (50 mM HEPES, pH 7.5 at 4°C, 140 mM NaCl, 1 mM EDTA, 10% Glycerol, 0.5% NP40, 0.25% Triton X; 10 min at 4°C), LB2 (10 mM Tris, pH 8 at 4°C, 200 mM NaCl, 1 mM EDTA, 0.5 mM EGTA; 10 min at RT), and LB3 (10 mM Tris, pH 7.5 at 4°C, 1 mM EDTA, 0.5 mM EGTA, and 0.5% N-Lauroylsarcosine sodium salt). Chromatin was fragmented to an average size of 250 bp using a Diagenode Bioruptor. Chromatin immunoprecipitation was performed with the antibodies listed in Table S5. Chromatin from Drosophila (in a 1:50 ratio to the ESC-derived chromatin) as well as Drosophila specific H2Av antibody was used as spike-in control in each sample. For ChIP-seq, libraries were prepared as described in Narendra et al. (Narendra et al., 2015) using 1–30 ng of immunoprecipitated DNA. All ChIP-seq experiments are listed in Table S5. ChIP-qPCRs were performed with 2X SYBR Green Master PCR mix (Roche), and detected by Stratagene Mx3005p instrument. All ChIP-qPCR primers are listed in Table S5.
RNA-seq
Total RNA from ESCs and EBs (day 2) was isolated with TRIzol (Life Technologies) and reverse transcribed using Superscript III and random hexamers (Life Technologies) to synthesize the first strand. Second strand was synthesized with dUTP to generate strand asymmetry using DNA Pol I (NEB, M0209L) and the E. coli ligase (Enzymatics, L6090L). RNA-seq libraries were constructed using the protocol described in Narendra et al. (Narendra et al., 2015). All RNA-seq experiments are listed in Table S5.
4C-seq
The protocol from van de Werken et al. (van de Werken et al., 2012) was used to prepare 4C-seq libraries. HindIII-DpnII inverse primers for the bait regions were chosen from https://compgenomics.weizmann.ac.il/tanay/?page_id=367. Illumina compatible 5′ adaptor overhangs from van de Werken et al. (van de Werken et al., 2012) were included in the primers for high-throughput sequencing. All 4C-seq primers are listed in Table S5.
Data analysis
ChIP-seq
Sequence reads for ChIP-seq were mapped with Bowtie 2 using default parameters (Langmead et al., 2009). After normalization with the spike-in Drosophila read counts, ChIP-seq densities were visualized on the USCS genome browser (https://genome.ucsc.edu/). Heatmaps for the ChIP-seq experiments were generated using deepTools (Ramírez et al., 2014). Average ChIP-seq read density profiles were plotted using R programming. Venn diagrams to visualize the extent of the overlap among ChIP-seq samples were drawn using ‘ChIPpeakAnno’ package from Bioconductor (Zhu et al., 2010).
To generate the MA plots in Figures S2A–S2D, the sum of the spiked-in binned counts on the defined sites were taken. Null and negative values were removed. The binned count values were multiplied by 10,000, to avoid negative values after log2 scale conversion and enhance data presentation. edgeR ‘maPlot’ function with smooth.scatter = TRUE, was used. The fold change was calculated on a log2 scale.
RNA-seq
RNA-seq experiments were analyzed as previously reported (Narendra et al., 2015). Briefly, sequence reads were mapped with Bowtie (Langmead et al., 2009) and normalized differential gene expression was calculated with DEseq (R package) (Anders and Huber, 2010).
4C-Seq
Sequence reads from 4C-Seq were aligned and processed as described previously using 4C-ker (Raviram et al., 2016). The cisAnalysis function was used to call interacting 4C domains for each viewpoint. For the HoxB, Specc1 and Pou5f1 baits, a k of 5 was used and for the rest, a k of 10 was used. 4C-tracks were visualized by IGV (Robinson et al., 2011). To compare the number of overlapping nucleation sites with 4C interacting domains, a two tailed fishers exact test in ‘fisher’ function of bedtools was used (Quinlan and Hall, 2010).
To identify differences between genotypes (WT versus EED KO or WT versus EED cage mutant), DESeq2 with default parameters was used to normalize total read count per window between samples and to identify the 4Cker-built (Raviram et al., 2016) windows with significant 4C signal differences using an FDR-adjusted p value cutoff of 0.05.
Liquid Chromatography and Quantitative Histone Mass Spectrometry
Total nuclear histones were isolated by standard acid extraction (Lin and Garcia, 2012). The histones were next derivatized with propionic anhydride, which adds propionyl groups to unmodified and monomethylated lysines prior to trypsinization. Post-trypsinization, the peptides were derivatized with propionic anhydride which adds a propionyl group to the newly formed n-termini. Analytical columns were produced in-house by pulling fused silica microcapillary tubing (75 μm i.d.) with a flame to generate a tip. The columns were packed with ReproSil-Pur C18-AQ resin (3 μm, Dr. Maisch GmbH, Germany) using a pressurized cylinder. A Thermo Easy NanoLC 1000 HPLC (Thermo Scientific, Odense, Denmark) was used to load sample (1.5 μg) onto the column. Samples were resuspended in 0.1% formic acid prior to loading. Peptides were then separated using reverse-phase chromatography composed of two buffers: buffer A: 0.1% formic acid in water, buffer B: 0.1% formic acid in acetonitrile. A 60-minute gradient was applied to the column at 300 nL/min flow rate: 0%–28%B in 45 min, 28%–80%B in 5 min, 80%B for 10 min. Samples were eluted into a hybrid linear ion trap-Orbitrap (Orbitrap Elite, Thermo Scientific, Bremen, Germany). Full MS scans (300–1100 m/z) were collected in the Orbitrap at a resolution of 120,000 and an AGC target of 5 × 10⁵. MS/MS scans were obtained using collision induced dissociation (CID) with a normalized collision energy of 35 in the ion trap with an AGC target of 3 × 10⁴. The method first collected a full MS spectra followed by 8 MS/MS spectra covering 300–700 m/z in 50 m/z windows (i.e., 300–350 m/z, 350–400 m/z, etc.). A second full MS was obtained followed by 8 more MS/MS spectra covering 700–1100 m/z in 50 m/z windows. Mass spectrometry data were analyzed using EpiProfile software (Yuan et al., 2015) and the quants for the H3 (27–40 aa) peptides were further verified manually.
Protein expression and purification
6xHIS-tagged EZH2, FLAG-tagged EED, Suz12, and RbAp48 were subcloned in pFASTBac1 baculovirus expression plasmid (Lee et al., 2018). Recombinant PRC2 core complex was produced in SF9 cells grown in SF-900 III SFM (Invitrogen). After 60 hr of infection, SF9 cells were harvested and resuspended in BC150 (25 mM Tris-HCl, pH 7.9, 0.2 mM EDTA, 150 mM KCl, and 10% glycerol) with 0.1% NP40 and protease inhibitors (1 mM phenylmethlysulfonyl fluoride [PMSF], 0.1 mM benzamidine, 1.25 mg/mL leupeptin, and 0.625 mg/mL pepstatin A). Cells were then sonicated and PRC2 was purified through Ni-NTA agarose bead (QIAGEN), FLAG-M2 agarose beads (Sigma), and Q Sepharose column (GE Healthcare).
Hetero-oligonucleosome preparation
Methylated histones were generated by using the Methyl Lysine Analog (MLA) strategy as described previously (Simon et al., 2007; Simon and Shokat, 2012). Octamers were prepared as described previously (Lusser and Kadonaga, 2004; Yun et al., 2012). To generate hetero-oligonucleosomes, the indicated ratio of effector and substrate octamers were mixed with 8× 601 sequence containing linearized DNA templates and subjected to salt dialysis (Lusser and Kadonaga, 2004; Yun et al., 2012). The concentrations of hetero-oligonucleosomes were determined by quantifying the amount of nucleosomal DNA on a 0.8% agarose gel and visualization with ethidium bromide staining.
Histone methyltransferase (HMT) assay
Standard HMT assays were performed as described previously (Margueron et al., 2009; Son et al., 2013). Briefly, the reaction was performed in a total volume of 15 mL of HMT buffer (50 mM Tris-HCl, pH 8.5, 5 mM MgCl2, and 4 mM DTT) with 3H-labeled SAM, substrate (recombinant nucleosomes), and the indicated concentration of PRC2, either WT or comprising EED Y365A. The reaction mixture was incubated for 1 hr at 30°C and separated by SDS-PAGE gel electrophoresis. The gel was transferred to a PVDF membrane. The membrane was exposed to X-ray film (Kodak XAR) to detect the level of methylation as analyzed by autoradiography exposure.
DNA FISH with immunofluorescence
Bacterial artificial chromosomes (BACs) containing Exv2 (RP23–331E7, RP23–364J22), Hoxc13 (RP23–430C12), and a nearby probe to help locate Hoxc13 (RP24–119A11) were chosen using USCS browser and ordered from BACPAC (http://bacpac.chori.org/). These BACs were labeled by nick translation with 5-(3-aminoallyl)-dUTP (Life Technologies), and then converted into the required fluorophore with Alexa Fluor 647 and Alexa Fluor 555 Reactive Dye (Life Technologies). For each 22×22 mm coverslip, 1 μg of labeled BAC DNA, 1 μg of sheared salmon sperm DNA (Ambion) and 1 μg of Cot-1 (Life Technologies), 1 μg Mouse Hybloc DNA (Applied Genetics Lab) were precipitated and resuspended in 20 μL hybridization buffer (50% formamide/20% dextran sulfate/5X denhardt’s solution). The fluorescence in situ hybridization (FISH) protocol was adapted from Chaumeil et al., 2008 (Chaumeil et al., 2008). Briefly, 1 × 10⁶ cells were adhered to poly-L-lysine coated coverslips, fixed for 10 min with 2% (wt/vol) paraformaldehyde/PBS on ice, washed three times in cold PBS, and permeabilized for 10 min on ice with 0.5% (vol/vol) Triton/PBS. Samples were then washed three times in cold PBS, and incubated for 1 hr at 22°C in blocking solution (2.5% (wt/vol) BSA, 10% (vol/vol) normal goat serum and 0.1% (vol/vol) Tween-20 in PBS). Samples were incubated for 1 hr at 22°C with a rabbit antibody raised against H3K27me3 (Cell Signaling technology) diluted 1:200 in blocking solution. Cells were washed three times with 0.2% (wt/vol) BSA/ 0.1% (vol/vol) Tween-20/PBS and then incubated for 1 hr at 22°C with donkey anti-rabbit IgG Alexa Fluor 488 (Thermofisher) diluted 1:500 in blocking solution. Cells were washed three times with 0.1% (vol/vol) Tween-20 in PBS. Cells were post-fixed for 10 min at 22°C in 2% (wt/vol) paraformaldehyde, briefly rinsed in 2X saline sodium citrate (SSC), then incubated with RNaseA (0.1 mg/mL in 2XSSC) for 1 hr at 37°C. Cells were then re-permeabilized for 10 min on ice in 0.7% (vol/vol) Triton X-100/0.1 M HCl. Probes and cells were then denatured together on glass slides for 2 min at 75°C. Slides were then incubated overnight at 37°C. Coverslips were then removed from the slides and washed three times with 50% (vol/vol) formamide, 2XSSC at 42°C, followed by three washes in 2XSSC at 42°C and three washes in 2XSSC at 22°C. Coverslips were then mounted in Prolong Gold (Life Technologies) containing 1.5 μg/mL 4,6-diamidino-2-phenylindole (DAPI, Sigma).
Confocal microscopy and analysis
DNA FISH with immunofluorescence was imaged by confocal microscopy on a Leica SP5 AOBS system (Acousto-Optical Beam Splitter). Optical sections separated by 0.3 μm were collected and only cells with H3K27me3 signal were analyzed using ImageJ software (NIH). Signal for probes that were scored (RP23–331E7 for Exv2 and RP23–430C12 for Hoxc13) were confirmed using localization of “helper” probes (RP23–364J22 for Evx2 and RP24–119A11 for Hoxc13), which appeared in a limited nuclear volume near the scored probe. Probes were defined as co-localized with H3K27me3 if the DNA probe signals and immunofluorescence foci directly overlapped (at least two pixels of colocalization). Statistical significances were calculated by a two-sided Fisher’s exact test and p values ≤ 5.00e-2 were taken as significant. As detailed in each case in the figure legends, p values displayed in the main figures were applied to combined data from repeated experiments. Error bars represent the standard deviation between experiments.
DATA AND SOFTWARE AVAILABILITY
The accession number for the sequencing data reported in this paper is GEO: GSE94431. Source data for gel images and graphs can be found in Mendeley Data: https://data.mendeley.com/datasets/fzht5rdb4s/1.
Supplementary Material
KEY RESOURCES TABLE.
| REAGENT or RESOURCE | SOURCE | IDENTIFIER |
|---|---|---|
| Antibodies | ||
| H3K27Me3 | Cell Signaling Technology | Cat# 9733 RRID:AB_2616029 |
| H3K27Me2 | Cell Signaling Technology | Cat# 9728 RRID:AB_1281338 |
| SUZ12 | Cell Signaling Technology | Cat# 3737 RRID:AB_2196850 |
| KDM2B | Gift from R. Klose Lab | N/A |
| HA-tag | Abcam | Cat# ab9110 RRID:AB_307019 |
| JARID2 | In House | N/A |
| EZH2 | In House | N/A |
| EZH2 | BD | Cat# 612666 RRID:AB_2102429 |
| EED | In House | N/A |
| MTF2 | Protein Tech | Cat# 16208-1-AP RRID:AB_2147370 |
| H2AV | Active Motif | Cat# 39715 RRID:AB_2616150 |
| H3K27Me2/3 | In House | N/A |
| Biological Samples | ||
| C57BL/6 (mESC with CreERT2 transgene) | Gift from Agnel Sfeir | N/A |
| ES-E14TG2a (E14 mESC) | ATCC | CRL-1821 |
| Chemicals, Peptides, and Recombinant Proteins | ||
| Anti-FLAG M2 affinity gel | Sigma-Aldrich | Cat# A2220-5ML RRID:AB_10063035 |
| Lipofectamine 2000 | Thermo Fisher Scientific | Cat# 11668027 |
| Deposited Data | ||
| Source data for gel images and graphs | Mendeley Data | https://data.mendeley.com/datasets/fzht5rdb4s/1 |
| ChIP-seq, RNA-seq and 4C-seq data | This study | GEO: GSE94431 |
| Experimental Models: Cell Lines | ||
| ES-E14TG2a – EED Y365A (cage-mutant) | This study | N/A |
| ES-E14TG2a – EED F97A (cage-mutant) | This study | N/A |
| ES-E14TG2a – EED Y358A (control-mutant) | This study | N/A |
| ES-E14TG2a – EED KO | This study | N/A |
| C57BL/6 – i-WT-r (inducible WT EED rescue) | This study | N/A |
| C57BL/6 – i-MT-r (inducible cage-mutant EED rescue) | This study | N/A |
| C57BL/6 – i-WT-r + 5xTetO (inserted downstream of HoxC cluster) + TetR-EZH2 (homozygous) | This study | N/A |
| C57BL/6 – i-WT-r + 5xTetO (inserted into a gene desert) + TetR-EZH2 (homozygous) | This study | N/A |
| ES-E14TG2a – i-WT-r + Evx2 deletion | This study | N/A |
| ES-E14TG2a – i-WT-r + promoter Evx2 deletion | This study | N/A |
| ES-E14TG2a – i-WT-r + control deletion | This study | N/A |
| C57BL/6 – i-WT-r + Evx2 deletion | This study | N/A |
| C57BL/6 – i-WT-r + Skor1 deletion | This study | N/A |
| C57BL/6 – i-WT-r + Lmx1b deletion | This study | N/A |
| C57BL/6 – i-WT-r + JARID2 KO | This study | N/A |
| C57BL/6 – i-WT-r + MTF2 KO | This study | N/A |
| C57BL/6 – i-WT-r + JARID2/MTF2 dKO | This study | N/A |
| Sf9 (Spodoptera frugiperda) Insect Cells | Life Technologies | Cat# 11496-015 |
| Oligonucleotides | ||
| CRISPR constructs, ChIP-qPCR and 4C-seq primers | This study (Table S5) | N/A |
| Recombinant DNA | ||
| pFASTBac1 | Invitrogen | Cat# 10-360-014 |
| pFASTBac1-6xHIS-EZH2 | Lee et al., 2018 | N/A |
| pFASTBac1-FLAG-EED | Lee et al., 2018 | N/A |
| pFASTBac1-SUZ12 | Lee et al., 2018 | N/A |
| pFASTBac1-RBAP48 | Lee et al., 2018 | N/A |
| pFASTBac1-FLAG-EED Y365A | Lee et al., 2018 | N/A |
| pSpCas9(BB)-2A-GFP | Addgene | Cat # 48138 |
| Software and Algorithms | ||
| ImageJ, Fiji | NIH and Schindelin et al., 2012 | N/A |
| Prism | GraphPad Software | N/A |
| Benchling | https://benchling.com | N/A |
| bedtools | Quinlan and Hall, 2010 | N/A |
| 4Cker-built | Raviram et al., 2016 | N/A |
| EpiProfile | Yuan et al., 2015 | N/A |
| Bowtie 2 | Langmead et al., 2009 | N/A |
| deepTools | Ramírez et al., 2014 | N/A |
| ‘ChIPpeakAnno’ package from Bioconductor | Zhu et al., 2010 | N/A |
| DEseq (R package) | Anders and Huber, 2010 | N/A |
Highlights.
PRC2 nucleation at a subset of CpG islands forms spatial clusters in the nucleus
JARID2 and MTF2 increase the stability of PRC2 at its nucleation sites
Initial PRC2 activity forms H3K27me3 foci within the nucleus
After nucleation, PRC2 spreads H3K27me2/3 in cis and in far-cis via 3D contacts
ACKNOWLEDGMENTS
We thank Drs. L. Vales, K.J. Armache, and E.O. Mazzoni for comments on the manuscript; J. Granat for technical assistance; Drs. R.A. Ganai, T. Escobar, and S. Krishnan for discussions; Y. Grobler for providing Drosophila S2R+ cells; Drs. A. Sfeir and R.J. Klose for kind gifts of the C57BL/6 mESCs and KDM2B antibody, respectively; New York University Langone Medical Center (NYULMC) Genome Technology Center, particularly A. Heguy, P. Zappile, and P. Meyn, for help with sequencing; NYULMC Cytometry and Cell Sorting Core for help with FACS; and NYULMC Microscopy Core for help with imaging. The NYULMC Genome Technology Center and the NYUMC Cytometry and Cell Sorting Core are partially supported by the Cancer Center Support Grant, P30CA016087, at the Laura and Isaac Perlmutter Cancer Center. This work utilized computing resources at the High-Performance Computing Facility of the Center for Health Informatics and Bioinformatics at the NYULMC. P.P.R. is a National Cancer Center and American Society of Hematology Fellow and has a K99 Career Transition Award (K99GM117302). This work was supported by grants from the National Cancer Institute (9R01CA199652-13A1 to D.R.), the Howard Hughes Medical Institute (to D.R.), and the NIH (R01GM086852 and R01GM112192 to J.A.S.; GM110174 and CA196539 to B.A.G.).
Footnotes
DECLARATION OF INTERESTS
The authors declare no competing interests.
SUPPLEMENTAL INFORMATION
Supplemental Information includes seven figures and five tables and can be found with this article online at https://doi.org/10.1016/j.molcel.2018.05.023.
REFERENCES
- Anders S, and Huber W (2010). Differential expression analysis for sequence count data. Genome Biol. 11, R106. [DOI] [PMC free article] [PubMed] [Google Scholar]
- Blackledge NP, Farcas AM, Kondo T, King HW, McGouran JF, Hanssen LL, Ito S, Cooper S, Kondo K, Koseki Y, et al. (2014). Variant PRC1 complex-dependent H2A ubiquitylation drives PRC2 recruitment and polycomb domain formation. Cell 157, 1445–1459. [DOI] [PMC free article] [PubMed] [Google Scholar]
- Bonasio R, Tu S, and Reinberg D (2010). Molecular signals of epigenetic states. Science 330, 612–616. [DOI] [PMC free article] [PubMed] [Google Scholar]
- Bonhoure N, Bounova G, Bernasconi D, Praz V, Lammers F, Canella D, Willis IM, Herr W, Hernandez N, and Delorenzi M; CycliX Consortium (2014). Quantifying ChIP-seq data: A spiking method providing an internal reference for sample-to-sample normalization. Genome Res 24, 1157–1168. [DOI] [PMC free article] [PubMed] [Google Scholar]
- Boyer LA, Plath K, Zeitlinger J, Brambrink T, Medeiros LA, Lee TI, Levine SS, Wernig M, Tajonar A, Ray MK, et al. (2006). Polycomb complexes repress developmental regulators in murine embryonic stem cells. Nature 441, 349–353. [DOI] [PubMed] [Google Scholar]
- Chaumeil J, Augui S, Chow JC, and Heard E (2008). Combined immunofluorescence, RNA fluorescent in situ hybridization, and DNA fluorescent in situ hybridization to study chromatin changes, transcriptional activity, nuclear organization, and X-chromosome inactivation. Methods Mol. Biol 463, 297–308. [DOI] [PubMed] [Google Scholar]
- Chen S, Jiao L, Shubbar M, Yang X, and Liu X (2018). Unique structural platforms of Suz12 dictate distinct classes of PRC2 for chromatin binding. Mol. Cell 69, 840–852. [DOI] [PMC free article] [PubMed] [Google Scholar]
- Cuddapah S, Roh TY, Cui K, Jose CC, Fuller MT, Zhao K, and Chen X (2012). A novel human polycomb binding site acts as a functional polycomb response element in Drosophila. PLoS ONE 7, e36365. [DOI] [PMC free article] [PubMed] [Google Scholar]
- Davidovich C, Zheng L, Goodrich KJ, and Cech TR (2013). Promiscuous RNA binding by Polycomb repressive complex 2. Nat. Struct. Mol. Biol 20, 1250–1257. [DOI] [PMC free article] [PubMed] [Google Scholar]
- Denholtz M, Bonora G, Chronis C, Splinter E, de Laat W, Ernst J, Pellegrini M, and Plath K (2013). Long-range chromatin contacts in embryonic stem cells reveal a role for pluripotency factors and polycomb proteins in genome organization. Cell Stem Cell 13, 602–616. [DOI] [PMC free article] [PubMed] [Google Scholar]
- Egan B, Yuan CC, Craske ML, Labhart P, Guler GD, Arnott D, Maile TM, Busby J, Henry C, Kelly TK, et al. (2016). An alternative approach to ChIP-seq normalization enables detection of genome-wide changes in histone H3 lysine 27 trimethylation upon EZH2 inhibition. PLoS ONE 11, e0166438. [DOI] [PMC free article] [PubMed] [Google Scholar]
- Ferrari KJ, Scelfo A, Jammula S, Cuomo A, Barozzi I, Stützer A, Fischle W, Bonaldi T, and Pasini D (2014). Polycomb-dependent H3K27me1 and H3K27me2 regulate active transcription and enhancer fidelity. Mol. Cell 53, 49–62. [DOI] [PubMed] [Google Scholar]
- Fonseca JP, Steffen PA, Müller S, Lu J, Sawicka A, Seiser C, and Ringrose L (2012). In vivo Polycomb kinetics and mitotic chromatin binding distinguish stem cells from differentiated cells. Genes Dev 26, 857–871. [DOI] [PMC free article] [PubMed] [Google Scholar]
- Gao Z, Zhang J, Bonasio R, Strino F, Sawai A, Parisi F, Kluger Y, and Reinberg D (2012). PCGF homologs, CBX proteins, and RYBP define functionally distinct PRC1 family complexes. Mol. Cell 45, 344–356. [DOI] [PMC free article] [PubMed] [Google Scholar]
- Grijzenhout A, Godwin J, Koseki H, Gdula MR, Szumska D, McGouran JF, Bhattacharya S, Kessler BM, Brockdorff N, and Cooper S (2016). Functional analysis of AEBP2, a PRC2 Polycomb protein, reveals a Trithorax phenotype in embryonic development and in ESCs. Development 143, 2716–2723. [DOI] [PMC free article] [PubMed] [Google Scholar]
- He J, Shen L, Wan M, Taranova O, Wu H, and Zhang Y (2013). Kdm2b maintains murine embryonic stem cell status by recruiting PRC1 complex to CpG islands of developmental genes. Nat. Cell Biol. 15, 373–384. [DOI] [PMC free article] [PubMed] [Google Scholar]
- Højfeldt JW, Laugesen A, Willumsen BM, Damhofer H, Hedehus L, Tvardovskiy A, Mohammad F, Jensen ON, and Helin K (2018). Accurate H3K27 methylation can be established de novo by SUZ12-directed PRC2. Nat. Struct. Mol. Biol 25, 225–232. [DOI] [PMC free article] [PubMed] [Google Scholar]
- Holoch D, and Margueron R (2017). Mechanisms regulating PRC2 recruitment and enzymatic activity. Trends Biochem. Sci 42, 531–542. [DOI] [PubMed] [Google Scholar]
- Hyman AA, Weber CA, and Jülicher F (2014). Liquid-liquid phase separation in biology. Annu. Rev. Cell Dev. Biol 30, 39–58. [DOI] [PubMed] [Google Scholar]
- Joshi O, Wang S-Y, Kuznetsova T, Atlasi Y, Peng T, Fabre PJ, Habibi E, Shaik J, Saeed S, Handoko L, et al. (2015). Dynamic reorganization of extremely long-range promoter-promoter interactions between two states of pluripotency. Cell Stem Cell 17, 748–757. [DOI] [PubMed] [Google Scholar]
- Kaneko S, Son J, Shen SS, Reinberg D, and Bonasio R (2013). PRC2 binds active promoters and contacts nascent RNAs in embryonic stem cells. Nat. Struct. Mol. Biol 20, 1258–1264. [DOI] [PMC free article] [PubMed] [Google Scholar]
- Kim H, Kang K, and Kim J (2009). AEBP2 as a potential targeting protein for Polycomb Repression Complex PRC2. Nucleic Acids Res 37, 2940–2950. [DOI] [PMC free article] [PubMed] [Google Scholar]
- Ku M, Koche RP, Rheinbay E, Mendenhall EM, Endoh M, Mikkelsen TS, Presser A, Nusbaum C, Xie X, Chi AS, et al. (2008). Genomewide analysis of PRC1 and PRC2 occupancy identifies two classes of bivalent domains. PLoS Genet 4, e1000242. [DOI] [PMC free article] [PubMed] [Google Scholar]
- Landeira D, Sauer S, Poot R, Dvorkina M, Mazzarella L, Jørgensen HF, Pereira CF, Leleu M, Piccolo FM, Spivakov M, et al. (2010). Jarid2 is a PRC2 component in embryonic stem cells required for multi-lineage differentiation and recruitment of PRC1 and RNA Polymerase II to developmental regulators. Nat. Cell Biol 12, 618–624. [DOI] [PMC free article] [PubMed] [Google Scholar]
- Langmead B, Trapnell C, Pop M, and Salzberg SL (2009). Ultrafast and memory-efficient alignment of short DNA sequences to the human genome. Genome Biol 10, R25. [DOI] [PMC free article] [PubMed] [Google Scholar]
- Larson AG, Elnatan D, Keenen MM, Trnka MJ, Johnston JB, Burlingame AL, Agard DA, Redding S, and Narlikar GJ (2017). Liquid droplet formation by HP1α suggests a role for phase separation in heterochromatin. Nature 547, 236–240. [DOI] [PMC free article] [PubMed] [Google Scholar]
- Lee HG, Kahn TG, Simcox A, Schwartz YB, and Pirrotta V (2015). Genome-wide activities of Polycomb complexes control pervasive transcription. Genome Res 25, 1170–1181. [DOI] [PMC free article] [PubMed] [Google Scholar]
- Lee C-H, Yu J-R, Kumar S, Jin Y, LeRoy G, Bhanu N, Kaneko S, Garcia BA, Hamilton AD, and Reinberg D (2018). Allosteric activation dictates PRC2 activity independent of its recruitment to chromatin. Mol. Cell 70, 422–434. [DOI] [PMC free article] [PubMed] [Google Scholar]
- Li G, Margueron R, Ku M, Chambon P, Bernstein BE, and Reinberg D (2010). Jarid2 and PRC2, partners in regulating gene expression. Genes Dev 24, 368–380. [DOI] [PMC free article] [PubMed] [Google Scholar]
- Li H, Liefke R, Jiang J, Kurland JV, Tian W, Deng P, Zhang W, He Q, Patel DJ, Bulyk ML, et al. (2017). Polycomb-like proteins link the PRC2 complex to CpG islands. Nature 549, 287–291. [DOI] [PMC free article] [PubMed] [Google Scholar]
- Lin S, and Garcia BA (2012). Examining histone posttranslational modification patterns by high-resolution mass spectrometry. Methods Enzymol 512, 3–28. [DOI] [PMC free article] [PubMed] [Google Scholar]
- Lusser A, and Kadonaga JT (2004). Strategies for the reconstitution of chromatin. Nat. Methods 1, 19–26. [DOI] [PubMed] [Google Scholar]
- Lynch MD, Smith AJ, De Gobbi M, Flenley M, Hughes JR, Vernimmen D, Ayyub H, Sharpe JA, Sloane-Stanley JA, Sutherland L, et al. (2012). An interspecies analysis reveals a key role for unmethylated CpG dinucleotides in vertebrate Polycomb complex recruitment. EMBO J 31, 317–329. [DOI] [PMC free article] [PubMed] [Google Scholar]
- Margueron R, and Reinberg D (2010). Chromatin structure and the inheritance of epigenetic information. Nat. Rev. Genet 11, 285–296. [DOI] [PMC free article] [PubMed] [Google Scholar]
- Margueron R, and Reinberg D (2011). The Polycomb complex PRC2 and its mark in life. Nature 469, 343–349. [DOI] [PMC free article] [PubMed] [Google Scholar]
- Margueron R, Justin N, Ohno K, Sharpe ML, Son J, Drury WJ 3rd, Voigt P, Martin SR, Taylor WR, De Marco V, et al. (2009). Role of the polycomb protein EED in the propagation of repressive histone marks. Nature 461, 762–767. [DOI] [PMC free article] [PubMed] [Google Scholar]
- Mendenhall EM, Koche RP, Truong T, Zhou VW, Issac B, Chi AS, Ku M, and Bernstein BE (2010). GC-rich sequence elements recruit PRC2 in mammalian ES cells. PLoS Genet. 6, e1001244. [DOI] [PMC free article] [PubMed] [Google Scholar]
- Mohn F, Weber M, Rebhan M, Roloff TC, Richter J, Stadler MB, Bibel M, and Schübeler D (2008). Lineage-specific polycomb targets and de novo DNA methylation define restriction and potential of neuronal progenitors. Mol. Cell 30, 755–766. [DOI] [PubMed] [Google Scholar]
- Narendra V, Rocha PP, An D, Raviram R, Skok JA, Mazzoni EO, and Reinberg D (2015). CTCF establishes discrete functional chromatin domains at the Hox clusters during differentiation. Science 347, 1017–1021. [DOI] [PMC free article] [PubMed] [Google Scholar]
- Orlando DA, Chen MW, Brown VE, Solanki S, Choi YJ, Olson ER, Fritz CC, Bradner JE, and Guenther MG (2014). Quantitative ChIP-Seq normalization reveals global modulation of the epigenome. Cell Rep 9, 1163–1170. [DOI] [PubMed] [Google Scholar]
- Pasini D, Cloos PA, Walfridsson J, Olsson L, Bukowski JP, Johansen JV, Bak M, Tommerup N, Rappsilber J, and Helin K (2010). JARID2 regulates binding of the Polycomb repressive complex 2 to target genes in ES cells. Nature 464, 306–310. [DOI] [PubMed] [Google Scholar]
- Peng JC, Valouev A, Swigut T, Zhang J, Zhao Y, Sidow A, and Wysocka J (2009). Jarid2/Jumonji coordinates control of PRC2 enzymatic activity and target gene occupancy in pluripotent cells. Cell 139, 1290–1302. [DOI] [PMC free article] [PubMed] [Google Scholar]
- Pengelly AR, Copur Ö., Jückle H, Herzig A, and Müller J (2013). A histone mutant reproduces the phenotype caused by loss of histone-modifying factor Polycomb. Science 339, 698–699. [DOI] [PubMed] [Google Scholar]
- Quinlan AR, and Hall IM (2010). BEDTools: A flexible suite of utilities for comparing genomic features. Bioinformatics 26, 841–842. [DOI] [PMC free article] [PubMed] [Google Scholar]
- Ramírez F, Dündar F, Diehl S, Grüning BA, and Manke T (2014). deepTools: A flexible platform for exploring deep-sequencing data. Nucleic Acids Res 42, W187–W191. [DOI] [PMC free article] [PubMed] [Google Scholar]
- Raviram R, Rocha PP, Müller CL, Miraldi ER, Badri S, Fu Y, Swanzey E, Proudhon C, Snetkova V, Bonneau R, and Skok JA (2016). 4C-ker: A method to reproducibly identify genome-wide interactions captured by 4C-seq experiments. PLoS Comput. Biol 12, e1004780. [DOI] [PMC free article] [PubMed] [Google Scholar]
- Riising EM, Comet I, Leblanc B, Wu X, Johansen JV, and Helin K (2014). Gene silencing triggers polycomb repressive complex 2 recruitment to CpG islands genome wide. Mol. Cell 55, 347–360. [DOI] [PubMed] [Google Scholar]
- Robinson JT, Thorvaldsdóttir H, Winckler W, Guttman M, Lander ES, Getz G, and Mesirov JP (2011). Integrative genomics viewer. Nat. Biotechnol 29, 24–26. [DOI] [PMC free article] [PubMed] [Google Scholar]
- Schindelin J, Arganda-Carreras I, Frise E, Kaynig V, Longair M, Pietzsch T, Preibisch S, Rueden C, Saalfeld S, Schmid B, et al. (2012). Fiji: An open-source platform for biological-image analysis. Nat. Methods 9, 676–682. [DOI] [PMC free article] [PubMed] [Google Scholar]
- Schmitges FW, Prusty AB, Faty M, Stützer A, Lingaraju GM, Aiwazian J, Sack R, Hess D, Li L, Zhou S, et al. (2011). Histone methylation by PRC2 is inhibited by active chromatin marks. Mol. Cell 42, 330–341. [DOI] [PubMed] [Google Scholar]
- Schoenfelder S, Sugar R, Dimond A, Javierre BM, Armstrong H, Mifsud B, Dimitrova E, Matheson L, Tavares-Cadete F, Furlan-Magaril M, et al. (2015). Polycomb repressive complex PRC1 spatially constrains the mouse embryonic stem cell genome. Nat. Genet 47, 1179–1186. [DOI] [PMC free article] [PubMed] [Google Scholar]
- Schorderet P, Lonfat N, Darbellay F, Tschopp P, Gitto S, Soshnikova N, and Duboule D (2013). A genetic approach to the recruitment of PRC2 at the HoxD locus. PLoS Genet 9, e1003951. [DOI] [PMC free article] [PubMed] [Google Scholar]
- Shen X, Kim W, Fujiwara Y, Simon MD, Liu Y, Mysliwiec MR, Yuan GC, Lee Y, and Orkin SH (2009). Jumonji modulates polycomb activity and self-renewal versus differentiation of stem cells. Cell 139, 1303–1314. [DOI] [PMC free article] [PubMed] [Google Scholar]
- Simon JA, and Kingston RE (2013). Occupying chromatin: Polycomb mechanisms for getting to genomic targets, stopping transcriptional traffic, and staying put. Mol. Cell 49, 808–824. [DOI] [PMC free article] [PubMed] [Google Scholar]
- Simon MD, and Shokat KM (2012). A method to site-specifically incorporate methyl-lysine analogues into recombinant proteins. Methods Enzymol 512, 57–69. [DOI] [PubMed] [Google Scholar]
- Simon MD, Chu F, Racki LR, de la Cruz CC, Burlingame AL, Panning B, Narlikar GJ, and Shokat KM (2007). The site-specific installation of methyl-lysine analogs into recombinant histones. Cell 128, 1003–1012. [DOI] [PMC free article] [PubMed] [Google Scholar]
- Sing A, Pannell D, Karaiskakis A, Sturgeon K, Djabali M, Ellis J, Lipshitz HD, and Cordes SP (2009). A vertebrate Polycomb response element governs segmentation of the posterior hindbrain. Cell 138, 885–897. [DOI] [PubMed] [Google Scholar]
- Son J, Shen SS, Margueron R, and Reinberg D (2013). Nucleosome-binding activities within JARID2 and EZH1 regulate the function of PRC2 on chromatin. Genes Dev. 27, 2663–2677. [DOI] [PMC free article] [PubMed] [Google Scholar]
- Strom AR, Emelyanov AV, Mir M, Fyodorov DV, Darzacq X, and Karpen GH (2017). Phase separation drives heterochromatin domain formation. Nature 547, 241–245. [DOI] [PMC free article] [PubMed] [Google Scholar]
- Takahashi T, Lord B, Schulze PC, Fryer RM, Sarang SS, Gullans SR, and Lee RT (2003). Ascorbic acid enhances differentiation of embryonic stem cells into cardiac myocytes. Circulation 107, 1912–1916. [DOI] [PubMed] [Google Scholar]
- van de Werken HJ, Landan G, Holwerda SJ, Hoichman M, Klous P, Chachik R, Splinter E, Valdes-Quezada C, Oz Y, Bouwman BA, et al. (2012). Robust 4C-seq data analysis to screen for regulatory DNA interactions. Nat. Methods 9, 969–972. [DOI] [PubMed] [Google Scholar]
- Vieux-Rochas M, Fabre PJ, Leleu M, Duboule D, and Noordermeer D (2015). Clustering of mammalian Hox genes with other H3K27me3 targets within an active nuclear domain. Proc. Natl. Acad. Sci. USA 112, 4672–4677. [DOI] [PMC free article] [PubMed] [Google Scholar]
- Woo CJ, Kharchenko PV, Daheron L, Park PJ, and Kingston RE (2010). A region of the human HOXD cluster that confers polycomb-group responsiveness. Cell 140, 99–110. [DOI] [PMC free article] [PubMed] [Google Scholar]
- Yuan W, Xu M, Huang C, Liu N, Chen S, and Zhu B (2011). H3K36 methylation antagonizes PRC2-mediated H3K27 methylation. J. Biol. Chem 286, 7983–7989. [DOI] [PMC free article] [PubMed] [Google Scholar]
- Yuan ZF, Lin S, Molden RC, Cao XJ, Bhanu NV, Wang X, Sidoli S, Liu S, and Garcia BA (2015). EpiProfile quantifies histone peptides with modifications by extracting retention time and intensity in high-resolution mass spectra. Mol. Cell. Proteomics 14, 1696–1707. [DOI] [PMC free article] [PubMed] [Google Scholar]
- Yun M, Ruan C, Huh JW, and Li B (2012). Reconstitution of modified chromatin templates for in vitro functional assays. Methods Mol. Biol 833, 237–253. [DOI] [PMC free article] [PubMed] [Google Scholar]
- Zhang Z, and Lutz B (2002). Cre recombinase-mediated inversion using lox66 and lox71: Method to introduce conditional point mutations into the CREB-binding protein. Nucleic Acids Res 30, e90. [DOI] [PMC free article] [PubMed] [Google Scholar]
- Zheng Y, Sweet SMM, Popovic R, Martinez-Garcia E, Tipton JD, Thomas PM, Licht JD, and Kelleher NL (2012). Total kinetic analysis reveals how combinatorial methylation patterns are established on lysines 27 and 36 of histone H3. Proc. Natl. Acad. Sci. USA 109, 13549–13554. [DOI] [PMC free article] [PubMed] [Google Scholar]
- Zheng H, Huang B, Zhang B, Xiang Y, Du Z, Xu Q, Li Y, Wang Q, Ma J, Peng X, et al. (2016). Resetting epigenetic memory by reprogramming of histone modifications in mammals. Mol. Cell 63, 1066–1079. [DOI] [PubMed] [Google Scholar]
- Zhu LJ, Gazin C, Lawson ND, Pagès H, Lin SM, Lapointe DS, and Green MR (2010). ChIPpeakAnno: A Bioconductor package to annotate ChIP-seq and ChIP-chip data. BMC Bioinformatics 11, 237. [DOI] [PMC free article] [PubMed] [Google Scholar]
Associated Data
This section collects any data citations, data availability statements, or supplementary materials included in this article.
Supplementary Materials
Data Availability Statement
The accession number for the sequencing data reported in this paper is GEO: GSE94431. Source data for gel images and graphs can be found in Mendeley Data: https://data.mendeley.com/datasets/fzht5rdb4s/1.