Abstract
Purpose:
Coronary x-ray computed tomography angiography (CCTA) continues to develop as a non-invasive method for the assessment of coronary vessel geometry and the identification of physiologically significant lesions. The uncertainty of quantitative lesion diameter measurement due to limited spatial resolution and vessel motion reduces the accuracy of CCTA diagnoses. In this paper, we introduce a new technique called CT-number-Calibrated Diameter to improve the accuracy of the vessel and stenosis diameter measurements with CCTA.
Methods:
A calibration phantom containing cylindrical holes (diameters spanning from 0.8mm through 4.0mm) capturing the range of diameters found in human coronary vessels was 3D printed. We also printed a human stenosis phantom with 17 tubular channels having the geometry of lesions derived from patient data. We acquired CT scans of the two phantoms with 7 different imaging protocols. Calibration curves relating vessel intraluminal maximum voxel value (maximum CT number of a voxel, described in Hounsfield Units, HU) to true diameter, and full-width-at-half maximum (FWHM) to true diameter were constructed for each CCTA protocol. In addition, we acquired scans with a small constant motion (15mm/s) and used a motion correction reconstruction (Snapshot Freeze) algorithm to correct motion artifacts. We applied our technique to measure the lesion diameter in the 17 lesions in the stenosis phantom and compared the performance of CT-number-Calibrated Diameter to the ground truth diameter and a FWHM estimate.
Results:
In all cases, vessel intraluminal maximum voxel value vs. diameter was found to have a simple functional form based on the 2D point spread function yielding a constant maximum voxel value region above a cutoff diameter, and a decreasing maximum voxel value vs. decreasing diameter below a cutoff diameter. After normalization, focal spot size and reconstruction kernel were the principal determinants of cutoff diameter and the rate of maximum voxel value reduction vs decreasing diameter. The small constant motion had a significant effect on the CT number calibration; however, the motion-correction algorithm returned the maximum voxel value vs. diameter curve to that of stationary vessels. The CT number Calibration technique showed better performance than FWHM estimation of diameter, yielding a high accuracy in the tested range (0.8 mm through 2.5mm). We found a strong linear correlation between the smallest diameter in each of 17 lesions measured by CT-number-Calibrated Diameter (DC) and ground truth diameter (Dgt), (DC=0.951*Dgt +0.023mm, r=0.998 with a slope very close to 1.0 and intercept very close to 0mm.
Conclusions:
CT-number-Calibrated Diameter is an effective method to enhance the accuracy of the estimate of small vessel diameters and degree of coronary stenosis in CCTA.
Keywords: coronary CT angiography, coronary stenosis quantification, vessel motion
1. INTRODUCTION
Since the introduction of 64-detector row CT scanners, coronary CT angiography (CCTA) has emerged as a promising non-invasive method for direct visualization of coronary artery disease (CAD)1, 2 and demonstrated an excellent ability to rule out CAD due to its high negative predictive value3. However, even with new CCTA technologies accurate quantification of lesion diameter remains challenging because the vessel diameter of severe lesions (>70% stenosis, or < 2mm)4 often approaches the limit of the scanner resolution. The uncertainty of lesion diameter reduces the specificity of CCTA diagnoses of significant coronary disease5. Furthermore, new non-invasive techniques for estimating disease severity such as FFRCT6 (FFR defined as fractional flow reserve) require highly accurate vessel geometry in order to obtain accurate coronary blood flow simulations7. In this paper, we introduce a new technique to improve the accuracy of vessel diameter measurements with CCTA called CT-number-Calibrated Diameter (DC).
We define CT number of a voxel (described in Hounsfield Unit, HU) as the normalized linear attenuation coefficient and “intraluminal maximum voxel value” (abbreviation as IMVV in the paper) as the maximum voxel CT number found inside the vessel lumen. Our CT-number-Calibrated Diameter technique is motivated by a simulation study done by Contijoch et al.8 in which they show that the IMVV does not depend on vessel size for large vessels but decreases rapidly with decreasing vessel diameter for small vessels and small diameter stenoses. This reduction has a straightforward explanation using the point spread function of the imaging system9, 10, and in this paper we derive the mathematical function of this reduction. They also demonstrated that the full width half maximum (FWHM) estimate of the vessel, DFWHM, which is commonly used in vessel segmentation, approximates the true vessel diameter for large vessels, but can significantly overestimate vessel diameter for small vessels.
Based on the two characteristics of small vessel stated above, we have designed a CT-number-Calibrated diameter technique to estimate vessel diameter. The algorithm uses a different process in each of two vessel size domains: (1) for large vessels with IMVV that is independent of the vessel size, the FWHM estimate of vessel diameter is used, and (2) for small vessels with IMVV that is dependent on the vessel size, the algorithm maps the IMVV to vessel diameter directly using a calibration curve measured for each imaging and reconstruction protocol.
In this paper, we validate the CT-number-Calibrated Diameter estimation by imaging anthropomorphic phantoms that are both stationary and moving with a clinical system. The results demonstrate that this technique can yield high accuracy in vessel diameter measurement.
2. MATERIALS AND METHODS
2.1. Hole phantom
A hole phantom was 3D-printed using a Form 2 stereolithography system with clear photopolymer resin (Formlabs Inc, Somerville, MA) with 24 cylindrical holes in a cylindrical disk of diameter 8.5-cm and height 2.5-cm. The diameter of the cylindrical holes was programmed to span 4.0 mm through 2.2 mm with 0.2-mm intervals, and 2.2 mm through 0.8 mm with 0.1-mm intervals (Figure 1A). This array of holes captured the range of diameters found in human coronary vessels. To obtain the ground truth measurement of the hole diameters we scanned the phantom using a benchtop high-resolution imaging system consisting of a cone-beam CT test bench using a Paxscan 4343CB flat-panel detector and Rad-94 x-ray tube (Varex, Salt Lake City). The x-ray beam was 100kVp at 10mA and 40 ms/projection, which yielded an estimated 8.5×10⁵ (unattenuated) photons/pixel. The system geometry was 110 cm source-to-detector and 83 cm source-to-axis with 360 projections at 1-degree increments. Projections were 1536 × 1536 with 0.278 mm square, binned pixels. Reconstructions were performed using a 600 × 600 × 320 volume with 0.2 mm cubic voxels. The reconstruction algorithm used a penalized-likelihood objective with quadratic penalty and regularization parameter β = 90000, and was solved using 100 separable paraboloidal surrogates iterations with 10 ordered subsets11. We tested the accuracy of the FWHM estimate (elaborated in section 2.4.2) in these high-resolution cone-beam CT images using a machine drilled hole phantom ground truth size of which was confirmed (Figure 1B). This machine drilled phantom (UCSD Campus Research Machine Shop, La Jolla) was made by computational numerical control (CNC) drilling process with an accuracy of ±0.01mm. We compared the FWHM estimate from the bench top system with the ground truth, concluding that FWHM accurately measured hole diameters larger than ~0.8mm. (Figure 1C). Thus, FWHM estimates from high-resolution cone-beam CT images were used to confirm the correct printed diameter of all holes larger than 0.8mm in 3D printed phantoms used in this study.
Figure 1:
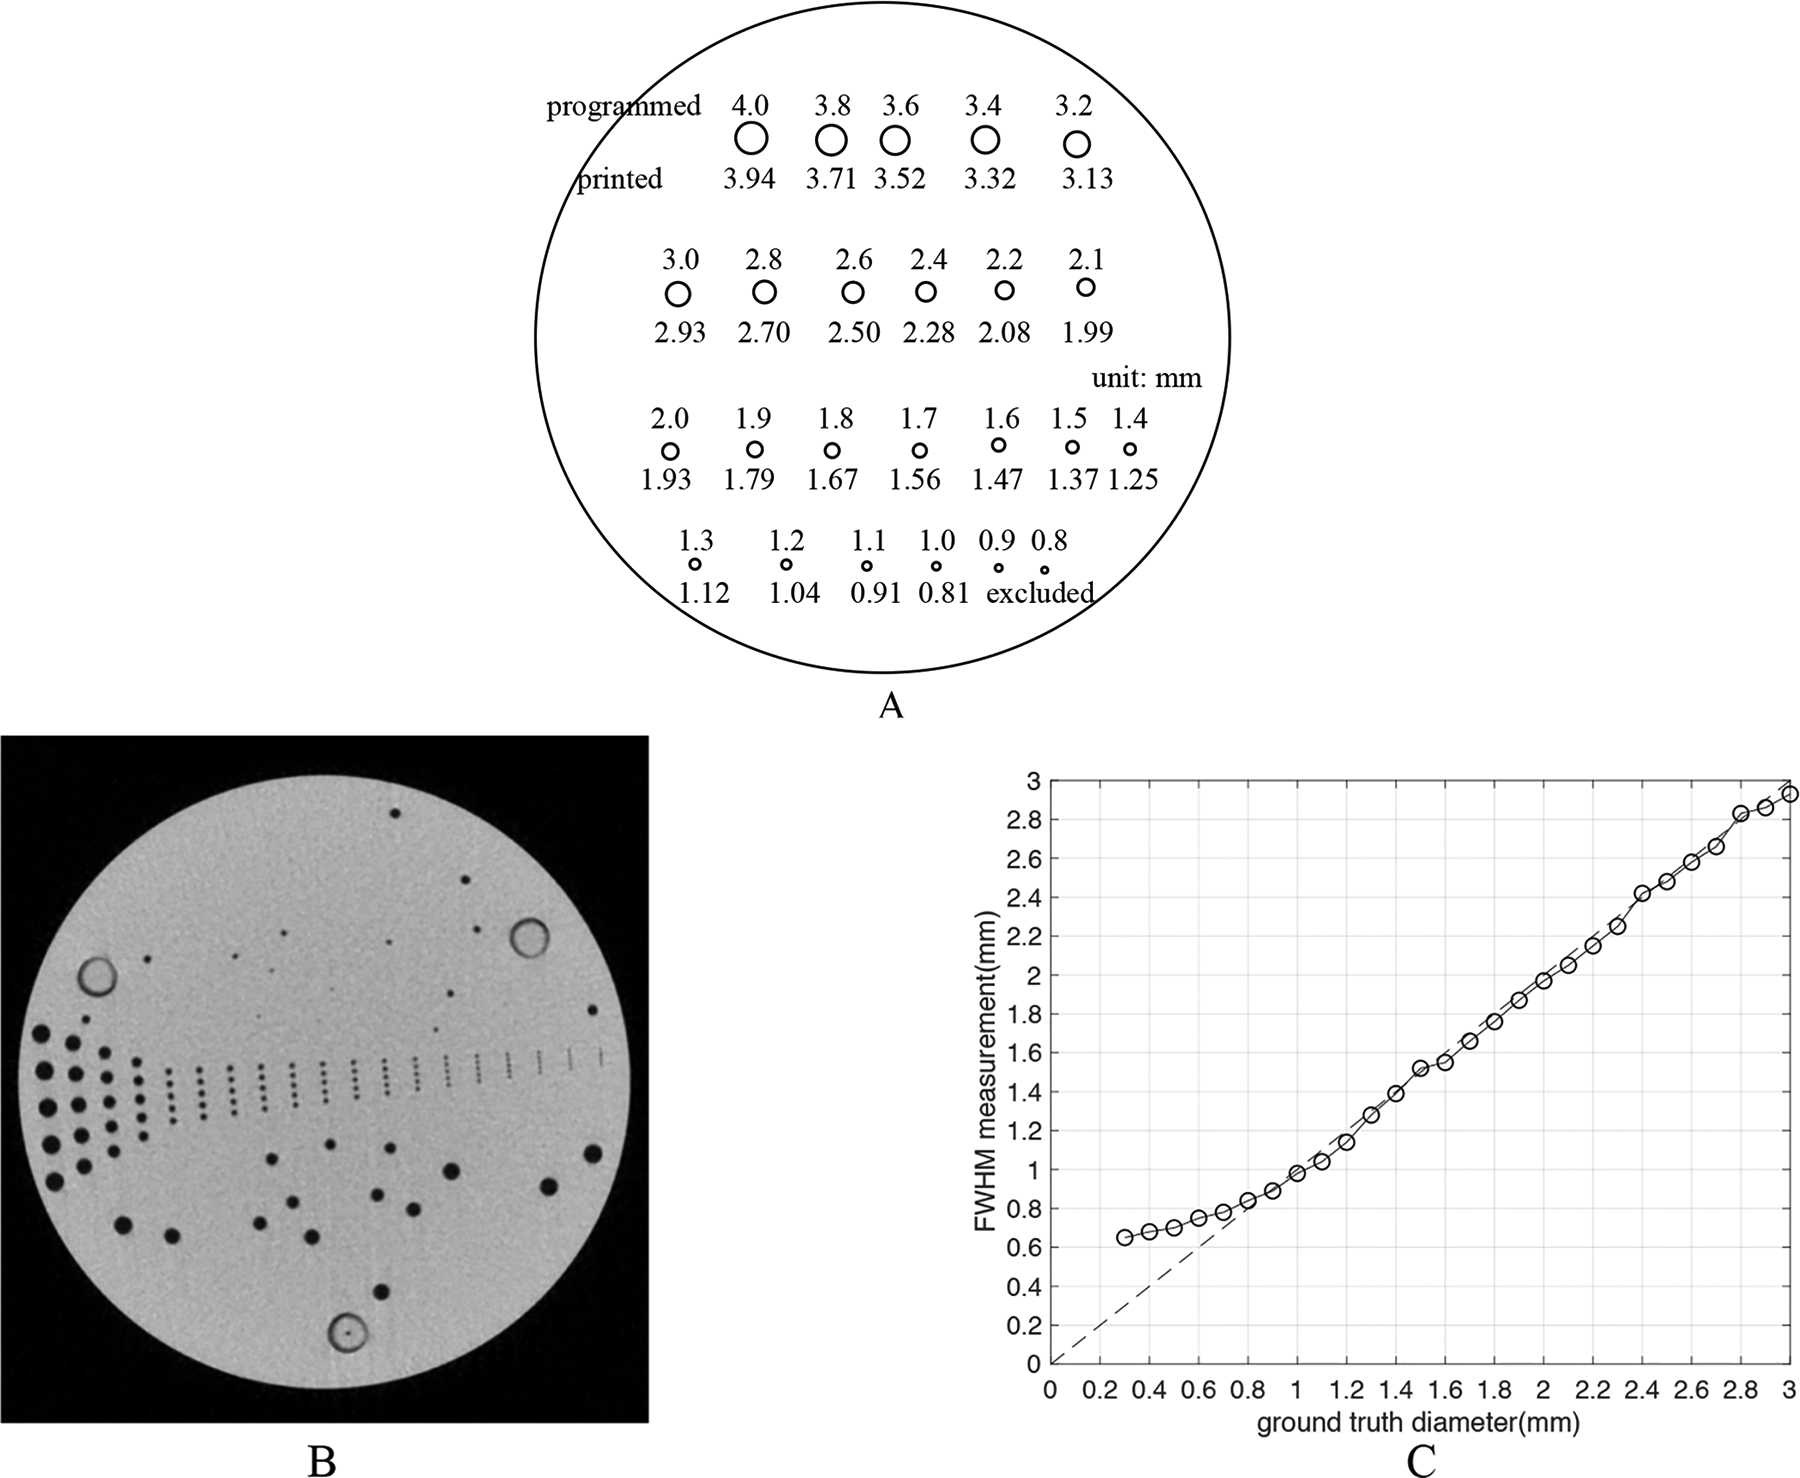
(A) The 3D printed hole phantom. The phantom is a cylinder of photopolymer resin with 24 cylindrical holes whose programmed diameters range from 0.8mm to 4.0mm. The correct printed diameter was measured to be slightly smaller than programmed. The HU of the resin was ~100 as the background of CT images, and the holes were filled with 10% iodixanol mixed with water giving a Hounsfield Unit value of approximately 1000 in the 3~4mm holes for 100kVp images. (B) A high-resolution cone-beam CT image of. the machine drilled hole phantom. This phantom has CNC drilled holes from 0.3mm to 3mm with a precision of ±0.01mm. (C) The measured accuracy of FWHM in high-resolution cone-beam CT images as tested by the machine drilled hole phantom. We compared the ground truth diameter in the phantom and the FWHM estimate of diameters. The curve lifts off the line of identity around 0.8mm, showing that FWHM estimate can accurately measure diameter larger than ~0.8mm using images from the benchtop system.
2.2. Patient derived vessel stenosis phantom
Eight high quality 3D meshes of human coronary anatomy were created by automated segmentation of CCTA images with manual correction. Initial automated coronary segmentations were generated using a deep learning technique12; these automated segmentations were then visually assessed and edited as necessary. Surface reconstruction was then performed to generate surface meshes from these segmentations. We isolated 18 lesions from the coronary tree meshes using Blender13. The ground truth sizes for the printed coronary vessel stenosis were measured from high-resolution cone-beam CT images mentioned in section 2.1. We excluded one lesion from the dataset since it contained a minimum diameter less than 0.8mm. A vessel stenosis phantom was 3D printed with resin to be a 2.5cm high disk with 18 tubular channels that represent the vessel lumen having the exact geometry of the 18 lesions (Figure 2). About Six lesions for each degree of severity (severe, moderate and mild) were included as shown in Figure 2E.
Figure 2:
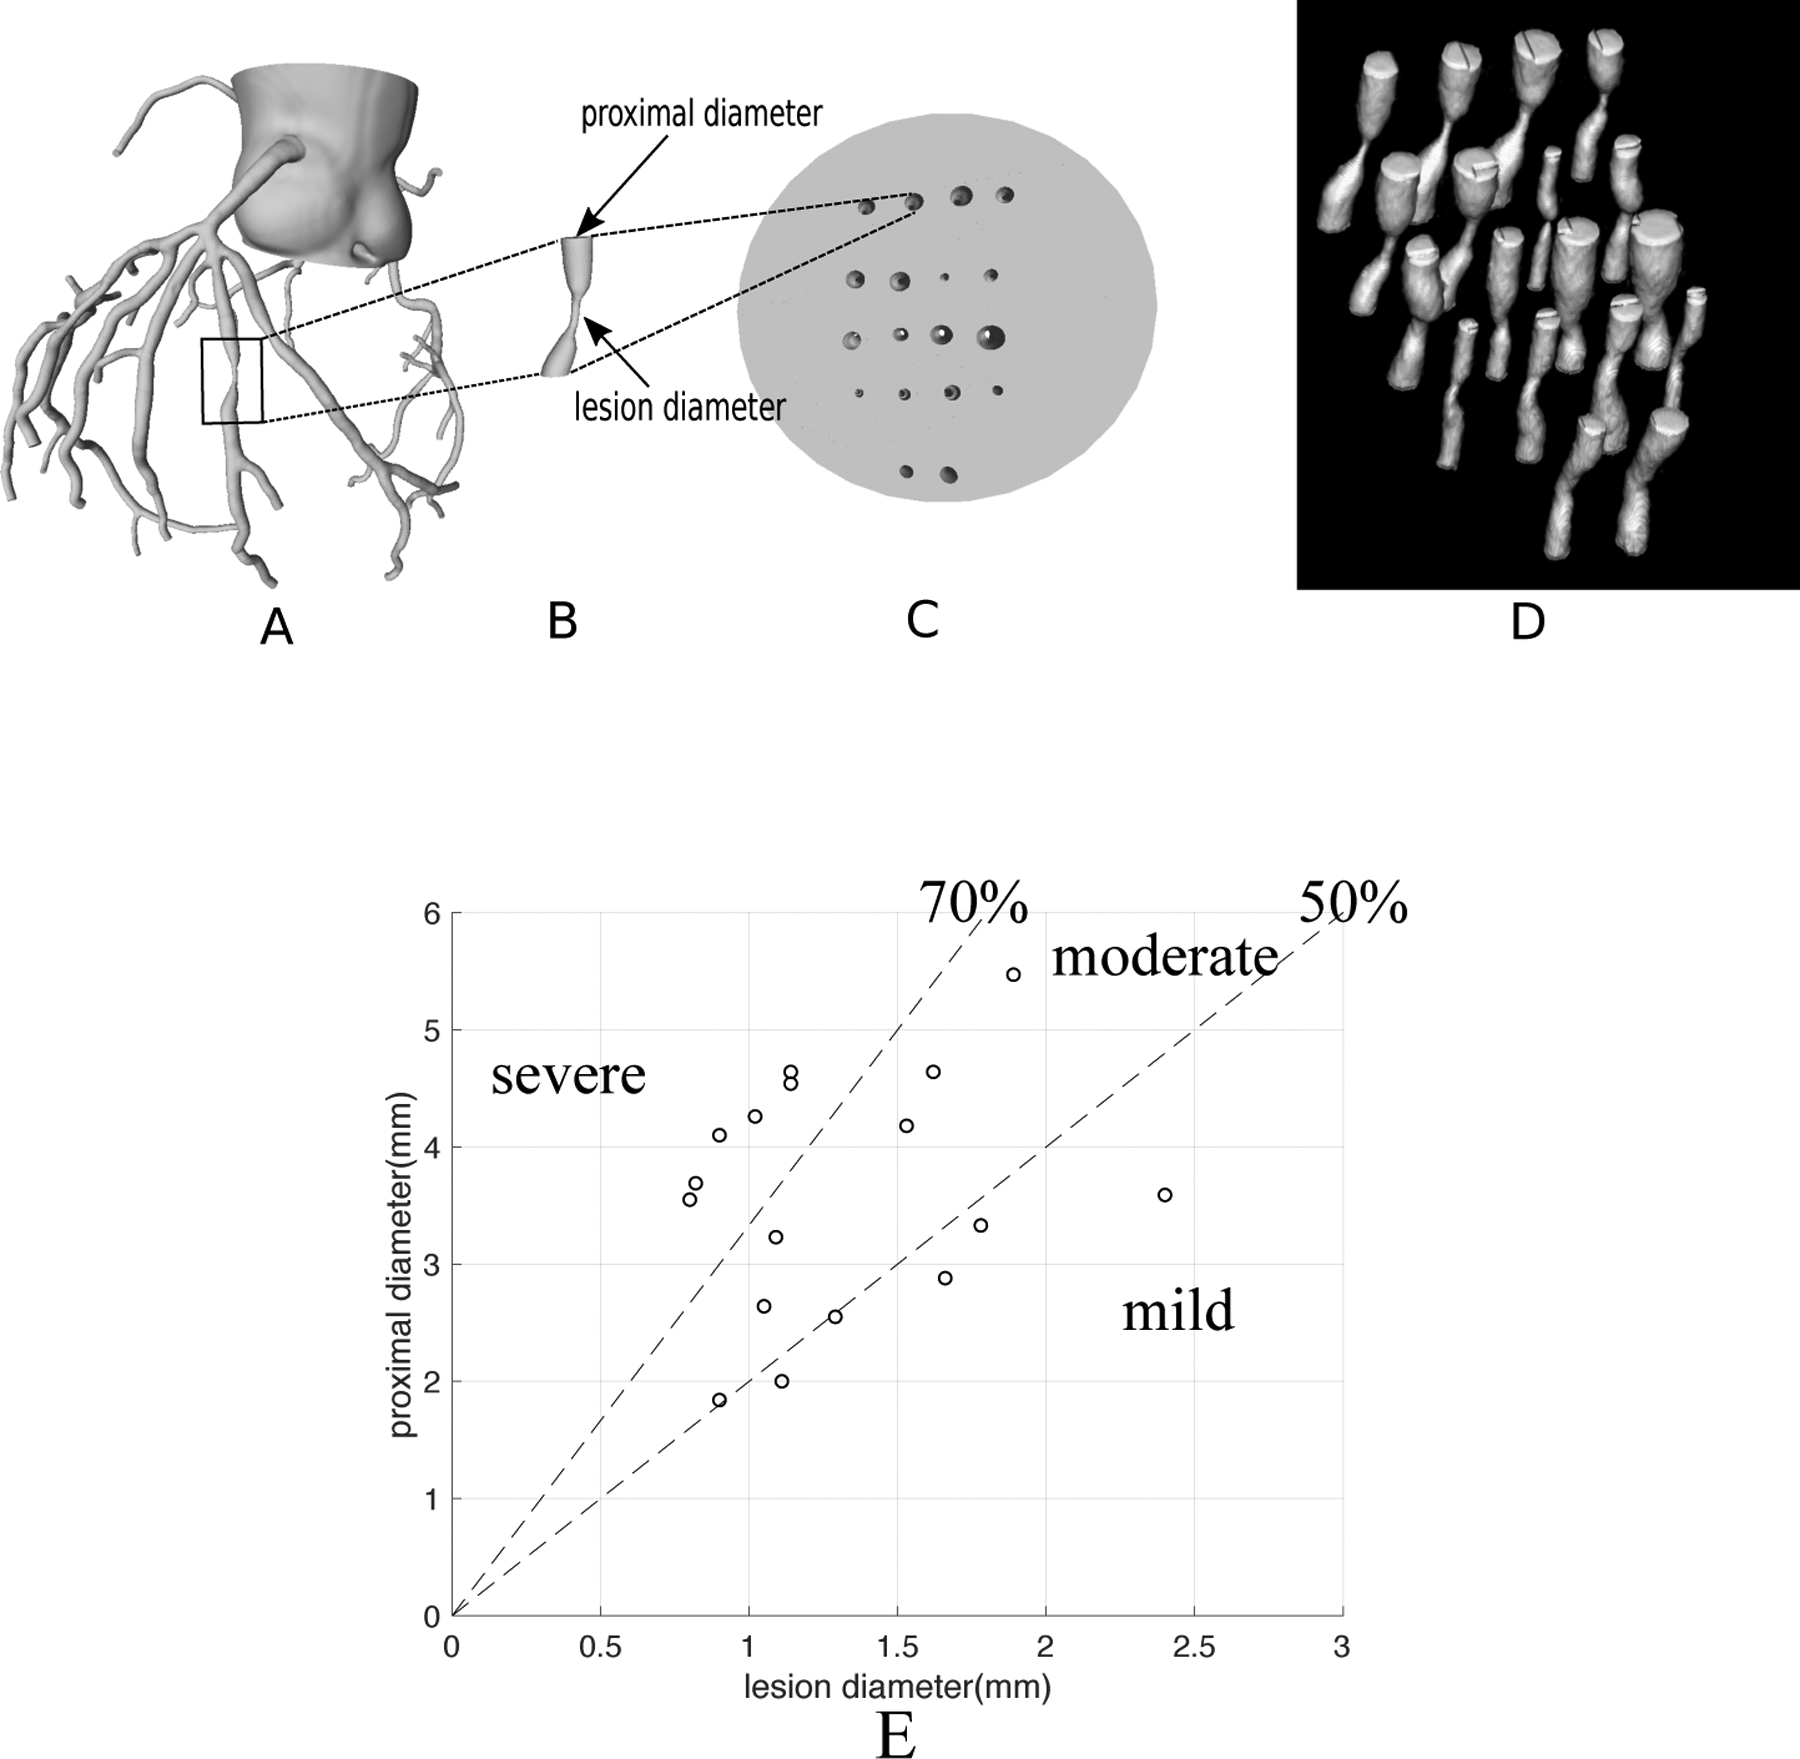
A vessel stenosis phantom. (A) 3D mesh of a human coronary tree derived from patient CT data. (B) isolation of one lesion from the coronary tree using Blender; the “proximal diameter” and “lesion diameter” are labeled. (C) A 3D-printed vessel stenosis phantom as a disk with 18 tubular channels having the exact geometry of the 18 lesions. The light grey represents the resin in the disk and the holes represent the vessel lumina. (D) CT 3D rendered image of the vessel stenosis phantom. (E) Distribution of severity and size of the 17 lesions shown as the relationship between “proximal diameter” and “lesion diameter” as shown in Fig 2B; there are 6 severe, 6 moderate and 5 mild lesions. The smallest lesion diameter is 0.8mm and the largest diameter is 2.4mm.
2.3. CT imaging protocols
The channels in both the 3D printed hole phantom and the vessel stenosis phantom were filled with 10% iodixanol mixed with water to approximate the CT number of a coronary artery. Each phantom was inserted into a sealed plastic bag with additional contrast solution. Two phantoms were placed end to end inside a tissue equivalent Extension Ring (QRM GmBh, Extension Ring L). Two phantoms placed end to end were scanned together on a GE Revolution CT with clinical coronary protocols: common scanner settings included: axial scan, gantry rotation time 280ms, exposure time 162ms, FOV of 20cm, with a 512×512 matrix resulting in an x-y pixel size of 0.391 × 0.391mm, 256 contiguous slices with a slice thickness of 0.625mm. All reconstructions were performed with ASiR-V=50% to reproduce what is used clinically for CCTA at our institution. Seven different CT acquisitions were obtained with the same common settings stated above but different tube energies, tube currents, focal spot sizes and reconstruction kernels (see Table 1). In order to create a high SNR image for examining the nature of the CT number calibration, 5 equivalent acquisitions were obtained for each set of parameters and the 5 images were averaged to obtain the final image (standard deviation = ~10HU, measured in the resin as the background of the image). For examining the ability of the CT number calibration technique to obtain accurate diameters in the morphological stenosis phantom, single images without averaging were also used (standard deviation ~ 25HU). If not specifically noted, the images mentioned in the paper are the averaged images with higher SNR.
Table 1:
Seven sets of CT parameters used in the CT examinations. All sets used the same common settings for clinical coronary protocol stated in the body of the text. Only the listed parameters in the table columns were varied among 7 sets. All reconstructions were performed with the standard GE reconstruction software with ASiR-V=50%. Focal spot size = 1.0 × 0.7mm for Small, and 1.6 × 1.2mm for Large, and 2.0 × 2.1mm for Extra Large.
| Set No. | Tube energy (kV) | Tube current (mA) | focal spot size (mm) | Reconstruction kernel | CTDIvol (mGy) | Marker in the plot |
|---|---|---|---|---|---|---|
| 1 | 100 | 640 | Large(L) | Standard(std) | 4.69 | □ |
| 2 | 100 | 640 | Large(L) | Bone | 4.69 | + |
| 3 | 100 | 645 | Extra Large(XL) | Bone | 4.60 | * |
| 4 | 100 | 420 | Small(S) | Bone | 3.11 | × |
| 5 | 120 | 350 | Small(S) | Standard(std) | 4.12 | ◇ |
| 6 | 100 | 420 | Small(S) | Standard(std) | 3.11 | △ |
| 7 | 80 | 580 | Small(S) | Standard(std) | 2.11 | ◁ |
2.3.1. CT imaging during phantom motion
A motorized platform using a Thorlabs NRT100 stepper motor (Thorlabs, Newton NJ) moved the entire phantom along the horizontal “left-right” axis of the scanner, with a constant velocity of 15mm/s simulating slow coronary vessel motion during diastasis8, 14. CT data was acquired with 120kV, 350mA, 280ms rotation, small spot size, and standard reconstruction kernel, with ASiR-V = 50%; a single acquisition was used for analysis, no averaging was done. We then implemented a post processing motion-correction algorithm (Snapshot Freeze; GE Healthcare)15–17 on the motion corrupted images to yield a set of corrected images. Analysis of the IMVV was performed on the corrected and uncorrected images.
2.4. Creation of calibration curves from the 3D printed hole phantom
2.4.1. Measurement of vessel intraluminal maximum voxel value - IMVV
The vessel intraluminal maximum voxel value of each cylindrical hole was measured as the highest CT number of a single voxel within a 4mm × 4mm ROI symmetrically positioned around the center of the hole in a DICOM image processing application (OsiriX).
2.4.2. Full Width at Half Maximum Determination, DFWHM
To measure the FWHM diameter of each cylindrical hole, the FWHM region of the hole was identified as the boundary within which all voxel values were greater than 50% of the maximum voxel value in the ROI. The diameter was calculated as the average of the major and minor axis of an ellipse fit to the FWHM boundary contour and yielded the FWHM estimate of the vessel, DFWHM. The IMVV and the DFWHM were calculated for each cylindrical hole in hole phantom at 10 slices separated by 1.25 mm (every other slice in the 3D stack), and mean values were reported to plot calibration curves.
2.4.3. Calibrations curves from 3D printed hole phantom
2.4.3.1. Theoretical derivation of CT number calibration curve
The IMVV for each circular hole in the phantom representing circular vessel with true radius R (diameter D = 2R) is equal to the peak value when a circular vessel with radius R is convolved with the two-dimensional (2D) isotropic Gaussian point spread function (PSF).
The PSF can be expressed as a normalized Gaussian function in polar coordinates:
| (Equation 1) |
where r is the distance of a point to the center of Gaussian, σ is the standard deviation determined by the spatial resolution of the imaging system and is the normalizing constant. The peak value of the convolution of a disk of radius R with the PSF is equal to the volume under the 2D PSF curve within radius R; thus, equal to the polar integral of Equation 1 from r=0 to r=R:
| (Equation 2) |
Note that Io and σ are constants representing the maximum voxel value of a large vessel in the proximal section and the standard deviation of PSF respectively. Comparing Equation 1 and 2, we conclude that the theoretical normalized CT number calibration curve is IMVV(R)/Io = 1 − k×PSF, where k is 2πσ2.
2.4.3.2. Empirical calibration curves
For each set of CT parameters in Table 1, we generated the empirical CT number calibration curve IMVV(R) (Figure 4, 5 and 6) by measuring the corresponding IMVV for each hole size in the hole phantom. We compared the theoretical and empirical curves for the same CT acquisition (Figure 5) to demonstrate that any CT number calibration curve can be characterized by the standard deviation σ of the 2D Gaussian PSF. The relation between σ and the vessel diameter that has a 50% drop of the constant IMVV of a large vessel in the proximal section, D50, is as follows:
| (Equation 3) |
Figure 4:
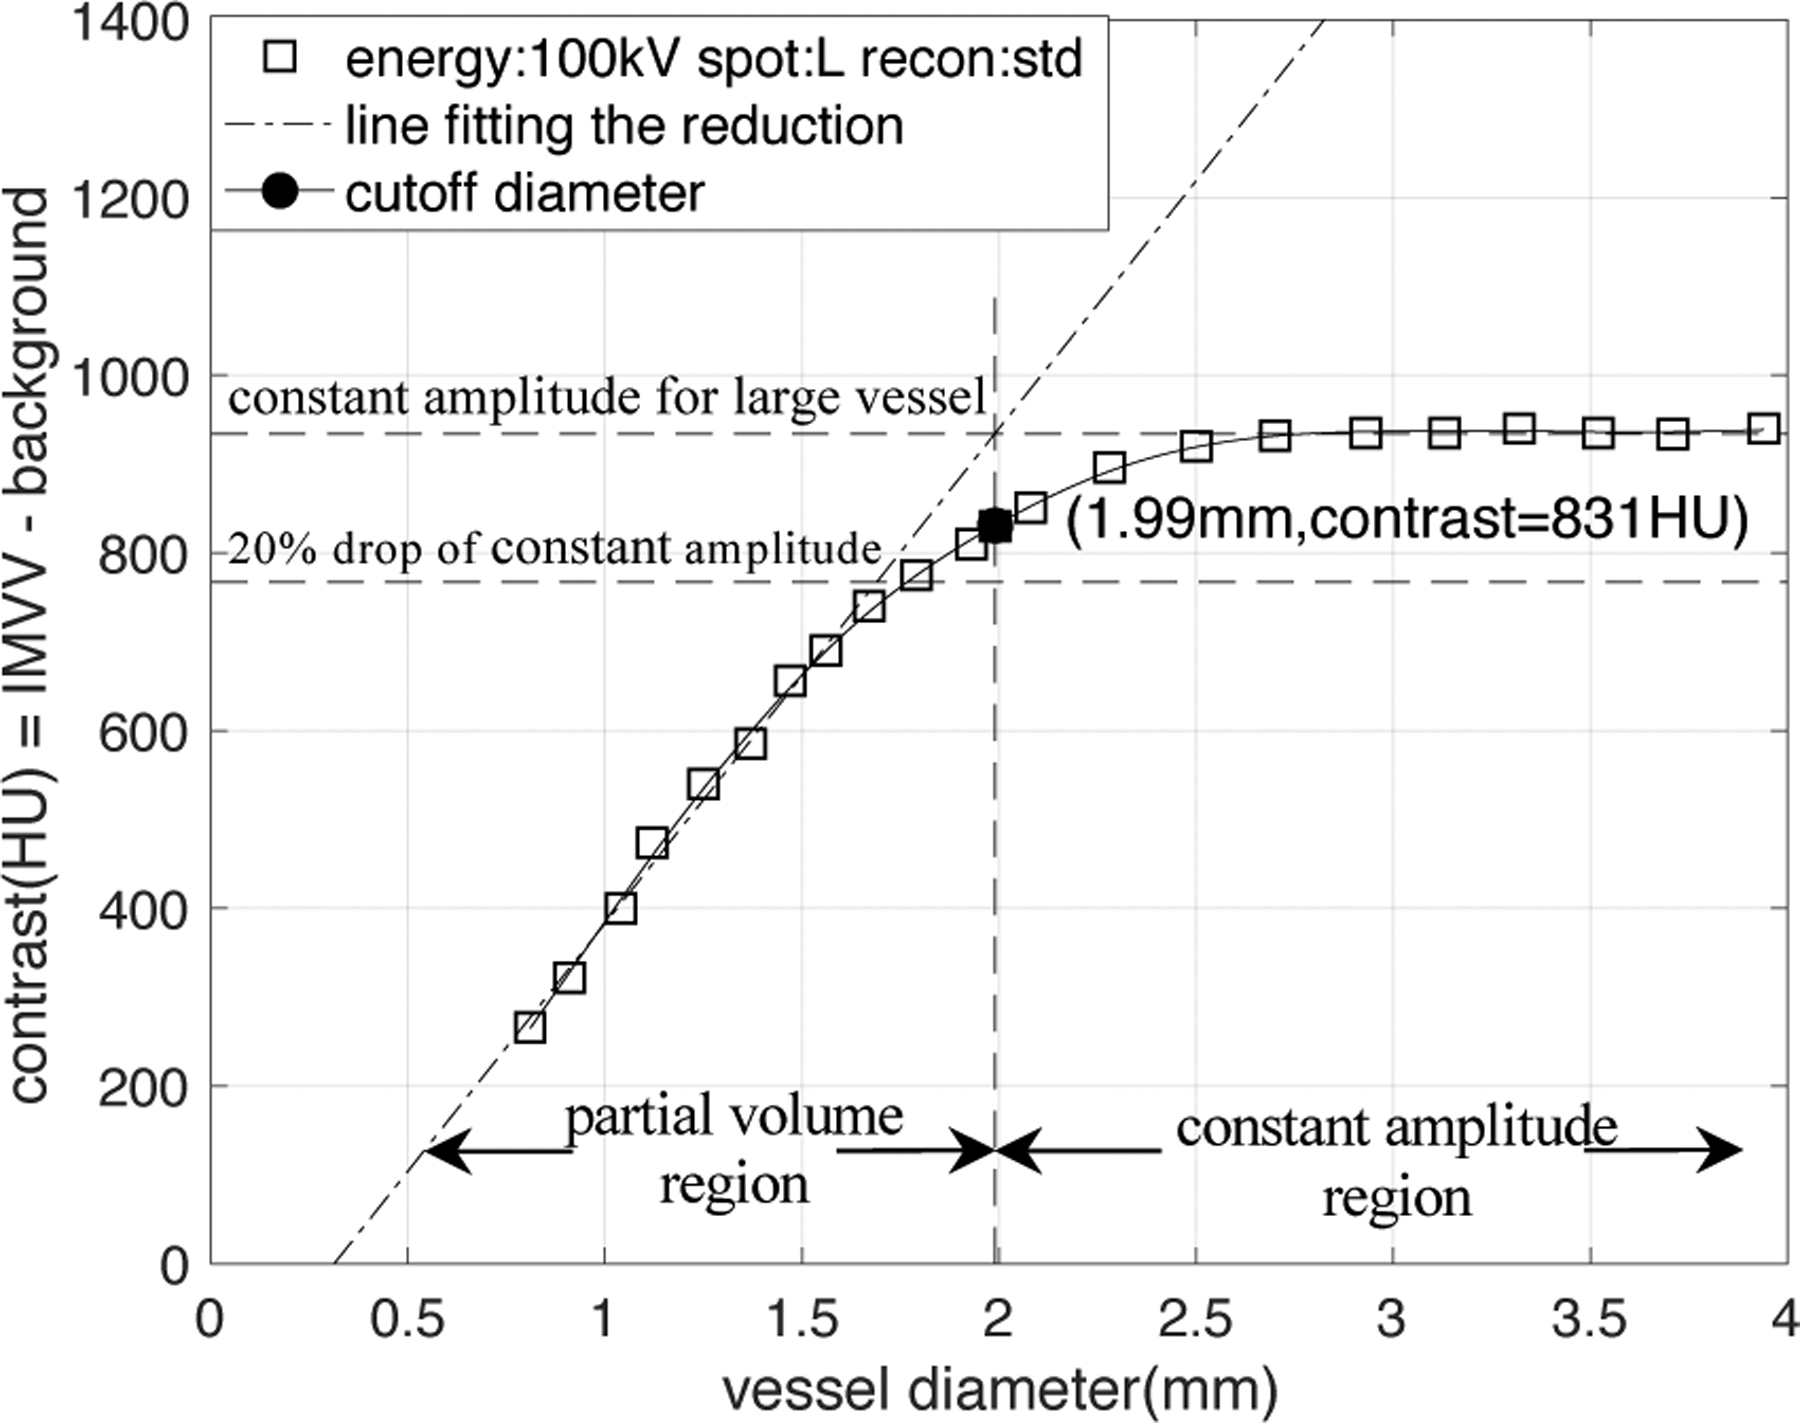
An example of the empirical CT number calibration curve obtained from the CT data of the hole phantom. The CT acquisition parameter is the 1st set in Table 1.
Figure 5:
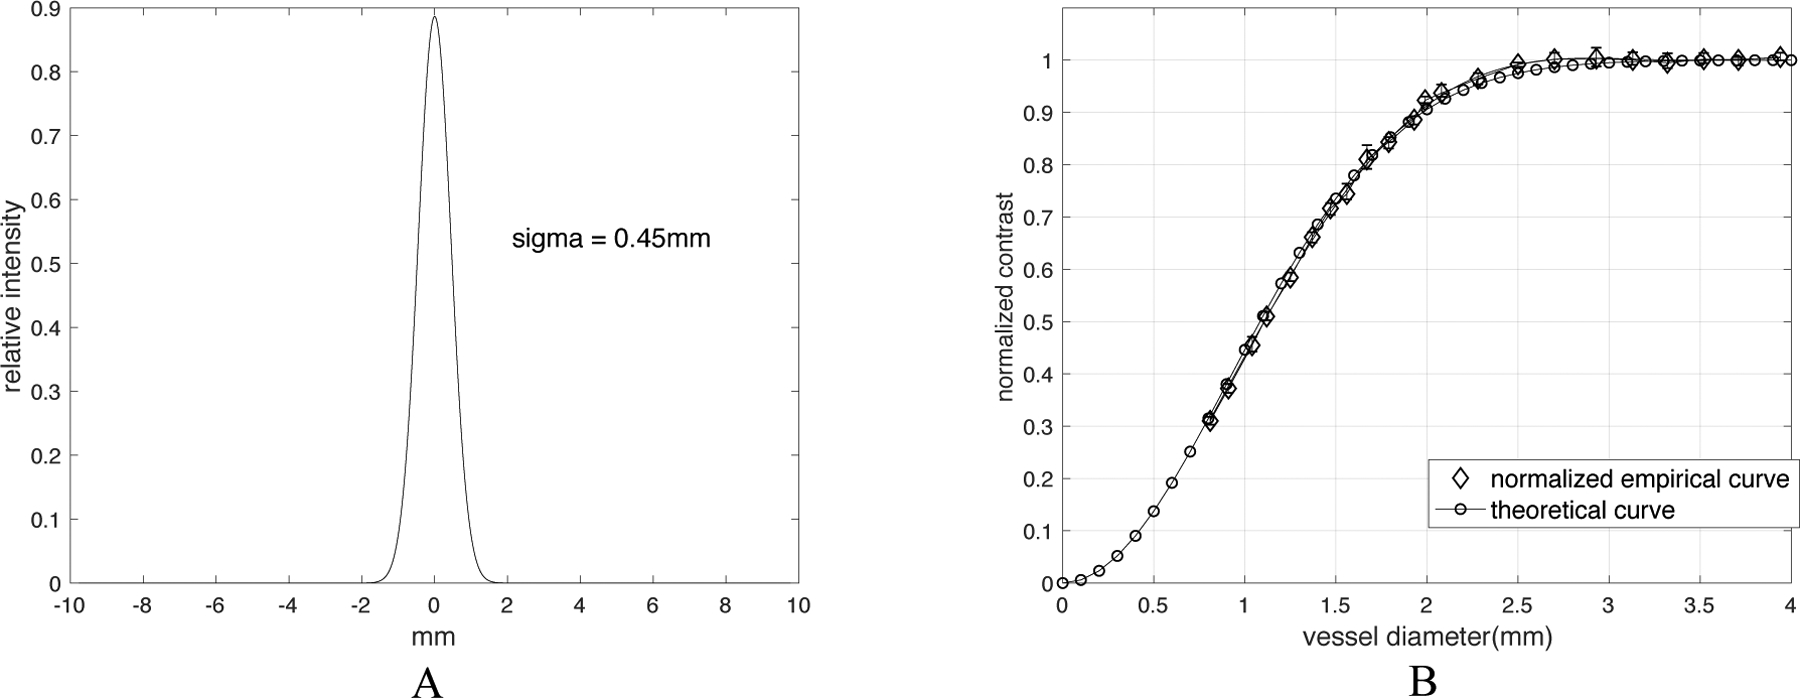
Comparison of theoretical and empirical CT number calibration curve. (A) is the normalized PSF of the 5th CT acquisition (120kVp, small focal spot, standard reconstruction). The standard deviation σ is found as 0.45mm. Note: while we only plot it in one dimension, this is actually a two-dimensional isotropic PSF. (B) shows the comparison of the measured values with predicted values from Equation 2 with σ = 0.45mm. The error bars from 5 equivalent and repeated scans are shown in the empirical curve to show the robustness.
Figure 6:
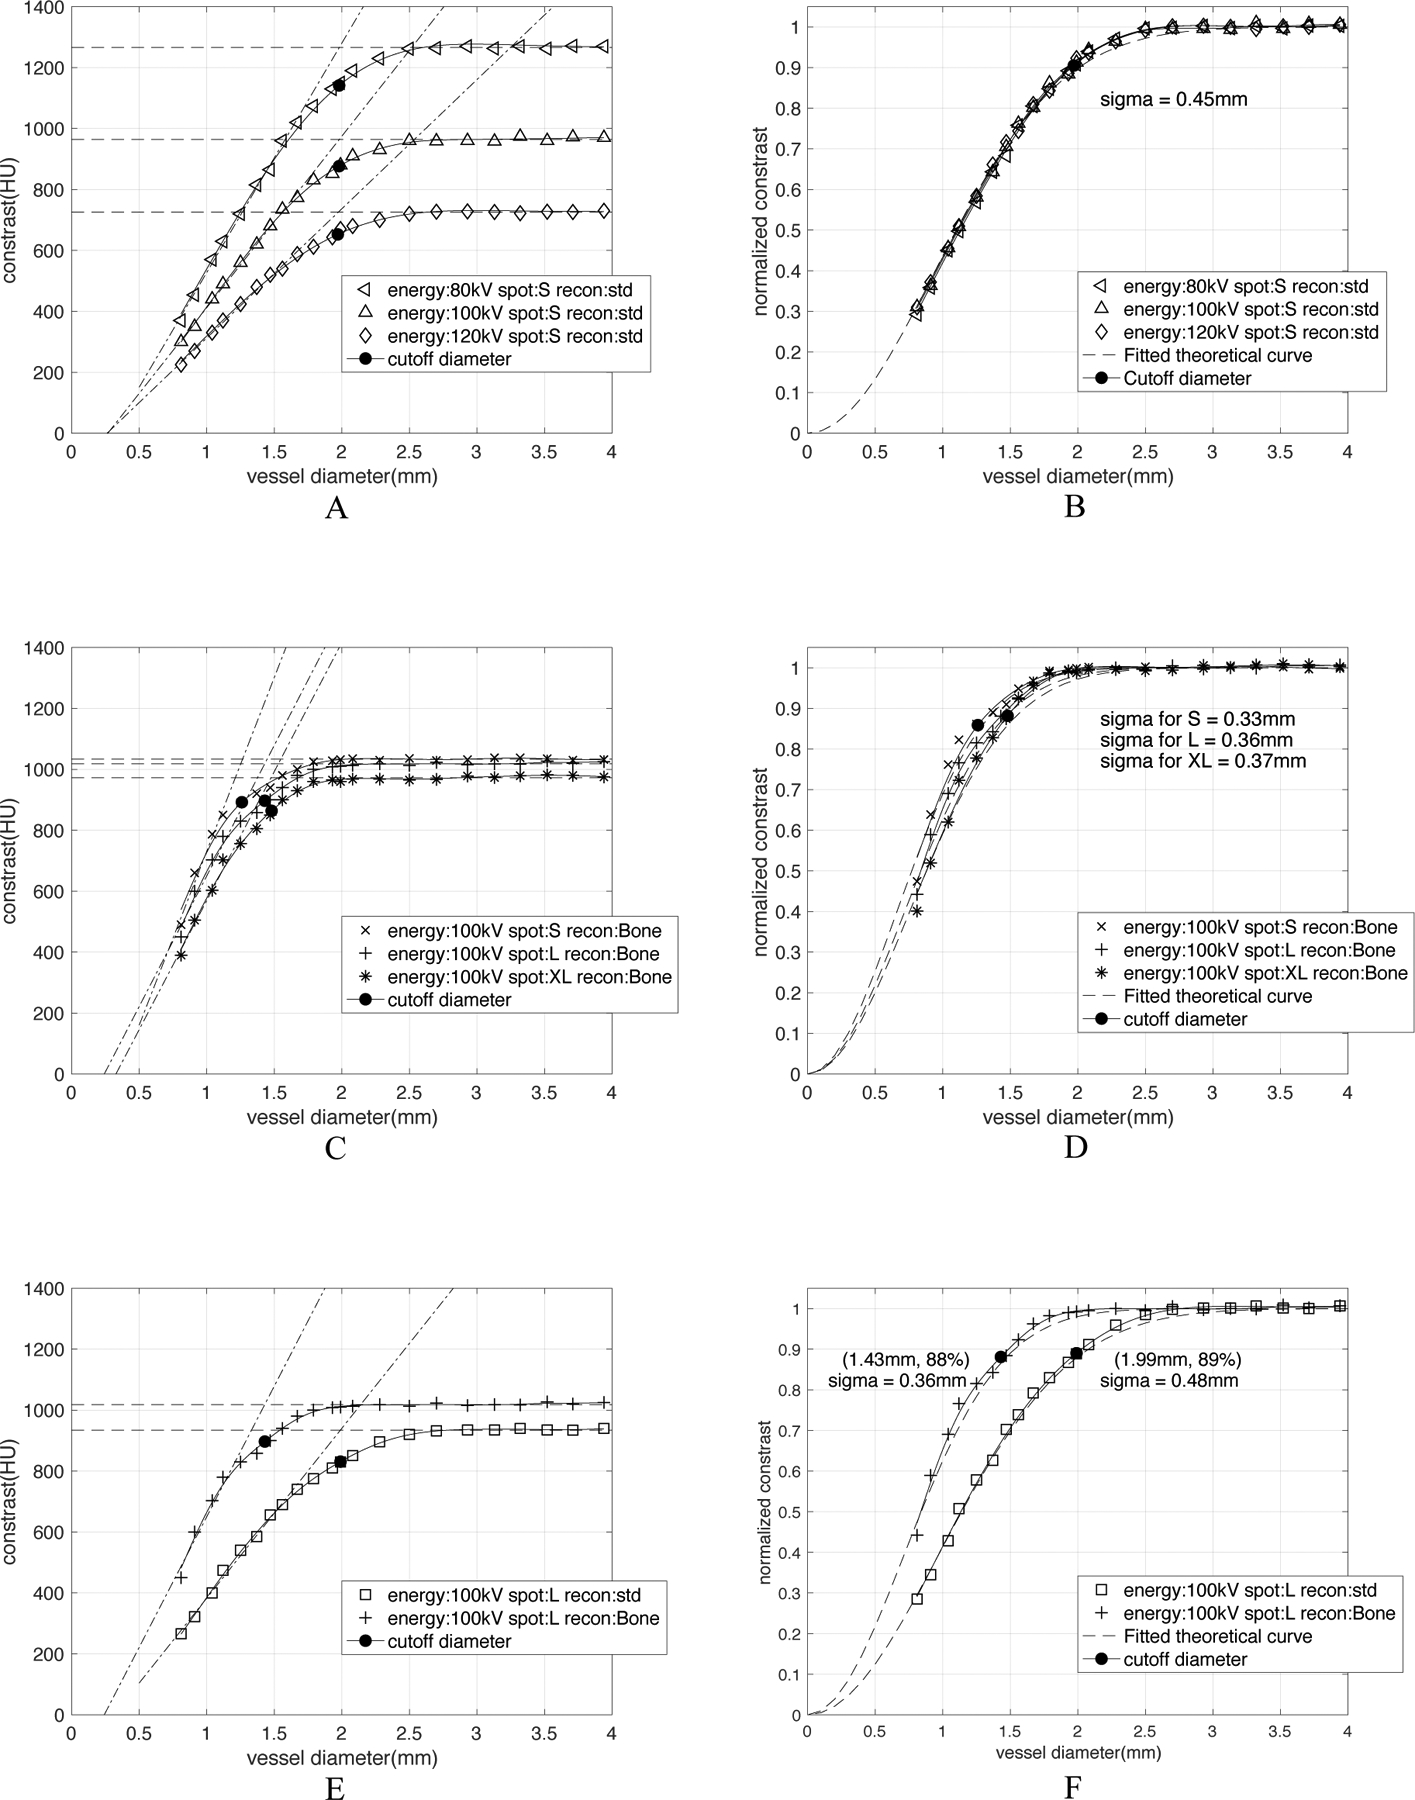
CT number calibration curve is CT-acquisition-parameter-dependent. All characterized σ were calculated by Equation 3(D50 = 2.355 σ), where D50 is the vessel diameter that has a 50% drop of constant amplitude in the curve. A) shows the influence of x-ray tube current energies on the raw calibration curves. (B) After normalization to the constant amplitude in large vessels, the three curves essentially become equivalent with a characteristic width of σ = 0.45mm. (C) and (D) show the difference between curves for different focal spot sizes exist both before and after the normalization. The calibration of small, large and extra-large focal spot size can be characterized with σ = 0.33, 0.36, 0.37mm respectively. (E) and (F) show the effect of reconstruction kernels both before and after the normalization. The high-resolution Bone kernel has σ = 0.36mm, a cutoff diameter as 1.43mm and cutoff contrast as 88% of the constant amplitude; while the low-resolution standard kernel has σ = 0.48mm, a cutoff diameter as 1.99mm and cutoff contrast of 89% of the constant amplitude.
Therefore, for each system and reconstruction we can find the characteristic σ and corresponding PSF by measuring D50 in the empirical CT number calibration curve. A more precise method to find σ would be to perform a least square fit of Equation 2 to the empirical curves, but the simplicity of D50 gives the user a very simple and robust method that can be performed on graph paper at the scanner.
We also obtained CT number calibration curves (Figure 7) of stationary, moving and motion-corrected vessels. For the 1st and 2nd set of CT parameters shown in Table 1, we made “FWHM calibration curves” (Figure 8) showing the FWHM estimate of the vessel, DFWHM as a function of true vessel diameter by measuring the corresponding FWHM diameter for each hole in the hole phantom.
Figure 7:
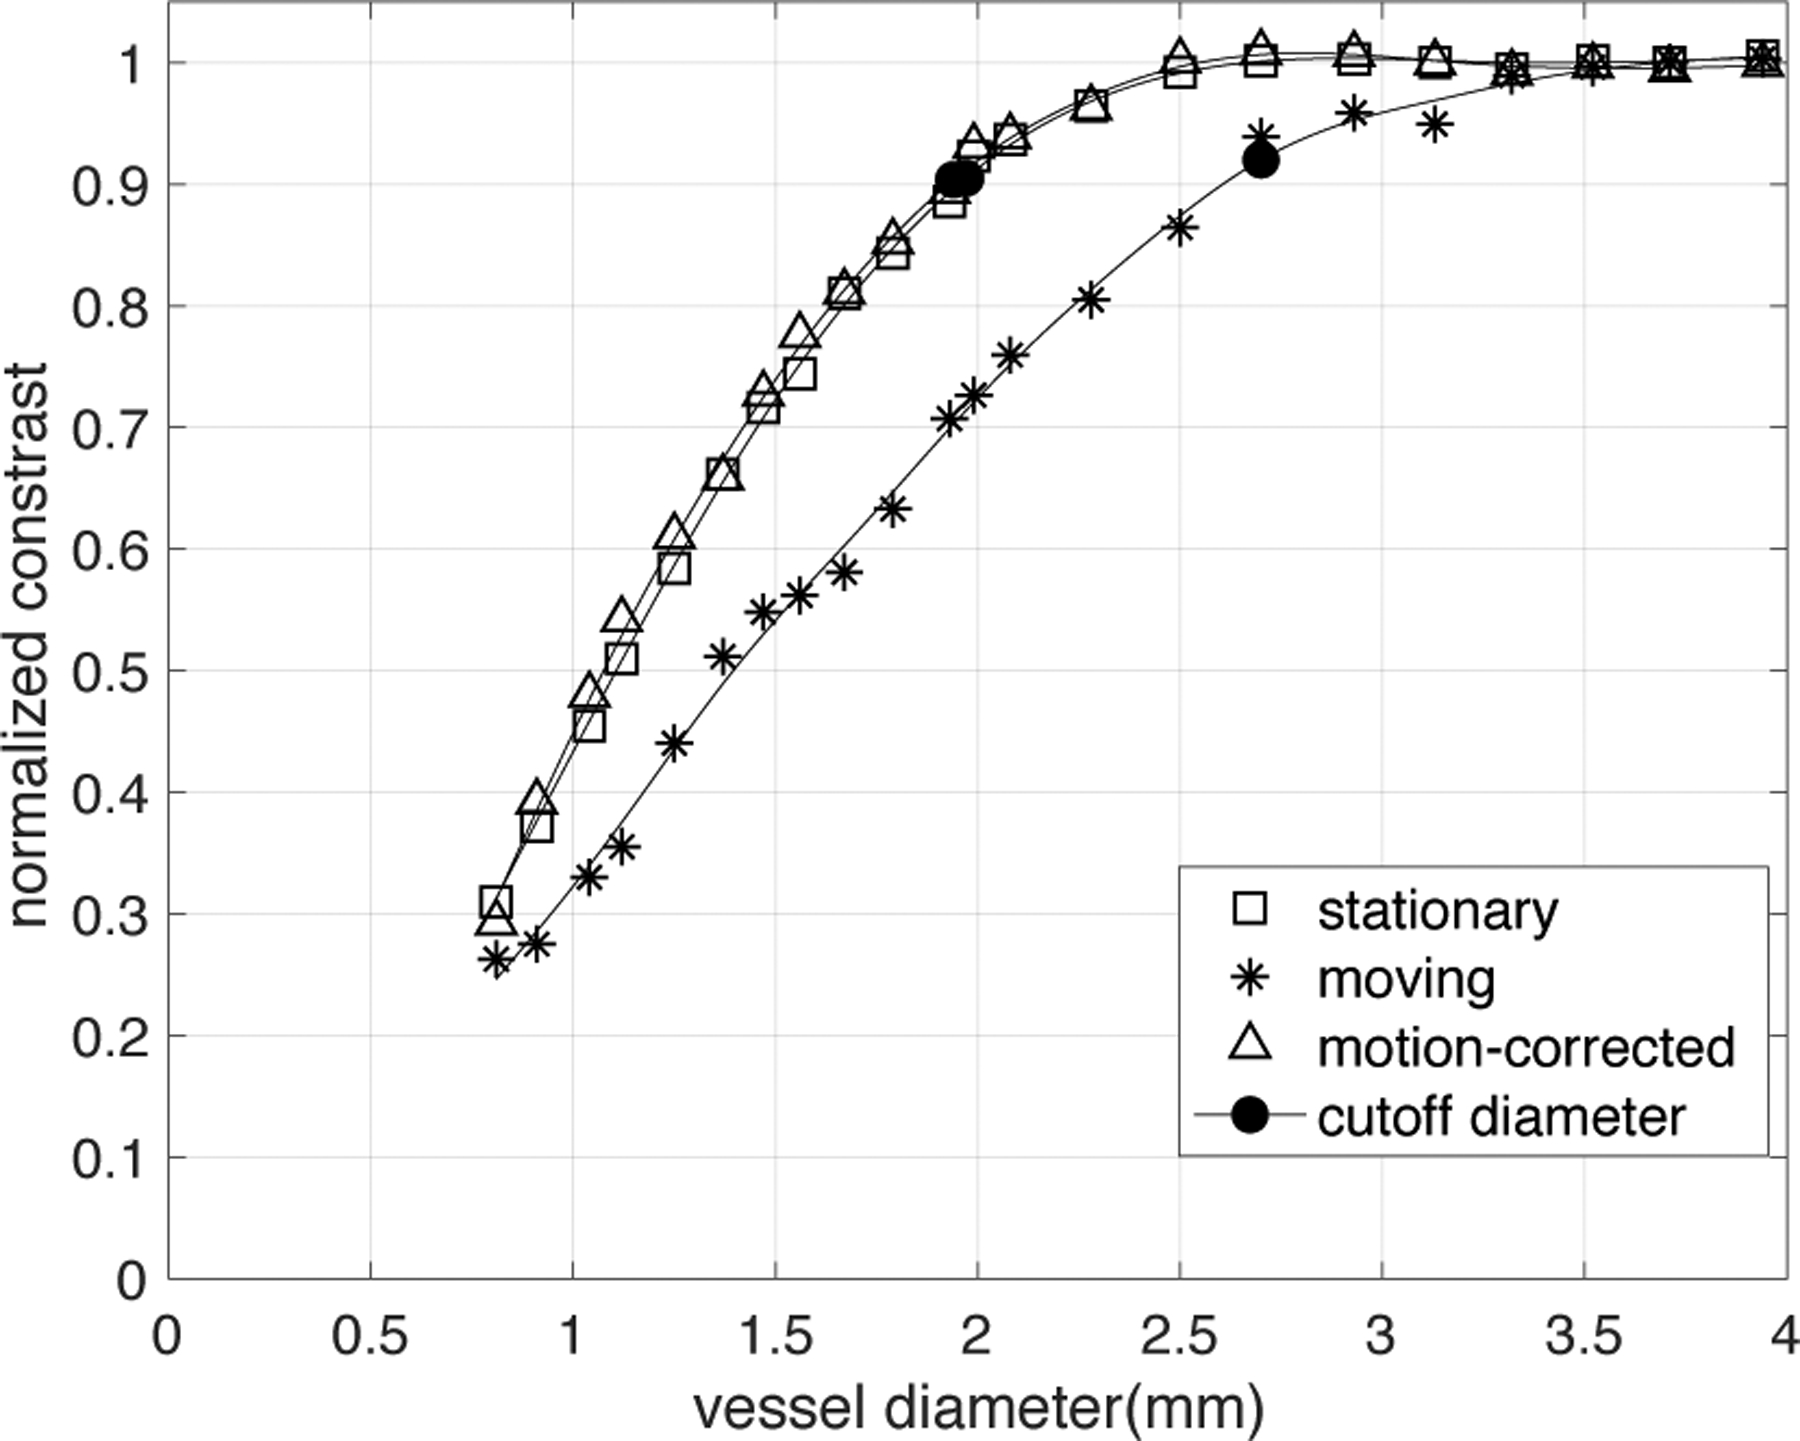
Normalized CT number calibration curve of stationary, moving and motion-corrected phantom CT images. CT data was acquired with 5th set of CT parameters from Table 1 (120kV, 350mA, 280ms rotation, small spot size, and standard reconstruction kernel, with ASiR-V = 50%). The velocity of vessel was set to be constant (15mm/s). Using Snapshot Freeze (SSF), the observed vessel voxel values in moving vessels essentially returns to the value measured in stationary vessels.
Figure 8:
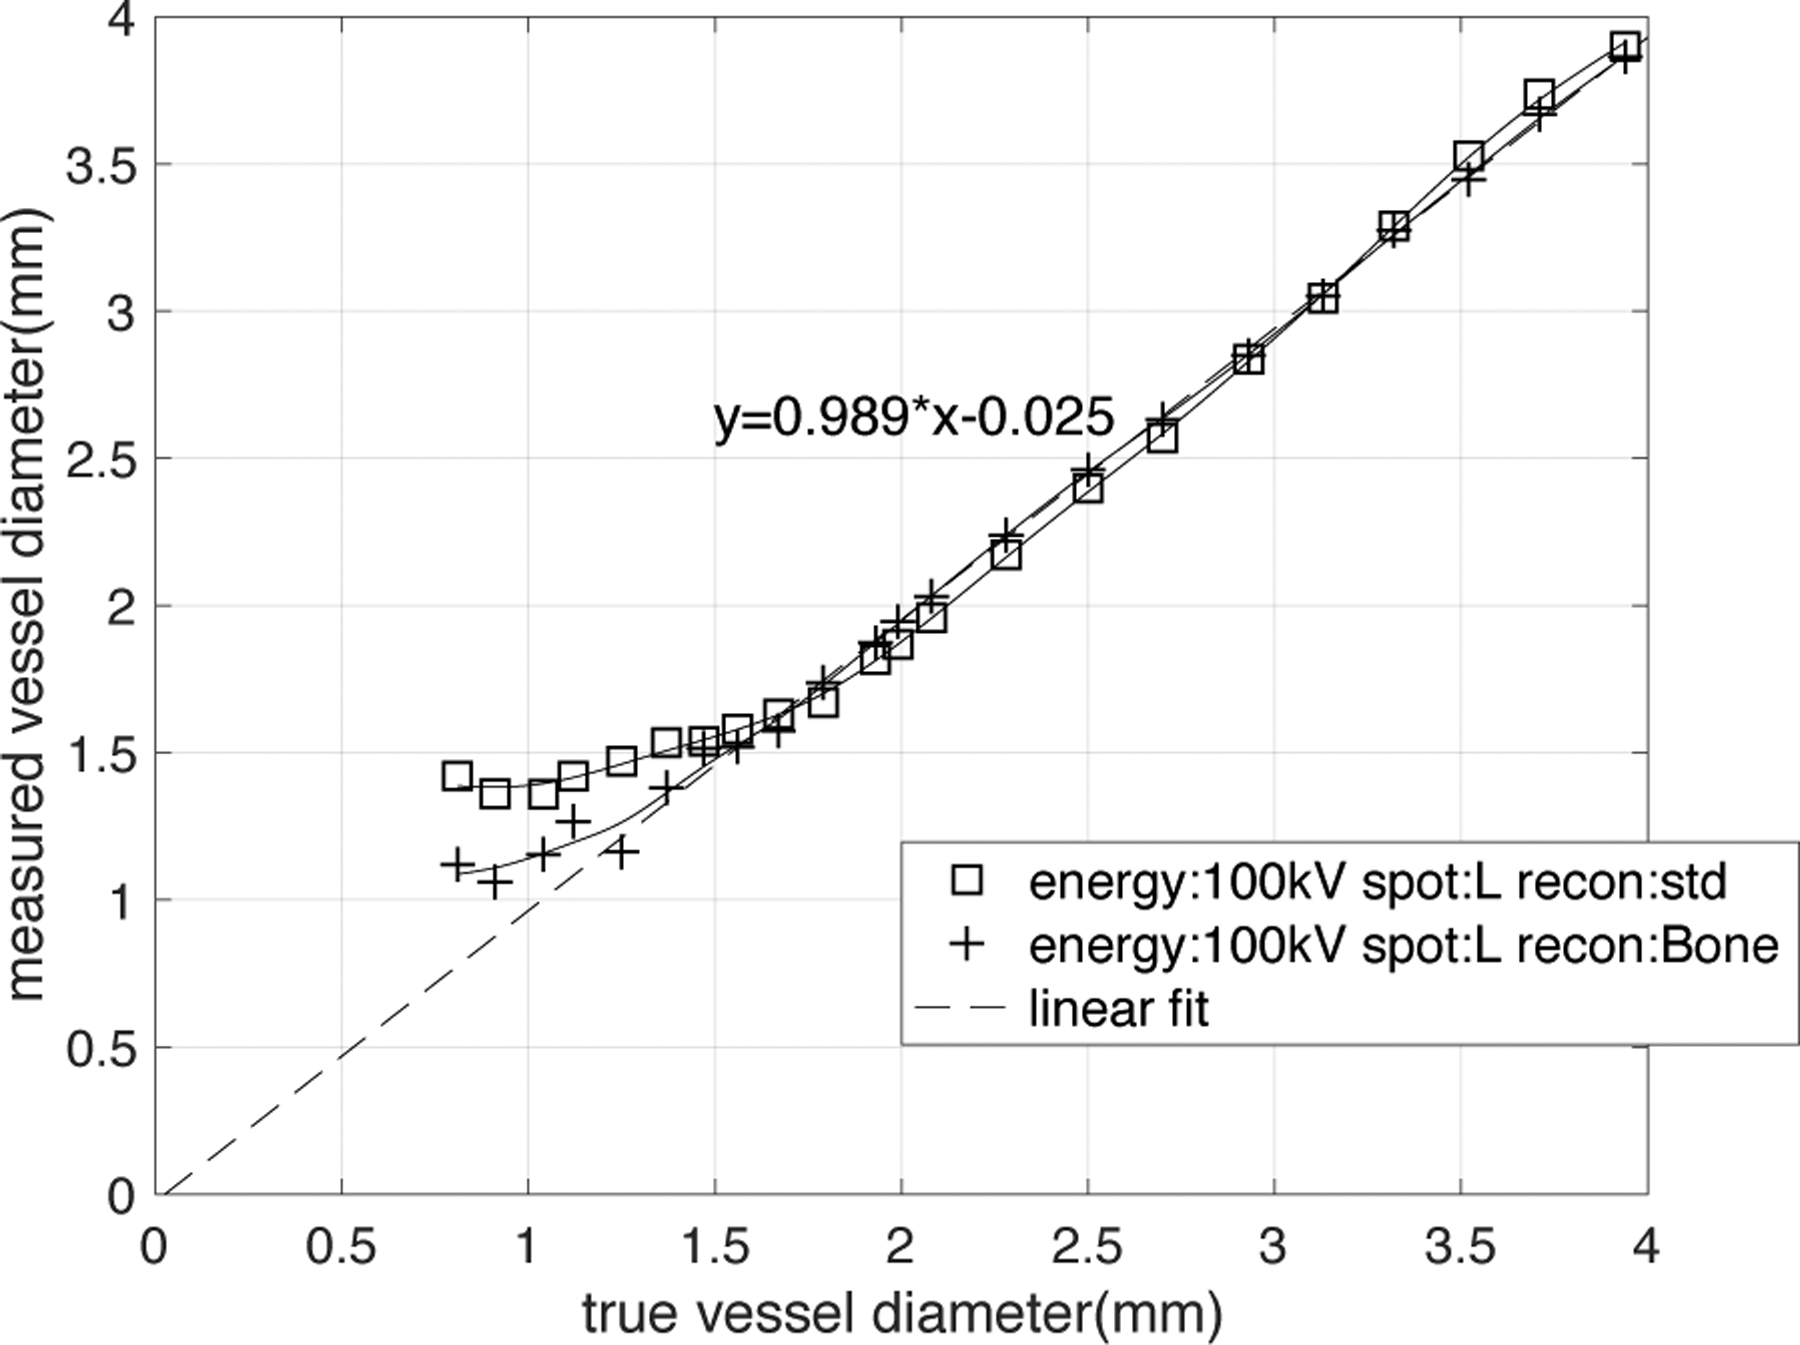
FWHM calibration curve. True diameter measured from high-resolution cone-beam CT image. The measured diameter, DFWHM has a linear relationship (dashed line represents a linear fit, function: DFWHM=0.989×true diameter-0.025, R2 >0.999) with the true diameter for vessels larger than the cutoff diameter. When vessel diameter is smaller than cutoff diameter, the DFWHM will gradually approach an asymptotic value, causing an overestimation of lesion size. The shape of the FWHM calibration curve is significantly dependent on the choice of reconstruction kernel and thus spatial resolution.
2.5. Segmentation of lesions in the vessel stenosis phantom
The true diameter was measured as a function of position along each vessel perpendicular to a curve connecting segmented center points along the vessel in high-resolution cone-beam CT images. The center points of the vessel were automatically generated in MATLAB by a 3-D medial surface thinning algorithm18 followed by manual pruning (Figure 3A). For each vessel lesion that has the length of ~14mm, approximately 35 center points were generated, resulting in the distance between two center points of 0.4mm on average (this was close to the image pixel size). The vessel “direction” at each center point was computed from a smooth line fitted through the point and neighboring center points. Figure 3B shows that for each center point, we found five proximal and five distal adjacent center points, resulting in an 11-center-point sliding window. A quadratic polynomial exhibiting the centerline’s limited curvature19 was fitted on this window using a least squares method. The distance between two center points was thus calculated as the length of the fitted line between the two.
Figure 3:
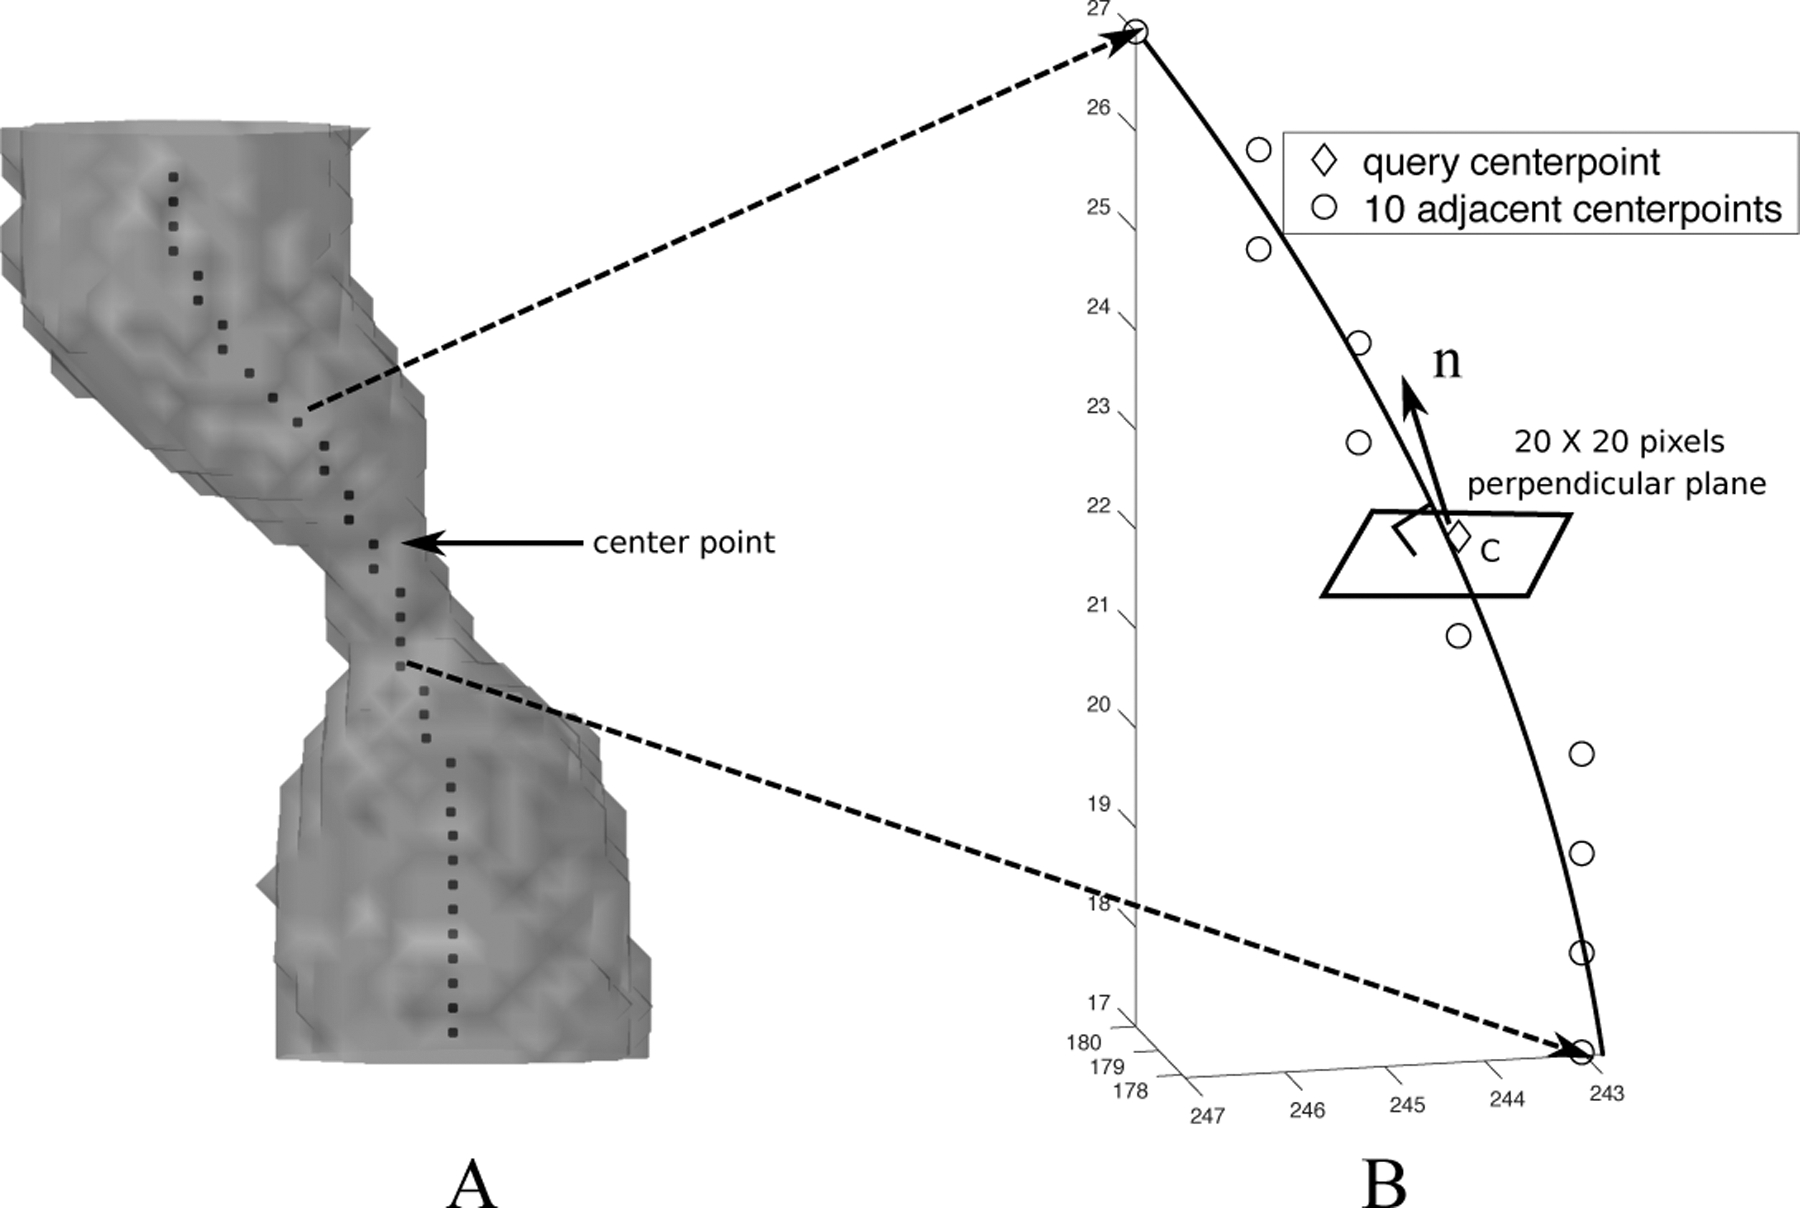
Computation of center points and the cross-sectional planes of the vessel. (A) Computation of center points of the vessel by 3-D medial surface thinning algorithm. (B) Computation of cross-sectional plane of the vessel.
Each query center point c and its fitted line yielded a normal vector (Figure 3B). A plane (20×20 pixels) perpendicular to was constructed, with point c as its center. This plane was viewed as the cross-sectional plane of the vessel. An upsampling processing by linear interpolation was then applied to the plane to increase the resolution to 200×200, smoothing the voxel value change in the plane.
2.6. Estimation of the vessel diameter using the CT-number-Calibrated diameter technique, DC
In section 2.5, we constructed all the cross-sectional planes along the vessel. The IMVV was then measured as the maximum CT number in the cross-sections. The corresponding contrast (= IMVV - background, background≈100HU) was normalized to the averaged contrast in the proximal large vessel region in order to compensate for different overall signal intensities between acquisitions. In the phantoms these differences were principally caused by different x-ray contrast for different x-ray tube energy. Based on the normalized contrast, our technique uses one of the two different approaches to measuring the diameter described in detail below.
2.6.1. Vessel diameter estimation in larger vessels: FWHM estimate of vessel
For vessels whose IMVV was independent of the vessel size (i.e. vessels with larger diameters), we utilized the FWHM estimate of vessel, DFWHM stated in section 2.4.2. Thus, for larger vessels, DC is equal to DFWHM. This decision was made based on the results shown both in Contijoch et. al. with simulations8 and Figure 8 with phantom data. For example, the calibration curve with the square sign (1st set of CT parameters) in Figure 8 showed a 3.08mm vessel was measured to be 3.0mm with negligible error.
2.6.2. Vessel diameter estimation in smaller vessels: CT number Calibration method
For smaller vessels, the IMVV is influenced by vessel size. We utilized the CT number calibration curve for each set of CT parameters to map the normalized contrast to the vessel diameter for that acquisition. For example, if we use the calibration curve in Figure 4 (1st set of CT parameters), when the contrast is measured as 400HU (IMVV=500HU, ~40% of proximal large vessel amplitude), we understand that it is in the partial volume region and thus can estimate DC as 1.1mm. It is important to note that the calibration of IMVV vs diameter was provided using an independent phantom which comprises vessel segments of known constant diameter - this should not be confused with a “training” step in a machine learning algorithm.
2.7. Comparison of Dgt, DFWHM and DC
We compared the ground truth diameter Dgt, FWHM estimate of the vessel DFWHM and CT-number-Calibrated diameter DC of the same lesion in the stenosis phantom to assess the accuracy of DC. The Dgt was calculated by benchtop high-resolution imaging system stated in 2.1. The DFWHM of the lesion was measured by FWHM estimate of vessel stated in section 2.4. The DC was calculated by applying our technique stated in section 2.6 to the entire lesion. Both DFWHM and DC were measured in the CT image with the same acquisition setting.
We assessed the accuracy of DC along the entire lesion by plotting the three estimates of diameter (Dgt, DFWHM, DC) together as a function of distance along the vessel. A Pearson correlation coefficient was computed to quantify the accuracy of the DC estimate.
3. RESULTS
3.1. Example CT number calibration curve derived from the hole phantom
The background value of the polymer resin was found to be 100HU±10HU. Figure 4, as an example of the empirical CT number calibration curve, shows the contrast between the vessel IMVV and the background in Hounsfield Units (ΔHU) plotted against vessel diameter. The IMVV does not depend on vessel size for large vessel diameters but decreases with decreasing vessel diameter for small vessels. In Figure 4, we define the “cutoff diameter” which divides the calibration curve into two regions: the constant amplitude region above the cutoff diameter and the partial volume region below the cutoff diameter. The cutoff diameter is the diameter value at the intersection of a straight line that fits the reduction of IMVV with decreasing diameter (line fit to points that have an amplitude < 80% of the constant amplitude) with the level of the constant amplitude region; this is shown as a bold black dot.
3.2. Comparison of theoretical and empirical CT number calibration curve
For the 5th CT acquisition setting in Table 1, we measured the corresponding PSF from the image of a Titanium bead with 0.25mm diameter averaged from 8 acquisitions to increase the signal-to-noise ratio. We found the standard deviation of this PSF, σ = 0.45mm by fitting Equation 1 to the PSF (Figure 5A). By plotting Equation 2 with σ = 0.45mm, we generated the theoretical CT number calibration curve and compared it with the normalized empirical CT number calibration curve of the same acquisition setting (Figure 5B). The two curves overlap closely, indicating that we can characterize the calibration curve with a suitable σ and thus find the underlying PSF.
3.3. CT number calibration curve is CT acquisition parameter dependent
Figure 6 is a collection of all CT number calibration curves for different image acquisition and reconstruction parameters. All curves follow the same basic pattern.
Figure 6A shows three contrast vs. diameter curves for three different x-ray tube current energies (kVp) with fixed spot size (small) and reconstruction kernel (standard). As expected, the CT number in the constant amplitude region becomes greater with lower kVp. The slope of the ΔHU vs. diameter relationship increases with decreasing tube current energy. The measured cutoff diameter for each curve is approximately equal (~2.0mm). Figure 6B shows the normalization of the ΔHU values from Figure 6A to the constant amplitude region yields essentially three equivalent calibrations characterized by σ = 0.45mm, indicating that x-ray energy, as expected, has no effect on the normalized calibrations.
Figure 6C shows three contrast vs. diameter curves for three different x-ray focal spot sizes with fixed x-ray tube energy (100kVp) and reconstruction kernel (Bone). As expected, for the constant reconstruction kernel a smaller spot size produces a smaller cutoff diameter; after the normalization, the difference between small size and large size still exists in Figure 6D.
Figure 6E shows two contrast vs. diameter curves for two different reconstruction kernels with fixed x-ray tube energy (100kVp) and focal spot size (Large). As expected for constant spot size the “Bone” kernel which passes greater high frequency data through the reconstruction has a significantly smaller cutoff diameter (~1.4mm) than the standard reconstruction kernel (~2mm). The normalized curves in Figure 6F can be characterized by σ = 0.36mm and σ = 0.48mm for “Bone” and “Standard” kernel respectively.
The important message we can derive from the plots in Figure 6 is that the CT number calibration curve is CT-acquisition parameter dependent. X-ray energy, x-ray focal spot size and reconstruction kernels all can determine the constant amplitude of large vessels as well as the slope of reduction in calibration curves; however, the effect of x-ray energy no longer exists after the normalization.
3.4. Motion artifacts and motion correction in CT number calibration curve
Figure 7 illustrates the loss of vessel IMVV and thus contrast with small vessel motion during acquisition (15mm/s in the “left-right” direction, which gives a total displacement of ~2.7mm over the half-scan acquisition). The small motion causes a significant reduction in voxel values for the smaller vessels as shown previously8 and can lead to an overestimation of the degree of stenosis because of the increased loss of voxel values. For example, the reduction of IMVV makes a 2mm vessel (corresponding to a mild ~30% stenosis of a 3mm proximal vessel) appear to have the IMVV of a 1.5mm stationary vessel (corresponding to a significant 50% stenosis of a 3mm vessel). It is clear from this data that the voxel values of smaller vessels (< 2.5mm) are more sensitive to motion, which is expected. Figure 7 also demonstrates the observed vessel voxel values in moving vessels returns to the value measured in stationary vessels when a post processing motion-correction algorithm (Snapshot Freeze) is applied to correct the motion corrupted image. This implies that the original calibration curve measured in stationary vessels is valid in motion-corrected vessels for this particular motion correction method.
3.5. FWHM calibration curve from hole phantom
Figure 8 demonstrates that the reconstruction kernel determines the shape of the FWHM calibration curve since the kernel changes the spatial resolution. The FWHM estimate of the vessel, DFWHM has a linear relationship (DFWHM = true size×0.989–0.025) with the true vessel diameter for those vessels that are larger than the cutoff diameter defined above. Based on the fitted linear relationship, we can state that the FWHM estimate of the vessel can measure the vessel diameter larger than cutoff diameter correctly with negligible error. For vessels smaller than the cutoff diameter, the DFWHM overestimates the size of the vessel, and the curve approaches an asymptotic value.
3.6. Estimation of vessel diameter in the vessel stenosis phantom
Figure 9 uses the measurement result of one stenosis as an example. The ground truth diameter is measured as proximal 4.10mm, lesion 0.90mm, 78.0% severe stenosis. The acquisition parameter is the 1st set in Table 1: 100kVp, 640mA, Large focal spot size, standard reconstruction. It is clear from the result: (1) The FWHM estimate of the vessel, DFWHM (proximal 4.14 mm, lesion 1.40mm, 66.2% moderate stenosis) yields an overestimation of the smaller caliber diameter in the lesion and thus underestimation of the percentage stenosis. (2) The CT-number-Calibrated diameter DC (proximal 4.14mm, lesion 0.88mm, 78.7% severe stenosis) accurately estimates the ground truth diameter over the entire range of the vessel segment. We also applied our technique onto 3 sets of single images without averaging of the same stenosis (see section 2.3) as shown in Figure 9D. These results indicate that the high accuracy measurement shown in the averaged image can also be reproduced in single images with higher noise.
Figure 9:
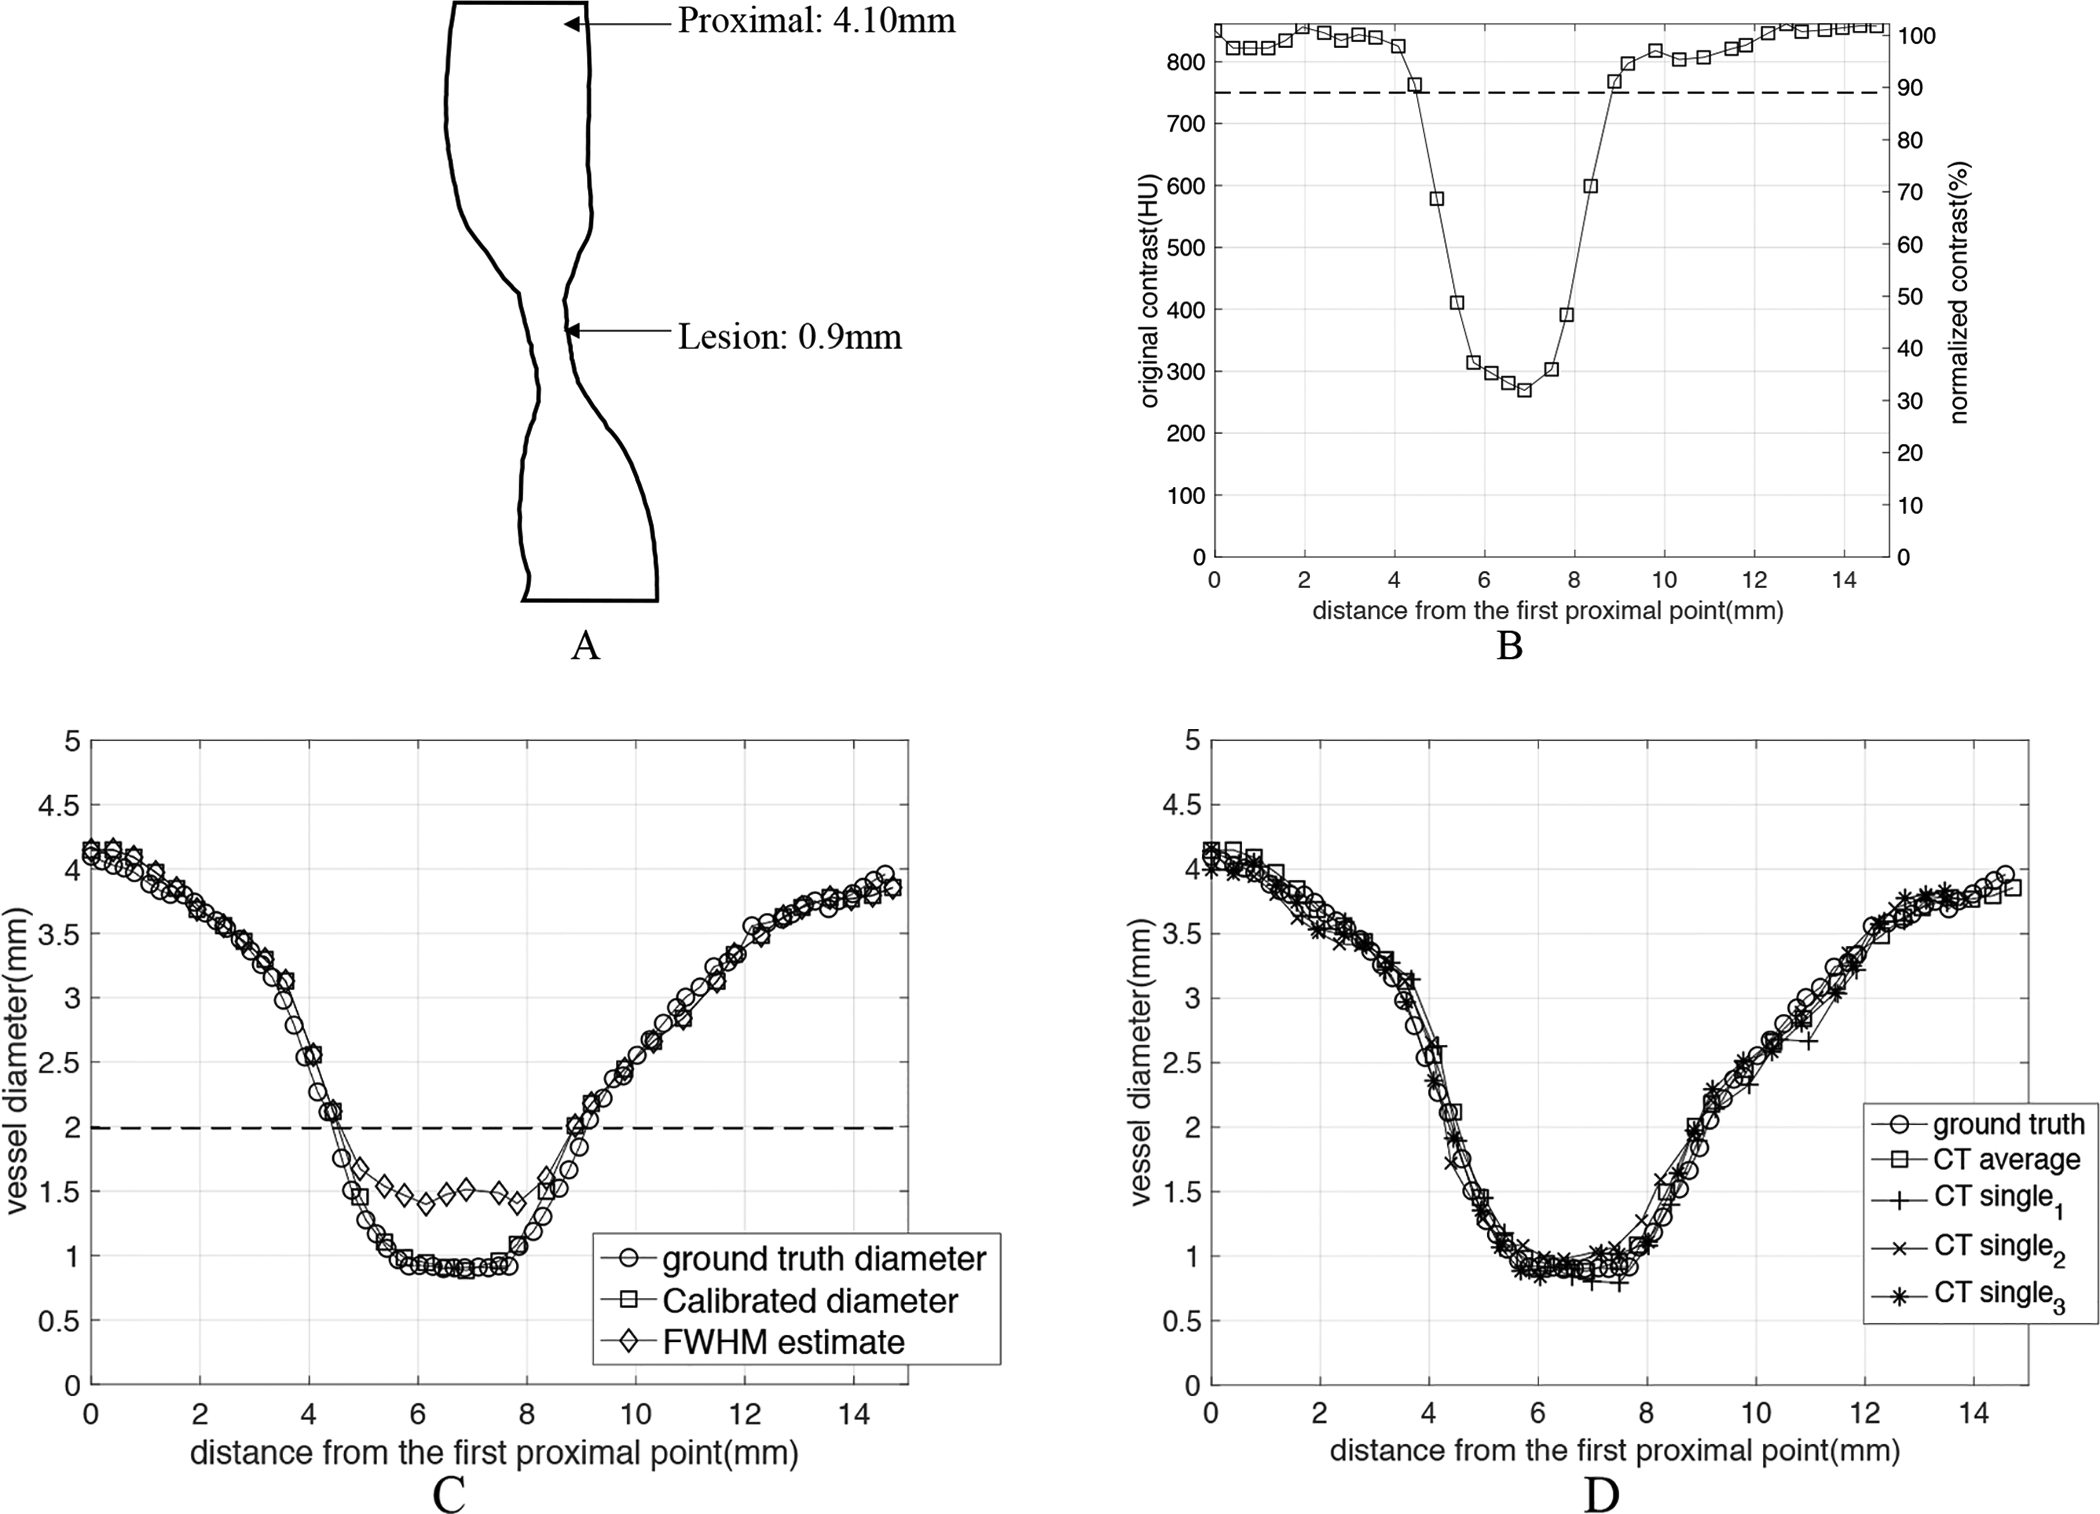
Estimation of vessel diameter as a function of position through a particular stenosis (ground truth diameters: proximal 4.10mm, lesion 0.90mm, 78.0% stenosis). The stenosis was imaged with standard clinical imaging parameters: 100kVp, large x-ray focal spot, standard reconstruction kernel. (A) shows the 2D rendering of the structure of the exemplar stenosis. (B) shows both the original contrast ΔHU values and the normalized contrast as a function of position along the vessel. (C) The estimated diameter as a function of position along the vessel. Three diameters are plotted: the ground truth diameter Dgt, the diameter estimated with FWHM DFWHM, and the CT-number-Calibrated diameter DC. The dashed lines in both B and C figures represent the cutoff diameter (1.99mm) and cutoff contrast (89% of maximum) for the standard kernel (see Figure 6F). As shown in the graph, the CT-number-Calibrated diameter estimates are very close to the ground truth for all range of sizes but FWHM diameter underestimates the percentage stenosis. (D) shows the measurement results when Calibrated diameter technique was applied onto 3 sets of single images without averaging (CTsingle) of the same stenosis. CTsingle represents the CT images of one acquisition with higher noise (standard deviation= ~25HU) and CTaverage represents the averaged CT images with lower noise (standard deviation= ~10HU). It is clear to see that the high measurement accuracy shown in CTaverage can also be reproduced in CTsingle.
In Figure 10 we gathered the measurement results of the smallest diameter in each of 17 lesion models in the stenosis phantom scanned by the 1st set of CT parameters (100kV, 640mA, large focal spot size, standard reconstruction kernel) and computed a Pearson correlation coefficient between DC and Dgt for this set (r=0.998). The DFWHM lies on or nearby the FWHM calibration curve, and the estimates are clearly inaccurate when compared with Dgt. This graph also shows a very strong linear correlation between the DC and the ground truth diameter Dgt: DC=0.951*Dgt+0.023, r=0.998. The 95% confidence bounds for the slope and y-intercept are (0.921, 0.981) and (−0.017,0.064) correspondingly. We also computed the average percentage error of the smallest diameter measured by DC and over the 17 lesions as 5.06%.
Figure 10:
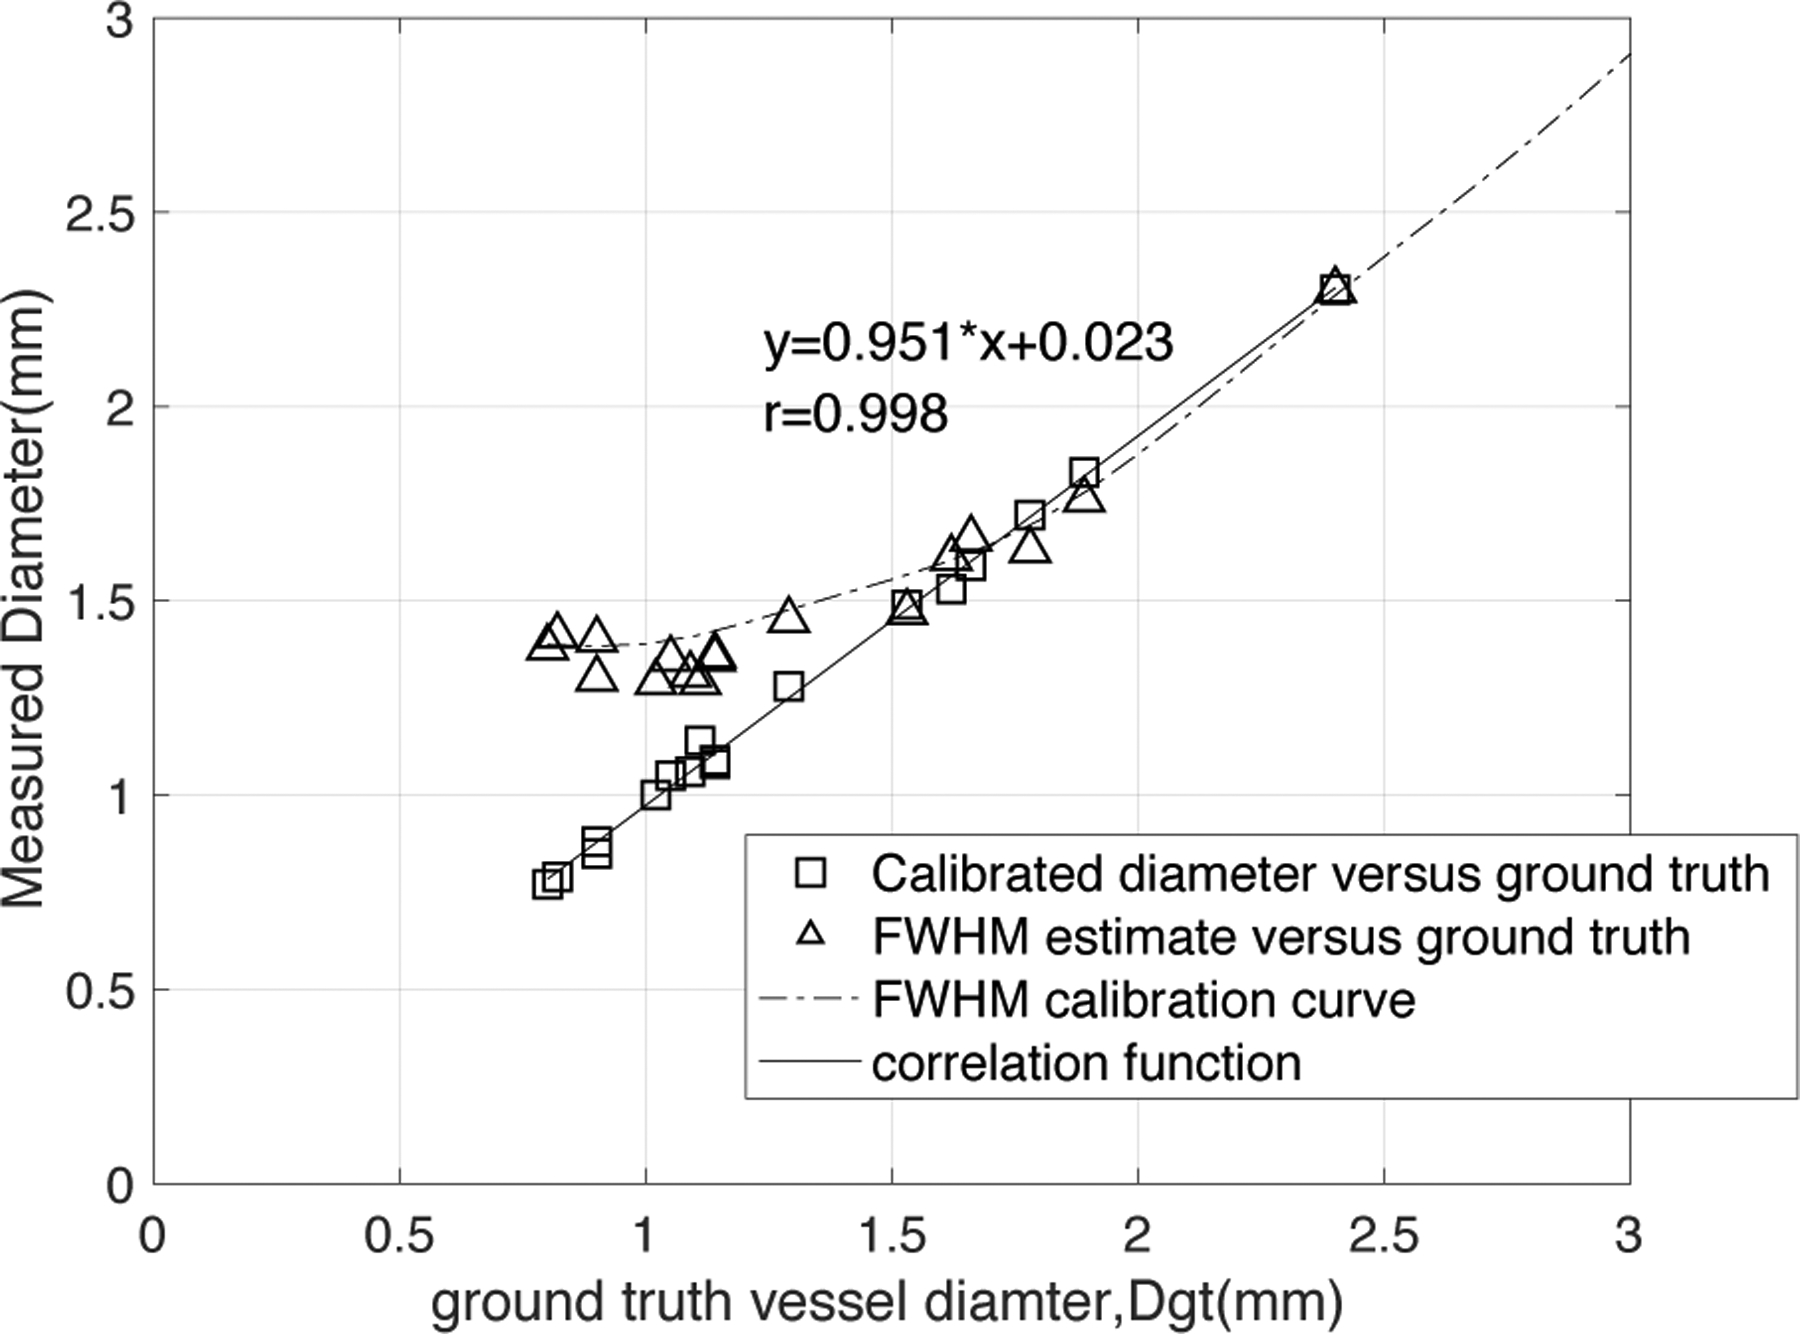
Comparison of the CT-number-Calibrated diameter estimates, DC (open squares) and FWHM estimates, DFWHM (open triangles) with each ground truth diameter, Dgt for the smallest diameter in each lesion in the stenosis phantom. The DFWHM lies very close to the FWHM calibration curve for 100kV, 640mA, standard kernel, large focal spot, as expected. There is a very strong linear correlation between DC and ground truth diameter (DC=0.951*Dgt+0.023, r=0.998) with a slope very close to 1.0 and intercept very close to 0.
4. DISCUSSION
In this paper, we introduce a new technique to accurately measure the vessel diameter, called CT-number-Calibrated Diameter. It takes advantage of both the FWHM segmentation for vessel segments of “larger” diameter (> cutoff diameter) and the vessel IMVV for vessel segments with “smaller” diameter (<cutoff diameter). Results shown in Figure 9 and 10 demonstrate the accuracy of this technique on a particular clinical scanner (GE Revolution CT) with the reconstruction parameters used for clinical CCTA in a range of diameters expected in CCTA images.
4.1. The Definition of Cutoff Diameter
In this paper, we define the “cutoff diameter” in section 3.1 as the diameter value at the intersection of a straight line fit to points that have an amplitude < 80% of constant amplitude region with the constant amplitude of large vessels. Note that this 80% was chosen empirically for all CT number calibration curves of different imaging protocols because the straight-line fit was simple and accurate for the points below this amplitude threshold. A possible alternative is to use 4σ as the cutoff diameter once σ is known by measuring D50 (see section 2.4.3.2). If we plug diameter = 4σ in Equation 2, the cutoff will be ~86% of the constant amplitude of large vessels, which is also a reasonable threshold separating two regions.
4.2. Calibration Curves are CT acquisition parameter dependent
In all cases vessel IMVV vs. diameter was found to have a simple functional form: a constant region above a cutoff diameter, and a decreasing IMVV vs. decreasing diameter below a cutoff diameter. The reason for the reduction is the partial volume effect20. Different CT acquisition parameter settings can affect the value of the constant region and the slope of reduction. After the normalization of different curves, the constant region is always equal to 1 and only the slope of reduction varies, which is characterizing the spatial resolution of the system with all of the particular scanning parameters, reconstruction smoothing, and detection task included.
From the mathematical derivation, we state that every calibration curve can be characterized by just one parameter, the σ of the 2D PSF. We also define a “cutoff” diameter to divide the curve into two parts in which different measurement methods are used. It is easy to deduce that a calibration curve of higher resolution imaging system has a smaller cutoff diameter and can be characterized by smaller σ.
We include three parameters in this paper: x-ray tube energy, focal spot size and reconstruction kernel. While different raw IMVV vs diameter curves were obtained at different beam energies, the normalized calibration curves essentially overlap for the three energies tested (80, 100, 120 kVp) shown in Figure 6B. As shown in Figure 6C and 6D, larger focal spot size causes greater blurring, and the cutoff diameter is larger for larger focal spot size; however, the slope of reduction is smaller for larger focal spot size. Interestingly, the extra-large focal spot size in Figure 6C shows a lower constant amplitude for large vessels compared with the small and large focal spot sizes. This is likely due to the interaction of the point spread function from different focal spots with the shape of the vessels giving higher “peaks” in the vessels imaged with the small and large focal spot sizes. The reconstruction kernels with higher spatial resolution have smaller cutoff diameters and smaller characteristic σ as shown in Figure 6F.
It is clear that the calibration curves are CT-parameter-dependent. This implies that individual calibration curves for the set of possible CCTA imaging parameters should be obtained for each imaging system. While somewhat cumbersome, the calibration curves should only need to be obtained once for each set of parameters on each system. Importantly, we show the mathematical relation between calibration curves and 2D isotropic PSF, which suggests that if we empirically measure one, we can analytically derive the other.
4.3. CT-number-Calibrated diameter in moving objects
The motion sensitivity measurements performed in this study using the anthropomorphic phantom recapitulate the same result shown by Contijoch et. al. with simulations8. The small “drift” motion causes a significant reduction in voxel values for the smaller vessels and can lead to an overestimation of the degree of stenosis because the motion causes an increased loss of voxel values. The stenosis in larger vessels, however, might be underestimated due to motion21 resulting in a blurring of the edges of the vessel and conservation of the voxel values in the central voxels of the vessels.
In this study we used Snapshot Freeze (SSF), a newly developed motion-correction algorithm, which has been shown to improve the image quality of moving objects by Fuchs22 and Li23. It is clear in Figure 7 that the voxel value in the moving vessel is increased by SSF to the value measured in the same vessel when the vessel is stationary; after motion correction we can therefore apply the CT-number-calibrated diameter technique.
4.4. Accuracy of vessel diameter measurement is important for FFRCT of stenoses
Recently, FFRCT has emerged as a non-invasive method to assess lesion significance in CCTA. FFRCT uses computational fluid dynamics to evaluate coronary blood flow6 and FFRCT used with CT among stable patients with suspected or known CAD lead to improved diagnostic accuracy and discrimination vs CT alone24. Sankaran et. al.7 demonstrated that the effect of uncertainty in lumen diameter exceeds that of the other model variables in determining the accuracy of FFRCT. Hence, the CT-number-calibrated diameter, which accurately measures the vessel diameters in a range of values important for CCTA will have a positive impact on the accuracy of FFRCT.
4.5. Limitations
This study only measured and validated the CT number calibration curves on a single imaging system (GE Revolution CT) and a finite number of protocols used for CCTA in our institution. Further work is needed to generalize the technique to other systems and other reconstruction algorithms. Also, there are a number of papers that address the question of diameter estimation using various techniques19,25; while we did not compare CT-number-Calibrated Diameters against these methods, the absolute precision and accuracy of the technique is fully reported here and stands on its own.
The phantom which comprised 17 coronary artery stenoses did not simulate the effect of coronary artery calcium in any of the lesions. A new phantom will need to be designed to include a realistic representation of calcified coronary arteries, which is a common condition. The background CT number in the phantom used is around 100HU, which is similar to soft tissue, but unlike fat attenuation normally found around epicardial coronary arteries; however, we believe the results reported here would scale to different uniform background values. Further study would be needed to fully characterize the effect of non-uniform background such as the co-existence of fat and muscle around arteries.
The CT number calibration measurement requires the normalization of IMVV to the proximal amplitude in the constant zone; it is assumed that the contrast agent concentration in the blood is constant along the vessel. We assumed that the images were obtained at a phase of the injection that produced a relatively low gradient in contrast from the proximal vessel to the center of the lesion26. A modified algorithm could use an expected amplitude that is linear interpolation of the proximal and distal vessels; however, a drop in the flow distal to the lesion may also affect this value. Normalization to the proximal amplitude seemed to be the simplest choice, and is easily measured by an observer. The CT number calibration also assumes the disk shape of vessel and we designed our vessel stenosis phantom to have vessels with all convex cross sections. However, we understand that patient stenoses could have the non-convex shapes, and Equation 2 is an approximation to these other more complex shapes. Classifying these more complex shapes with a simple “percent stenosis” becomes challenging as the flow modeling also becomes more complex.
The CT number calibration measurement relies on the CT number of a single voxel in the coronary artery, which is a weakness. However, by definition, it is difficult to derive a technique that uses an “average” CT number inside the vessel lumen, because for significant stenoses the target vessel has a diameter that is at the limits of the resolution of the system. Hence, the simplest and most reproducible measurement was intraluminal maximum voxel value (IMVV); this measurement has a correlation with neighboring voxels that are driven by the blur of the point spread function, and has a very simple analytical behavior as shown in Equation 2. This work builds on the original simulations of Contijoch et. al. by adding actual measurements using modern coronary imaging protocols; however, moving the technique into humans will likely require validation studies involving independent measurements of the coronary diameter such as OCT, intravascular US, or QCA from biplane fluoroscopy. Unfortunately, all of these other techniques suffer from their own limitations.
5. CONCLUSIONS
We have demonstrated in this work that we can trust estimates of vessel size measured by the FWHM technique down to a cutoff diameter of ~2.0mm when scanning with typical coronary CTA protocols. For vessels below 2.0mm, the traditional FWHM technique will overestimate the vessel size; therefore, we have introduced a CT number calibration technique to improve the accuracy and precision of estimating the diameter of small vessels (< 2.0mm) and stenoses in coronary CTA. The “CT-number-Calibrated Diameter” method was validated on a clinical CT scanner using standard imaging protocols using an anthropomorphic phantom derived from human coronary stenoses.
Disclosure of Conflicts of Interest:
Dr. McVeigh owns founders shares of MR Interventions Inc. He also receives research funding from GE Healthcare, Abbott Inc. and Tendyne Holdings Inc.
References:
- 1.Neglia D, Rovai D, Caselli C, et al. , Detection of Significant Coronary Artery Disease by Noninvasive Anatomical and Functional Imaging, Circ. Cardiovasc. Imaging 8(3), 1–10 (2015). [DOI] [PubMed] [Google Scholar]
- 2.Williams MC, Hunter A, V Shah AS, et al. , Use of Coronary Computed Tomographic Angiography to Guide Management of Patients With Coronary Disease., J. Am. Coll. Cardiol 67(15), 1759–1768 (2016). [DOI] [PMC free article] [PubMed] [Google Scholar]
- 3.Chen MY, Bandettini WP, Shanbhag SM, et al. , Concordance and diagnostic accuracy of vasodilator stress cardiac MRI and 320-detector row coronary CTA, Int J Cardiovasc Imaging (2013). [DOI] [PMC free article] [PubMed] [Google Scholar]
- 4.ACR-NASCI-SPR, ACR-NASCI-SPR Practice Parameter for the Performance of Quantification of Cardiovascular Computed Tomography (CT) and Magnetic Resonance Imaging (MRI), 1076(Revised 2008), 1–28 (2014). [Google Scholar]
- 5.Pontone G, Bertella E, Mushtaq S, et al. , Coronary Artery Disease: Diagnostic Accuracy of CT Coronary Angiography—A Comparison of High and Standard Spatial Resolution Scanning, Radiology 271(3), 688–694 (2014). [DOI] [PubMed] [Google Scholar]
- 6.Taylor CA, Fonte TA, and Min JK, Computational fluid dynamics applied to cardiac computed tomography for noninvasive quantification of fractional flow reserve: Scientific basis, J. Am. Coll. Cardiol 61(22), 2233–2241 (2013). [DOI] [PubMed] [Google Scholar]
- 7.Sankaran S, Kim HJ, Choi G, and Taylor CA, Uncertainty quantification in coronary blood flow simulations: Impact of geometry, boundary conditions and blood viscosity, J. Biomech 49(12), 2540–2547 (2016). [DOI] [PubMed] [Google Scholar]
- 8.Contijoch F, Stayman JW, and McVeigh ER, The impact of small motion on the visualization of coronary vessels and lesions in cardiac CT: A simulation study: A, Med. Phys 44(7), 3512–3524 (2017). [DOI] [PMC free article] [PubMed] [Google Scholar]
- 9.Rollano-Hijarrubia E, Stokking R, van der Meer F, and Niessen WJ, Imaging of Small High-Density Structures in CT. A Phantom Study, Acad. Radiol 13(7), 893–908 (2006). [DOI] [PubMed] [Google Scholar]
- 10.Hoffmann KR, Nazareth DP, Miskolczi L, et al. , Vessel size measurements in angiograms: A comparison of techniques, Med. Phys 29(7), 1622–1633 (2002). [DOI] [PubMed] [Google Scholar]
- 11.Erdogan H and Fessler JA, Ordered subsets algorithms for transmission tomography, Phys Med Biol 44(11), 2835–2851 (1999). [DOI] [PubMed] [Google Scholar]
- 12.Grady L, Peterson K, Schaap M, et al. , Vessel lumen segmentation from coronary CTA using deep learning: validation with OCT data, J Comput Assist Tomogr 10(Suppl 1), S47 (2016). [Google Scholar]
- 13.Blender Online Community, Blender - a 3D modelling and rendering package, (2017).
- 14.Shechter G, Resar JR, and McVeigh ER, Displacement and velocity of the coronary arteries: cardiac and respiratory motion, IEEE Trans Med Imaging 25(3), 369–375 (2006). [DOI] [PMC free article] [PubMed] [Google Scholar]
- 15.Pack JD, Edic PM, Claus BEH, Iatrou M, and Miller JV, Method for computed tomography motion estimation and compensation, US8224056B2, 2012. [Google Scholar]
- 16.Suh YJ, Kim YJ, Kim JY, et al. , A whole-heart motion-correction algorithm: Effects on CT image quality and diagnostic accuracy of mechanical valve prosthesis abnormalities, J. Cardiovasc. Comput. Tomogr 11(6), 474–481 (2017). [DOI] [PubMed] [Google Scholar]
- 17.Soon J, Sulaiman N, Park JK, et al. , The effect of a whole heart motion-correction algorithm on CT image quality and measurement reproducibility in Pre-TAVR aortic annulus evaluation, J. Cardiovasc. Comput. Tomogr 10(5), 386–390 (2016). [DOI] [PubMed] [Google Scholar]
- 18.Lee TC, Kashyap RL, and Chu CN, Building Skeleton Models via 3-D Medial Surface Axis Thinning Algorithms, CVGIP Graph. Model. Image Process 56(6), 462–478 (1994). [Google Scholar]
- 19.Lesage D, Angelini ED, Bloch I, and Funka-Lea G, A review of 3D vessel lumen segmentation techniques: Models, features and extraction schemes, Med. Image Anal 13(6), 819–845 (2009). [DOI] [PubMed] [Google Scholar]
- 20.Barrett JF and Keat N, Artifacts in CT: Recognition and Avoidance, RadioGraphics 24(6), 1679–1691 (2004). [DOI] [PubMed] [Google Scholar]
- 21.Richards T, Sturgeon GM, Ramirez-Giraldo JC, et al. , Quantification of uncertainty in the assessment of coronary plaque in CCTA through a dynamic cardiac phantom and 3D-printed plaque model., J. Med. imaging (Bellingham, Wash.) 5(1), 13501 (2018). [DOI] [PMC free article] [PubMed] [Google Scholar]
- 22.Fuchs TA, Stehli J, Dougoud S, et al. , Impact of a new motion-correction algorithm on image quality of low-dose coronary CT angiography in patients with insufficient heart rate control, Acad. Radiol 21(3), 312–317 (2014). [DOI] [PubMed] [Google Scholar]
- 23.Li Q, Li P, Su Z, et al. , Effect of a novel motion correction algorithm (SSF) on the image quality of coronary CTA with intermediate heart rates: Segment-based and vessel-based analyses, Eur. J. Radiol 83(11), 2024–2032 (2014). [DOI] [PubMed] [Google Scholar]
- 24.Min JK, Leipsic J, Pencina MJ, et al. , Diagnostic accuracy of fractional flow reserve from anatomic CT angiography, JAMA 308(12), 1237–1245 (2012). [DOI] [PMC free article] [PubMed] [Google Scholar]
- 25.Worz S and Rohr K, Segmentation and quantification of human vessels using a 3-D cylindrical intensity model., IEEE Trans. Image Process 16(8), 1994–2004 (2007). [DOI] [PubMed] [Google Scholar]
- 26.Lardo AC, Rahsepar AA, Seo JH, et al. , Estimating coronary blood flow using CT transluminal attenuation flow encoding: Formulation, preclinical validation, and clinical feasibility., J. Cardiovasc. Comput. Tomogr 9(6), 559–66.e1 (2015). [DOI] [PubMed] [Google Scholar]


