

Abstract
Bone is the second most transplanted tissue in the world, resulting in increased demand for bone grafts leading to the fabrication of synthetic scaffold grafting alternatives. Fracture sites are under increased oxidative stress after injuries, affecting osteoblast function and hindering fracture healing and remodeling. To counter oxidative stress, free radical scavenging agents, such as cerium oxide nanoparticles, have gained traction in tissue engineering. Towards the goal of developing a functional synthetic system for bone tissue engineering, we characterized the biocompatibility of a porous, bioactive, free radical scavenging nanocomposite scaffold composed of poly (1,8 octanediol-co-citrate), beta-tricalcium phosphate, and cerium oxide nanoparticles. We studied cellular and tissue compatibility utilizing in-vitro and in-vivo models to assess nanocomposite interactions with both human osteoblast cells and rat subcutaneous tissue. We found the scaffolds were biocompatible in both models and supported cell attachment, proliferation, mineralization, and infiltration. Using hydrogen peroxide, we simulated oxidative stress to study the protective properties of the nanocomposite scaffolds via a reduction in cytotoxicity and recovered mineralization of osteoblast cells in-vitro. We also found after implantation in-vivo the scaffolds exhibited biocompatible properties essential for successful scaffolds for bone tissue engineering. Cells were able to infiltrate through the scaffolds, the surrounding tissues elicited a minimal immune response, and there were signs of scaffold degradation after 30 days of implantation. After the array of biological characterization, we had confirmed the development of a nanocomposite scaffold system capable of supporting bone remodeling processes while providing a protective free radical scavenging effect.
Keywords: Nanocomposite scaffolds, free radical scavenging, cerium, biocompatibility, human osteoblasts, subcutaneous implant
INTRODUCTION
During an incidence of bone fracture or injury, there is an increase in reactive oxygen species (ROS) at the site of injury during the early stages of bone healing and reformation.(1) Oxidative stress has been shown to reduce mineral deposition by osteoblasts resulting in restricted bone regeneration at grafting locations. Elevated levels of ROS can damage cellular structures through lipid and protein oxidations, alter the integrity of mitochondrial and nuclear DNA, and cause apoptosis and necrosis of osteoblastic cells. (2),(3) Oxidative stress also deters the natural bone remodeling cycle by inhibiting osteoblastic differentiation and remodeling while stimulating bone resorption by osteoclast cells. This imbalance results in an overall decrease in bone mineral density.(2),(4) The challenge of overcoming oxidative stress has gained interest with the increase of free radical scavenging agents being utilized in scaffolds to alleviate oxidative stress.
Cerium oxide nanoparticles (CNPs) have gained attention in tissue engineering applications because of their free radical scavenging (FRS) properties that reduce overall oxidative stress.(3),(5)–(10) CNPs have a cubic fluorite structure with mixed vacancy states of Ce3+ and Ce4+ species present.(11) CNPs host redox reactions using multiple reaction paths that mimic functions of an wide array of enzymes. Of importance, CNPs behave as synthetic super-oxide dismutase (SOD) and catalase, which react with harmful superoxide and hydrogen peroxide molecules, respectively, and ultimately break them down to harmless products such as water and O2.(3),(5),(11)–(15) In an environment with oxidative stress, CNPs have shown increased cell viability and proliferation and reduced cellular damage of various cell types including osteoblasts and endothelial cells in cardiovascular, neuronal, and wound healing environments.(3),(16)–(19) Recently, their properties have been investigated in applications that include anti-radiation, anti-inflammatory, drug delivery vehicles, and antioxidant agents for the treatment of retinal damage, cardiovascular pathologies, and neurodegenerative disorders.(3),(5),(6),(8),(11),(18),(20),(21) These unique properties have led to our own investigation of the interactions of CNPs incorporated into a nanocomposite system with human osteoblast cells (HObs) and subcutaneous rat tissue.
For a synthetic scaffold to be successful it must contain the ideal properties required for bone tissue regeneration. The materials must be biocompatible, biodegradable, and osteoconductive. Further, a construct should be anti-inflammatory and show bioactivity to promote bone regeneration. The scaffold construct must also be porous and mechanically stable to host remodeling. Common materials used to engineer synthetic bone grafts include both natural and synthetic biocompatible polymers, such as collagen, polylactic acid (PLA), polycaprolactone (PCL), and poly diol citrates (PDC).(22)–(25) Calcium phosphates such as hydroxyapatite (HA) and β-tricalcium phosphate (β-TCP) are added to scaffolds as a bioactive component to increase osteoconductivity – promoting cell adhesion and scaffold interfacing with native tissue.(23),(26)–(30) These materials are combined to create various types of grafts using several fabrication methods including gas foaming, solvent casting, particle leaching, solid free-form printing, and electrospinning to create scaffolds containing open porous networks.(23),(31)–(33)
In previously reported research, we have successfully fabricated a free radical scavenging nanocomposite scaffold for bone tissue regeneration applications.(34) Using a particulate leaching method, a porous scaffold composed of poly (1,8 octanediol-co-citrate) (POC), a biocompatible, biodegradable elastomer; β-TCP, a bioactive calcium phosphate ceramic; and CNPs, an FRS agent was fabricated. The chemical, mechanical, and free radical scavenging properties of the nanocomposites were found favorable for cell compatibility and bone tissue regeneration. The nanocomposites were found to be cytocompatible and exhibit protective free radical scavenging properties under simulated oxidative stress using a murine pre-osteoblast cell line.(34)
In this manuscript, we investigated the in-vitro and in-vivo behaviors of the nanocomposites using human osteoblast primary cells (HObs). Compatibility studies were completed to validate that the nanocomposites were non-cytotoxic and could support HOb attachment, proliferation, and biomineralization. To examine the protective effects of the nanocomposite scaffolds, HObs seeded on scaffolds were placed under simulated oxidative stress using hydrogen peroxide to observe the effects on cellular viability and biomineralization. We also utilized a subcutaneous in-vivo rat model to observe biocompatibility of the nanocomposite scaffolds.(35) Nanocomposites were implanted into subcutaneous pockets for 7- and 30-days. After each time point, samples were collected for histological analysis to study the interaction between the nanocomposites and local tissue. We were able to measure cell infiltration into the nanocomposite scaffolds, a vital property for cell remodeling of the scaffold to create bone.(27),(33),(36) The formation of a fibrous capsule around the perimeter of the scaffolds and thickness was also measured as a means to quantify foreign body response.(36)–(39) We were also able to capture signs of biodegradation after implantation in-vivo.
MATERIALS and METHODS
Scaffold Fabrication Materials
Precursors, citric acid and 1,8 octanediol (Sigma Aldrich, St. Louis, MO), were combined to synthesize POC prepolymer solution. Medical grade β-TCP nanoparticles, 100 nm in diameter, were incorporated into the nanocomposites as an osteoconductive additive (Berkeley Advanced Biomaterials, San Leandro, CA). CNPs (Sigma Aldrich), <25 nm in diameter, and sodium chloride (salt) (Sigma Aldrich) were integrated into the nanocomposite as an FRS agent and porogen, respectively. CNPs were fabricated using a proprietary method by Engi-Mat and purchased by our group from Sigma Aldrich. The size of the particles was confirmed by the vendor to be <25nm by BET (Brunauer, Emmett and Teller) method. To achieve the desired porogen size, a coffee grinder was used to pulverize the salt followed by size exclusion using a sieve to isolate salt between 250 and 300 µm in size.
Scaffold Fabrication
POC was synthesized using the previously described.(40) Briefly, 1, 8 octanediol and citric acid were melted at 165 °C. After melting, the temperature was reduced to 140 °C and the reaction was held for approximately 1 hour and 45 minutes before being quenched on ice. The POC was then dissolved in 200 proof ethanol (Decon Labs, Inc., King of Prussia, PA), purified in nanopure water, and lyophilized. The remaining POC was dissolved in ethanol to make a 30 wt. % POC pre-polymer solution.
The composite scaffolds are created using the POC pre-polymer solution. This solution is mixed with NaCl, β-TCP, and CNPs. The scaffolds are 65 wt. % POC and 35 wt. % blend of β-TCP and CNPs. The CNPs were added at either 10 wt. % or 20 wt. % relative to POC. Scaffolds with POC or POC and β-TCP only are referred to as P and PT. The scaffolds containing 10 and 20% CNPs are referred to as PTC10 and PTC20, respectively. (34) Once all components are mixed in a Teflon dish, they are packed and crosslinked at 80 °C for 3 days. The scaffolds were then carefully taken out of the dish and placed in deionized water to remove the NaCl, resulting in a porous network. The scaffold is then bored to create smaller scaffolds measuring 3 mm in diameter by 3 mm in height for in-vitro studies and approximately 6.5 mm by 3 mm for in-vivo studies. The samples were sterilized using ethylene oxide gas (Anprolene AN74i, Haw River, NC) prior to all biological experiments.
Osteoblast Cell Culture and Biocompatibility
Human Osteoblast Cell Culture
Primary human osteoblast cells (HObs) purchased from Cell Applications Inc. (San Diego, CA) were used to further assess the cell interactions between osteoblast cells and nanocomposite scaffolds. The HObs were harvested from a single donor and stored at cryogenic temperatures in liquid nitrogen upon arrival and after expansion. Cells were cultured in Human Osteoblast Growth Medium (HObGM) (Cell Applications Inc., San Diego) supplemented with 1% penicillin-streptomycin (Corning, Corning, NY). In studies where mineralization was investigated, the cells were seeded in HObGM for one day, as instructed by vendor, Cell Applications, and the media was changed to Human Osteoblast Differentiation Medium (HObDM) (Cell Applications Inc.) supplemented with 1% penicillin-streptomycin (Corning) as well. All media was changed every 2–3 days and cells were cultured into humidified incubators at 37°C and 5% CO2.
Cell Attachment
To study cell attachment, nanocomposite scaffolds were seeded with HOb cells, ~21 mm3, at a density of 40,000 cells per scaffold. After seeding, the cells were cultured on the scaffolds for seven days in HOb growth medium in a 24 well ultra-low attachment plate (Corning, Corning, NY). After seven days, the scaffolds were rinsed with phosphate buffered saline (PBS) (Corning, Corning, NY) and fixed in a 2.5% (v/v) glutaraldehyde solution for 30 minutes at 4 °C. After fixation, the scaffolds were washed deionized water (ddH2O) and dehydrated in graded ethanol solutions ranging from 25% to 100% (v/v) in ddH2O. The samples were then lyophilized (Labcono, Kansas City, MO), overnight before mounting for scanning electron microscopy (SEM). To ensure sufficient conductivity for imaging the nanocomposites were coated with gold-palladium. The samples were imaged using SEM (Phenom ProX, ThermoFisher Scientific, Waltham, MA) with a beam energy of 15 keV.
Cell Viability
A colorimetric lactate dehydrogenase (LDH) cytotoxicity assay kit (Thermo Scientific Pierce, Waltham, MA) was used to quantify cell viability. LDH is a cytosolic enzyme within cells and is released into the media when the cell membrane has been compromised.
All scaffold variants, PT, PTC10, and PTC20, of about 21 mm3, were seeded with HObs at a density of 40,000 cells per scaffold (n=6) and grown in HObGM for seven days. Maximum LDH release was determined by lysing a subset of samples with the kit provided lysis buffer. Media supernatant was assayed for soluble LDH in accordance with the kit manufacturer’s protocol read at 490 nm and 680 nm using a Synergy H1 spectrophotometer (BioTek, Winooski, VT). Percent cytotoxicity was calculated (Equation 1) by dividing the OD from each sample by the average OD calculated from the maximum LDH samples respective to their scaffold type. The % cytotoxicity was then subtracted from 100% to obtain % cell viability which was then averaged per each nanocomposite.
| (1) |
Cell Proliferation
HOb cell number was measured using fluorometric DNA quantification to determine cell proliferation through mineralization on scaffolds. HObs were seeded onto scaffolds (n=4), at a density of 40,000 cells per scaffold. Sample collection occurred at time points of 3, 7, 14, 28, and 35 days. Scaffolds were washed with PBS to remove media and transferred to microcentrifuge tubes for homogenization (Bel-Art, Wayne, NJ) and stored at −80°C until processing. Genomic DNA (gDNA) was isolated using a combination of proteinase-K lysis buffer, scaffold homogenization, and ethanol precipitation. Equal volumes of the diluted sample (1:10) and Quant-it solution were combined and incubated for 5 minutes. The fluorescent intensity was measured using Synergy H1 Spectrophotometer with excitation and emission at 480 nm and 520 nm, respectively. A standard curve was created using a series of known cell numbers to extrapolate cell number from the fluorescent intensity.
In-Vitro Mineralization
HObs were seeded onto the nanocomposite scaffolds (n=4) (~21 mm3) at a density of 40,000 cells per sample to measure biomineralization after 14, 28, 35 days in culture. After one day of incubation in HOBGM, the samples were changed to HObDM to drive the cells toward mineralization. At each time point, samples were washed with PBS to remove media and fixed with ice-cold 70% ethanol for one hour at 4°C. The samples were washed with ddH2O and stained with 40 mM Alizarin Red Stain (ARS) (Sigma Aldrich, St. Louis, MO) for 20 mins at room temperature on an orbital shaker and washed to remove the unbound stain with ddH2O until the water was clear. The stain was solubilized in 500 µL 10% cetylpyridinium chloride (CPC) solution in ddH2O overnight. Aliquots of 100 µL were read in duplicate per sample type at 550 nm using a Synergy H1 Spectrophotometer to measure the OD of ARS.
Cell Viability Under Induced Oxidative Stress
A colorimetric lactate dehydrogenase (LDH) cytotoxicity assay kit was modified to quantify the amount of LDH released by cells that are damaged when exposed to simulated oxidative stress via hydrogen peroxide. HOb cells were seeded in HObGM onto nanocomposite scaffolds (n=4), ~21 mm3, at 40,000 cells per scaffold in a 24 well ultra-low attachment plate (Corning) in HObGM media. After two days, the media was changed to either 1) HObGM media, 2) HObGM containing 1 mM H2O2, or 3) HObGM with the addition of the kit provided lysis buffer for maximum cytotoxicity. The nanocomposite scaffolds were incubated for 2 hours, and the media was assayed for LDH concentration in accordance with the LDH kit protocol. Absorbance was read at 490nm and 680nm using a Synergy H1 spectrophotometer.
Mineralization Under Induced Oxidative Stress
HObs were seeded onto PT, PTC10, and PTC20 scaffolds (n=4) at a density of 40,000 cells per scaffold in HObGM and incubated overnight to allow for cell attachment. The scaffolds were then washed with PBS and the media was changed to either HObDM (Normal), or HObDM with 250 µM H2O2 (H2O2) for 24 hours. Following 24 hours, the media was changed on both sample types to HObDM and the cells were grown on the scaffolds for 20 days. Cytotoxicity after oxidative stress for 24 hours was also quantified using a pierce LDH cytotoxicity assay. After 20 days, the scaffolds were washed with PBS, fixed with ice-cold 70% ethanol for one hour at 4°C, washed with ddH2O, and stained with 40 mM ARS (Sigma Aldrich) for 20 mins at room temperature on an orbital shaker. Unbound stain was removed from the scaffold with ddH2O until the water is clear. Samples with no cells seeded (Initial) were collected and analyzed to provide an initial value of calcium content for the nanocomposites. The stain was removed from the scaffolds by 500 µL 10% CPC solution in ddH2O overnight and 100 µL aliquots of CPC and ARS supernatant were read in duplicate at 550 nm using a Synergy H1 Spectrophotometer.
In-Vivo Subcutaneous Model
Animals and Surgery Procedure
A power analysis of experiments performed in previous in-vivo bone studies were completed.(38),(41) A power interval of 80% and a confidence interval of 0.05 was used to determine that a minimum of four animals were required to detect statistically significant changes in cell infiltration and fibrotic capsule formation. 8-week old Sprague Dawley rats (Envigo, East Millstone, NJ) were used for this study. All animal procedures were performed following the Institutional Animal Care and Use Committee (IACUC) and the University of Florida’s Animal Care Services policies. In addition, NIH guidelines for the care and use of laboratory animals (NIH Publication #85–23 Rev. 1985) have been observed
All surgical equipment and scaffolds were sterilized using either ethylene oxide (Anprolene) or a steam autoclave (Tuttnauer, Hauppauge, NY). Buprenorphine SR was administered subcutaneously before surgical procedures were performed. The animals were anesthetized using 3–5% isoflurane (Patterson Veterinary, Greely, CO) and oxygen. The dorsum was shaved and cleaned with three povidone-iodine (Med-Vet International, Mettawa, IL) and 70% isopropanol (Fisher Chemical, Waltham, MA) washes. Four subcutaneous pockets were formed by blunt dissection and one nanocomposite scaffold (P, PT, PTC10, PTC20) was placed in each pocket. The nanocomposite scaffolds were hydrated for about 20 minutes with sterile saline prior to implantation. Each of the pockets contained a different scaffold, P, PT, PTC10, PTC20 (Fig. 5). At each time point, the animals were sacrificed, and the scaffolds explanted.
Figure 5.
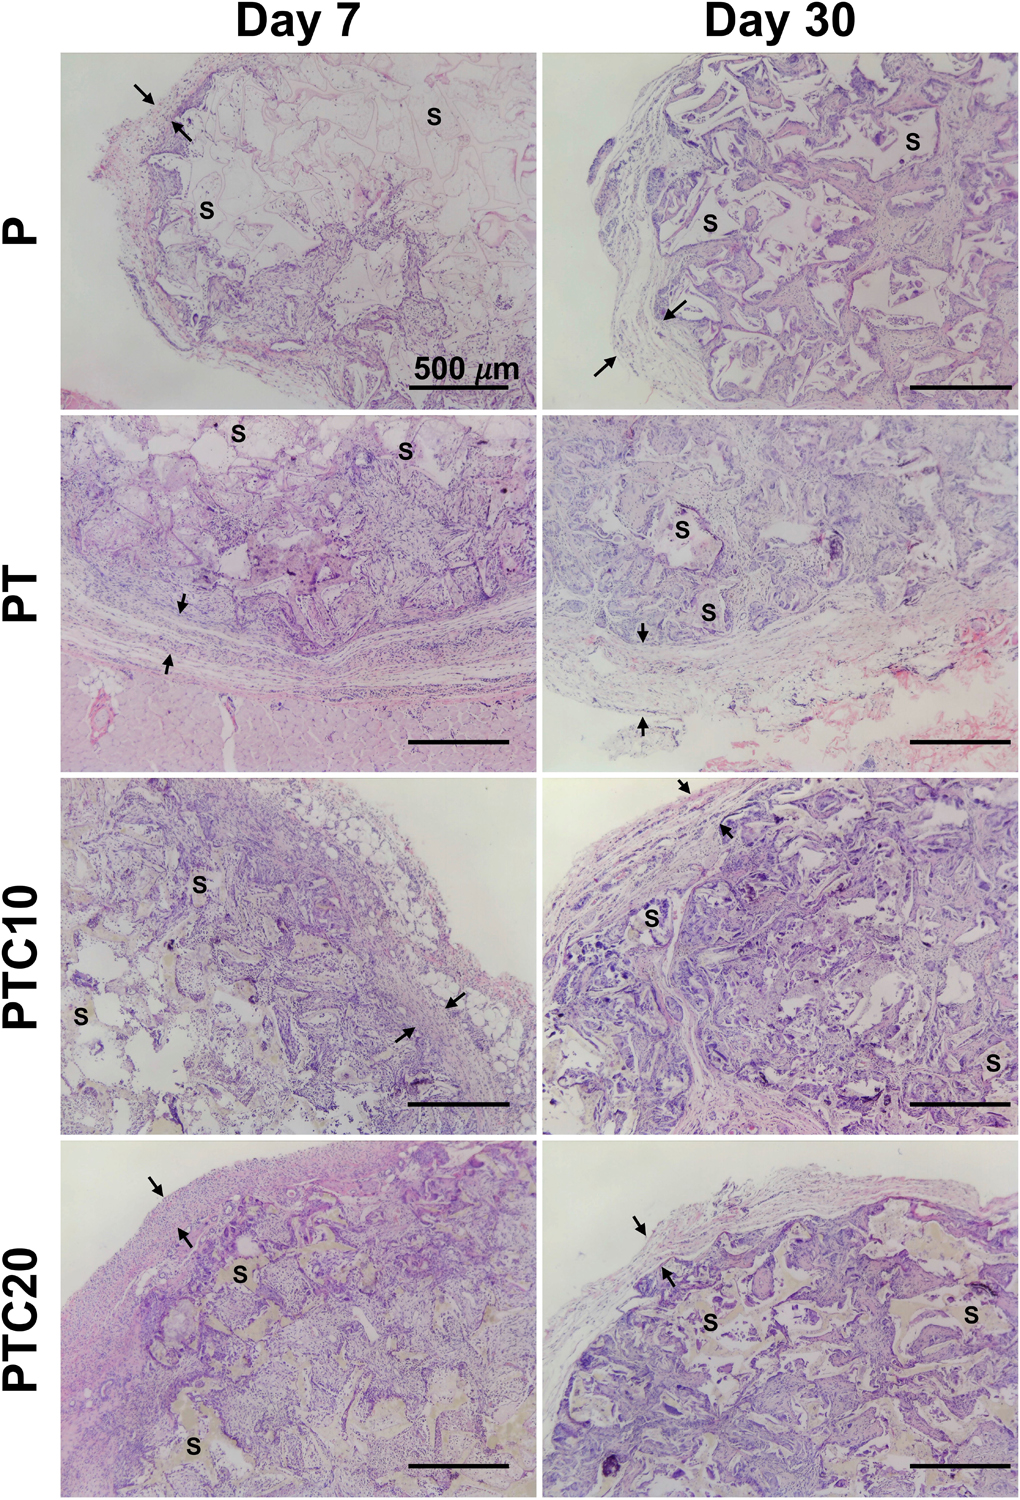
Representative micrographs of H&E stained sections of scaffold focusing on cell infiltration and fibrotic capsule. The scaffold was identified using S and fibrotic capsule denoted between two arrows, nuclei are stained purple, and cytoplasm pink.
Tissue Preparation and Histology
Tissues were explanted from animals at 7- and 30-days tissues and fixed in a buffered 10% formalin solution (Fisher Chemical, Waltham, MA) at 4 °C for 48 hours. After 48 hours, the formalin was removed, and the fixed tissues were washed and stored in 70% ethanol (Decon Labs). Processing and paraffin embedding of the samples was completed by the University of Florida’s Molecular Pathology Core. Samples were sectioned at a thickness of 7 µm using a Microm HM355S (Thermo Fisher Scientific, Waltham, MA) Three sections were placed onto one poly-l-lysine coated microscope slide (Electron Microscopy Science, Hatfield, PA) and subsequently dried overnight in an oven at 25°C to remove residual water.
Hematoxylin and eosin staining procedure
Hematoxylin (RICCA Chemical Company, Arlington, TX) and Eosin Y (RICCA Chemical Company, Arlington, TX) were purchased to stain cell nuclei (hematoxylin) and cytoplasm (eosin) to visualize cellular infiltration and fibrous capsule formation. Sections were first deparaffinized and rehydrated in xylenes and graded ethanol solutions, respectively. Slides were stained with Hematoxylin for one minute and rinsed under running ddH2O for 5 minutes. The slides were placed into a 95% ethanol solution for one minute and stained with Eosin Y for 20 seconds. The sections were then rinsed and dehydrated in graded ethanol and cleared in xylene. Glass coverslips (Fisher Scientific, Hampton, NH) were mounted using Cytoseal 60 (Richard Allen Scientific, San Diego, CA) and left overnight to dry.
Cell Infiltration
Cell infiltration was determined using H&E staining to observe the migration of cells into the scaffold over 7- and 30-days. Three sections per scaffold were imaged and analyzed using a handheld microscope (Celestron, Torrance, CA) and ImageJ software (NIH), respectively, to observe and quantify infiltrated cell nuclei (Fig. 5). Cell nuclei within the scaffold were isolated via color thresholding. The “Analyze Particles” function in ImageJ was used to quantify the nuclei within the limits of the scaffold. To ensure the analysis was objective, all 7-day and 30-day samples were quantified with the same thresholding conditions and all samples had the same particle size thresholding, 1×10⁻⁴ mm2. The averaged section replicates created a total of 4 measurements per scaffold type from each respective animal. These resulting values were then averaged (n=4) to determine the average number of infiltrated cell nuclei for each scaffold type after 7- and 30-days of implantation.
Fibrotic Capsule
H&E staining was also used to identify fibrotic capsule formation around the perimeter of the implanted scaffolds. The fibrotic capsule was determined by the formation of dense collagen banding surrounding the scaffold. To quantify the average thickness of the fibrotic capsule, scaffolds from 4 animals were analyzed using ImageJ software (NIH). A total of 3 sections were studied per scaffold type. To quantify capsule thickness, three measurements of the capsule surrounding the scaffolds were taken from each section and averaged to create a total of 4 measurements per scaffold type from each respective animal. These resulting values were then averaged (n=4) to determine the average fibrotic capsule thickness or each scaffold type after 7- and 30- days of implantation.
Change in Scaffold Size
Scaffold dimensions were measured after 7- and 30-days to determine if there was a change in scaffold size after implantation. The difference in dimension could be an indication of degradation over time. H&E stained sections were used to identify the edges of the scaffolds to measure width and height, this provided an accurate method to define the scaffold borders since the scaffold was enveloped in a fibrotic capsule which would interfere in measurements. Each scaffold section (three sections per scaffold) was measured three times horizontally and vertically in different areas to measure scaffold width and height, respectively. The analyzed sections were not sequential to each other providing measurements at various thicknesses throughout the implanted scaffolds. This analysis resulted in a total of 9 measurements that were averaged together for both width and height per scaffold type in each animal. An aspect ratio was calculated by dividing the average scaffold width by the average scaffold height. After calculating the average aspect ratio per scaffold per animal, each aspect ratio value was averaged together (n=4) to determine average aspect ratio per scaffold. Averages for both width and height were also calculated.
Statistical Analysis
All numerical data will be reported as the mean ± standard deviation. Outliers were determined using the ROUT method (Q=1%). Statistical significance was assessed using a one-way or two-way analysis of variance test (ANOVA) with a Tukey’s or Sidak’s multiple comparisons post-hoc analysis. All samples had an α = 0.05 and a p-value <0.05 was used to confirm statistical significance.
RESULTS
Scaffold Fabrication
The morphology of the nanocomposite scaffolds was imaged using a Handheld Digital Microscope Pro (Celestron, Torrance, CA). The images allowed us to better visualize the porous network of the scaffolds created using a particulate leaching fabrication method (Fig. 1).
Figure 1.
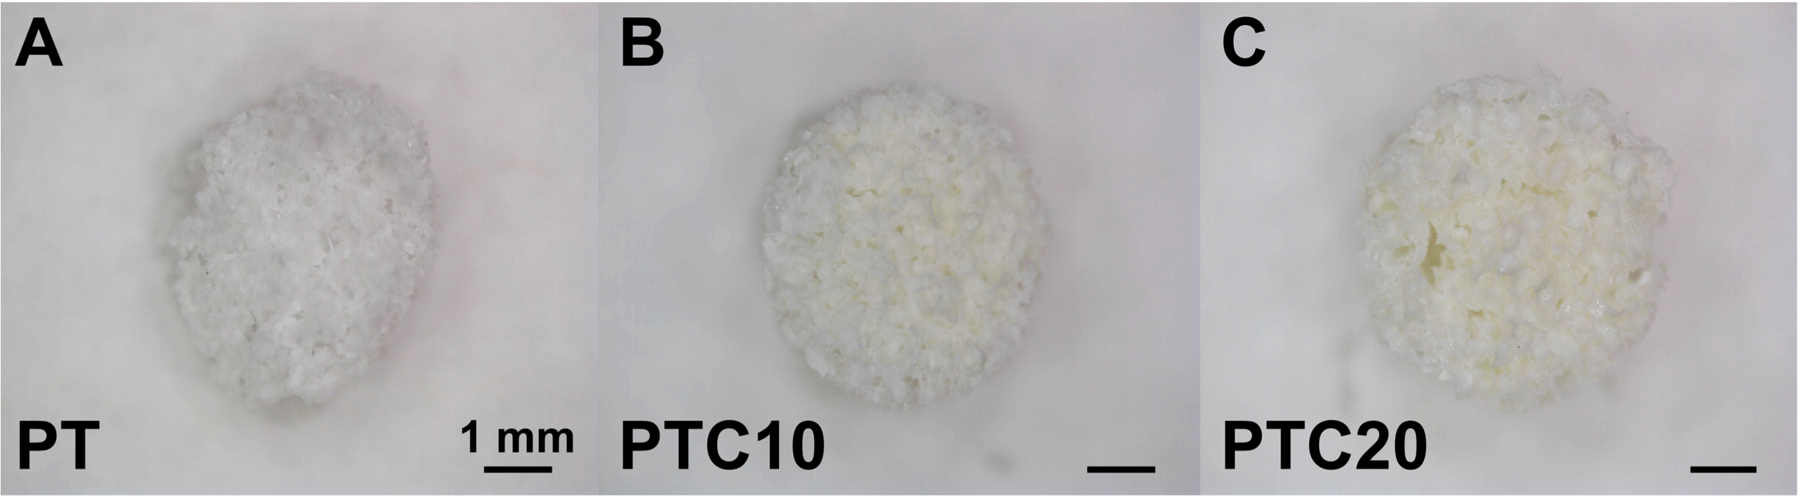
Digital microscopy images of the nanocomposite scaffolds. a) PT, b) PTC10, c) PTC20.
Osteoblast Cell Culture and Biocompatibility
Cell Attachment
Nanocomposite scaffolds seeded with HOb cells were imaged using SEM to visualize cell attachment to the surface of PT, PTC10, and PTC20 nanocomposite scaffolds. To serve as a base for comparison scaffolds with no cells seeded were imaged (Fig. 2 (a–c)). HObs were imaged after seven days and showed promising cell attachment to each scaffold surface, highlighted with arrowheads (Fig. 2 (d–f)). HObs spread across the scaffold surfaces (pore walls) creating smooth, web-like structures unlike the rough surface of the scaffold alone. HOb cells demonstrated attachment to the scaffold itself through the formation of sheets, but in a few instances also showed cell sheets branching across open pores to reach opposing edges the pore walls to sprawl continue their spread over more of the scaffold surface.
Figure 2.
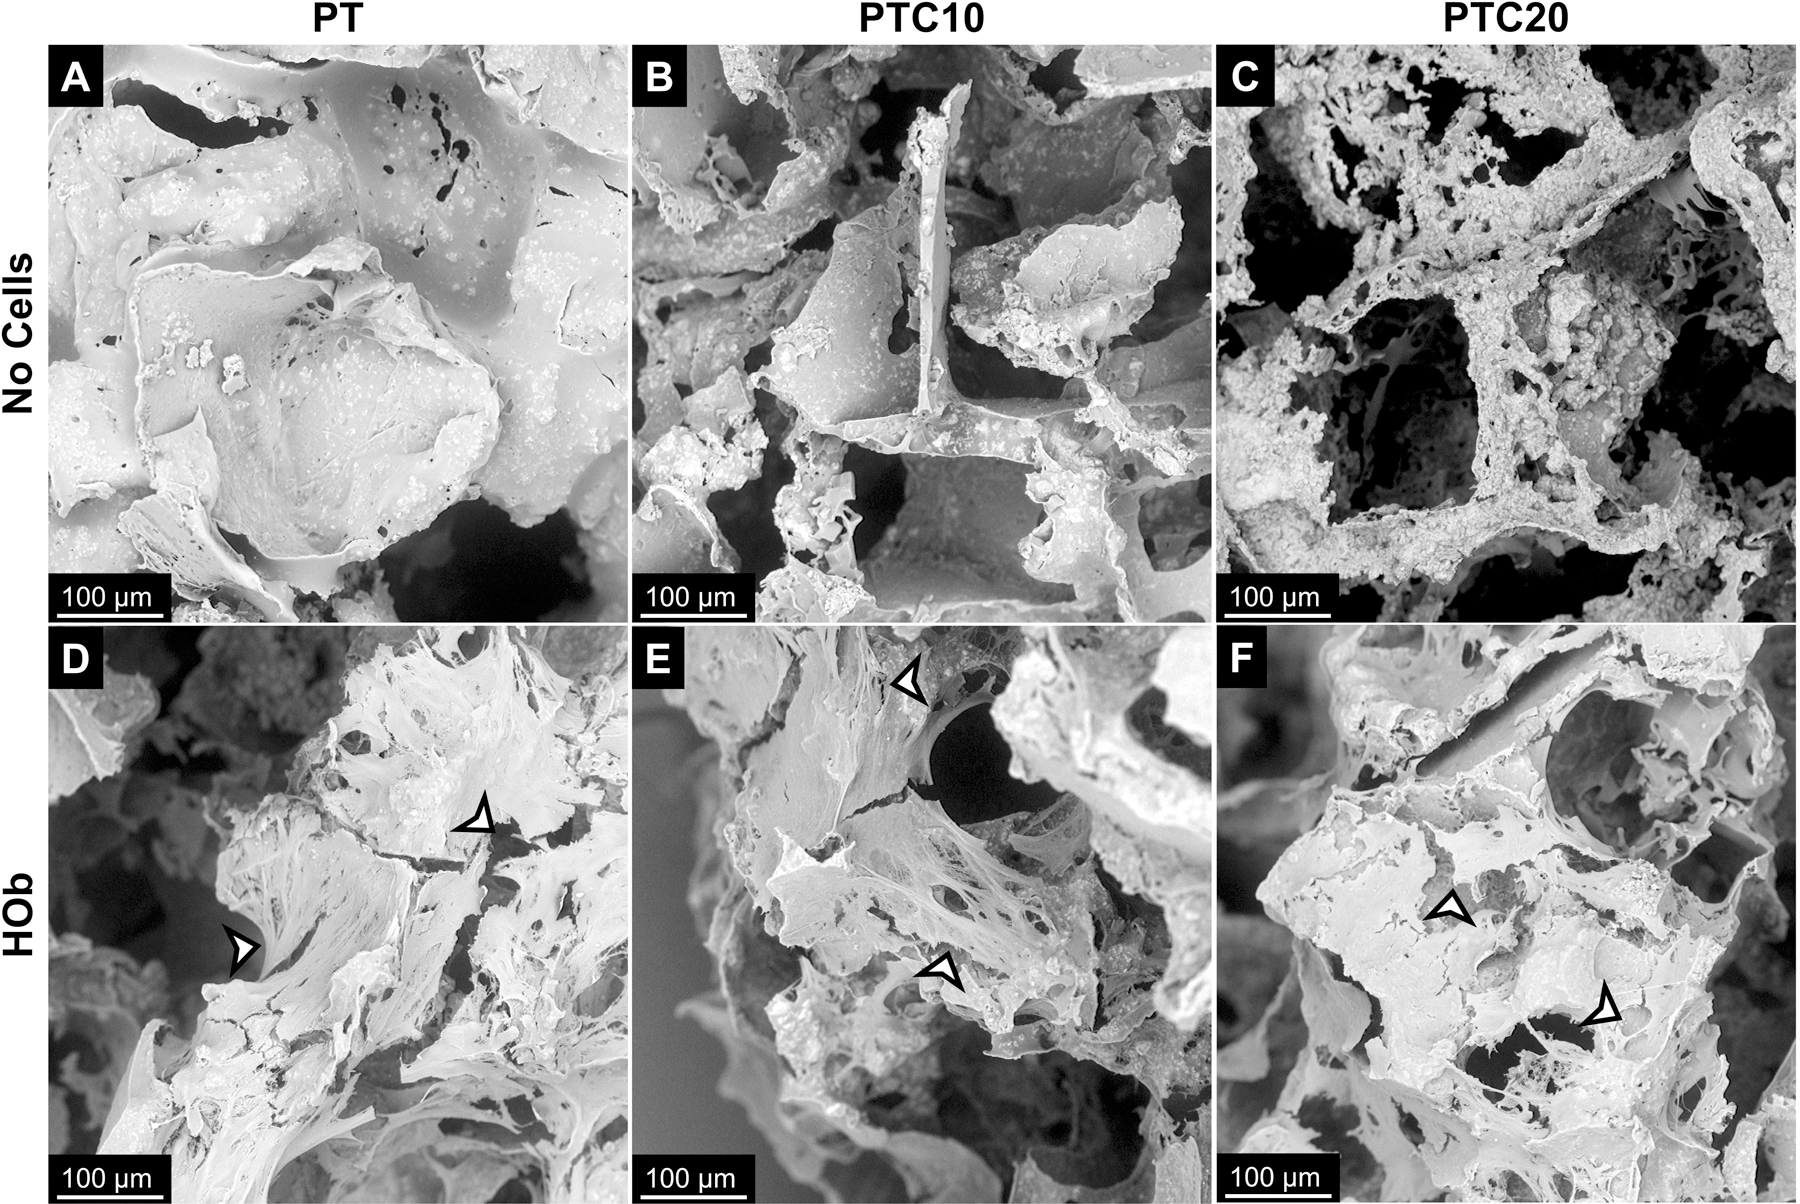
Representative scanning electron micrographs of cell attachment to PT, PTC10, and PTC20 scaffolds after 7 days of culture. (a-c) Scaffolds with no cells were used as a reference for no attachment. Attachment of (d-f) human osteoblast cells to the surface of nanocomposites highlighted by arrowheads.
Cell Viability
The viability of HOb cells was determined by quantification of the enzyme LDH which is indicative of cellular damage and cytotoxicity. HOb viability was measured after seven days in culture on all nanocomposite variants (Fig. 3 (a)). Percent viability of the HObs on PT, PTC10, and PTC20 scaffolds were 94.41 ± 1.36%, 88.42 ± 5.25%, and 89.86 ± 5.22%, respectively. A one-way ANOVA and Tukey’s multiple comparisons test determined that there was a statistical significance in the viability of cells grown on PT scaffolds compared to cells on both PTC10 and PTC20 scaffolds (α=0.05, p=0.0038, p=0.0387). There was not a statistically significant difference in cell viability between PTC10 and PTC20 scaffolds. All levels of cell viability for MC3T3s and HObs were above 80% indicating low amounts of cytotoxicity.
Figure 3.
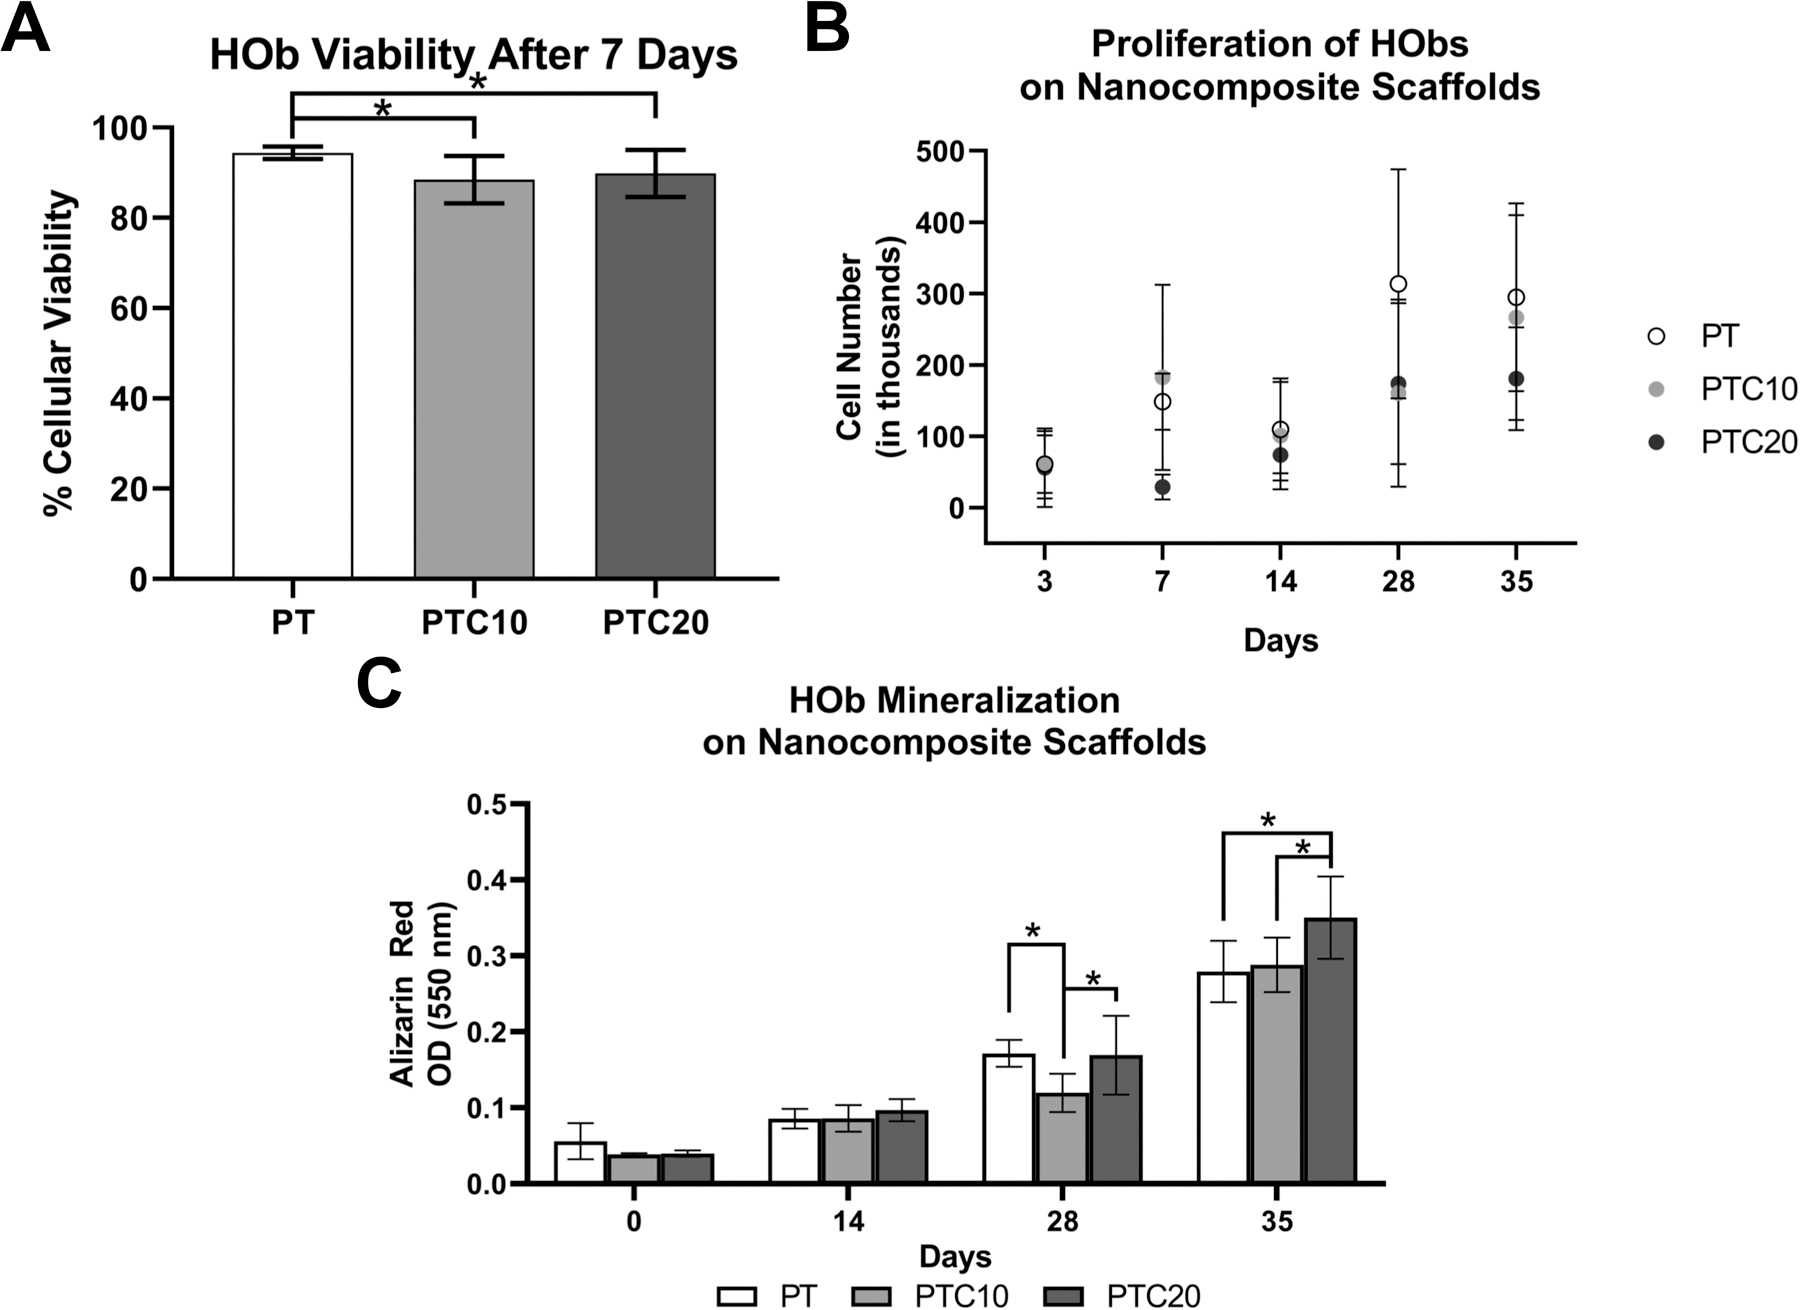
In-vitro biocompatibility of human osteoblasts on nanocomposite scaffolds. (a) Viability of HOb cells seeded onto scaffolds (n=6). (b) Quantification of DNA to determine cell proliferation and growth on scaffolds over 35 days. (c) Quantification of ARS stain to measure mineralization by HObs over 0, 14, 28, and 35 days. Averages were reported as mean ± standard deviation, statistically significant change is denoted by the * symbol.
Cell Proliferation
To determine HOb proliferation and growth on the nanocomposite scaffolds, DNA was quantified using with a fluorometric Picogreen assay. Average HOb cell number was extrapolated using a standard curve formed using a range of known cell numbers (Fig. 3 (b)). (Table 1) The average cell numbers were analyzed for statistical significance using a two-way ANOVA with a Tukey’s multiple comparisons post-hoc analysis. When comparing average cell number across a length of time in culture within respective scaffold types, we found that the only statistically significant increases in cell number were between days 14 and 28 for PT scaffolds and 3 and 7 for PTC10 scaffolds (α=0.05, p<0.0001, p=0.0356). When comparing nanocomposite variants at specific time points, we saw statistically significant differences between the following scaffold types. On day 7, there were statistically significant increases seen between both PT and PTC10 scaffolds compared to PTC20 scaffolds (α=0.05, p=0.0285, p=0.0023). On day 28, there was a statistically significant increase in cell number on PT scaffolds in comparison to both PTC10 and 20 nanocomposites (α=0.05, p=0.0024, p=0.0069). Finally, on day 35, there was a statistically significant increase in cell number on PT scaffolds compared to PTC20 scaffolds (α=0.05, p=0.0393).
Table 1.
HOb cell number, indicative of proliferation, on PTC scaffolds over 35 days.
| Scaffold | Day 3 | Day 7 | Day 14 | Day 28 | Day 35 |
|---|---|---|---|---|---|
| PT | 61003 ± 40400 | 148461 ± 39646 | 109760 ± 71626 | 313482 ± 160730 | 295010 ± 131604 |
| PTC10 | 60029 ± 47511 | 182590 ± 129799 | 100851 ± 75253 | 160467 ± 131260 | 266423 ± 143638 |
| PTC20 | 56206 ± 55129 | 29211 ± 17560 | 73992 ± 25552 | 173932 ± 112675 | 180824 ± 71993 |
In-Vitro Mineralization
HObs were cultured on the nanocomposite scaffolds for extended periods of time, 14, 28, and 35 days, to observe their mineralization behavior (n=4). ARS stain was then extracted using CPC and the OD was measured for each nanocomposite at each time point (Fig. 3 (c)) (Table 2). Outliers in PT D28 and PTC10 D0 scaffolds were identified and removed using the ROUT method (Q=1%). Using a two-way ANOVA and Tukey’s multiple comparisons test, it was determined that there were no statistically significant differences in mineralization between all scaffold types at both D0 and D14 timepoints. At D28, mineralization on PTC10 scaffolds was significantly lower than both PT and PTC20 scaffolds (α=0.05, p=0.0064, p=.0048). At D35, PTC20 scaffolds had a significantly higher level of mineralization in comparison to both PT and PTC10 scaffolds (α=0.05, p<0.0001, p=.0003). For each scaffold type, there were increases in mineralization with increasing culture time. PT scaffolds had statistically significant increases in mineralization between D14 to D28 and D28 to D35 (α=0.05, p=<0.0001, p=<0.0001); PTC10 scaffolds experienced significant increases in mineralization between D0 to D14 and D28 to D35 (α=0.05, p=0.0259, p<0.0001); and PTC20 scaffolds were the only variant to have statistically significantly increase mineralization between every timepoint, D0 to D14, D14 to D28, and D28 to D35 (α=0.05, p=0.0020, p<0.0001, p<0.0001).
Table 2.
Quantification of HOb mineralization over 35 days as measured by OD of ARS
| Scaffold | Day 0 | Day 14 | Day 28 | Day 35 |
|---|---|---|---|---|
| PT | 0.056 ± 0.024 | 0.086 ± 0.013 | 0.17 ± 0.02 | 0.28 ± 0.04 |
| PTC10 | 0.039 ± 0.002 | 0.086 ± 0.017 | 0.12 ± 0.03 | 0.29 ± 0.04 |
| PTC20 | 0.040 ± 0.004 | 0.097 ± 0.015 | 0.17 ± 0.05 | 0.35 ± 0.05 |
Cell Viability Under Induced Oxidative Stress
An LDH cytotoxicity assay was used to determine the percent cytotoxicity of HOb cells on nanocomposite scaffolds after acute exposure to a 1 mM hydrogen peroxide media solution to determine the protective effects of the nanocomposites (Fig. 4 (a)). The resulting percent cytotoxicity values of HObs after induced oxidative stress for PT, PTC10, and PTC20 scaffolds were: 33.12 ± 9.67%, 37.22 ± 3.08%, and 36.99 ± 8.14%. An ANOVA with a Tukey’s post-hoc determined that there were no statistically significant differences in cell cytotoxicity between PT, PTC10, and PTC20 scaffolds after induced oxidative stress.
Figure 4.
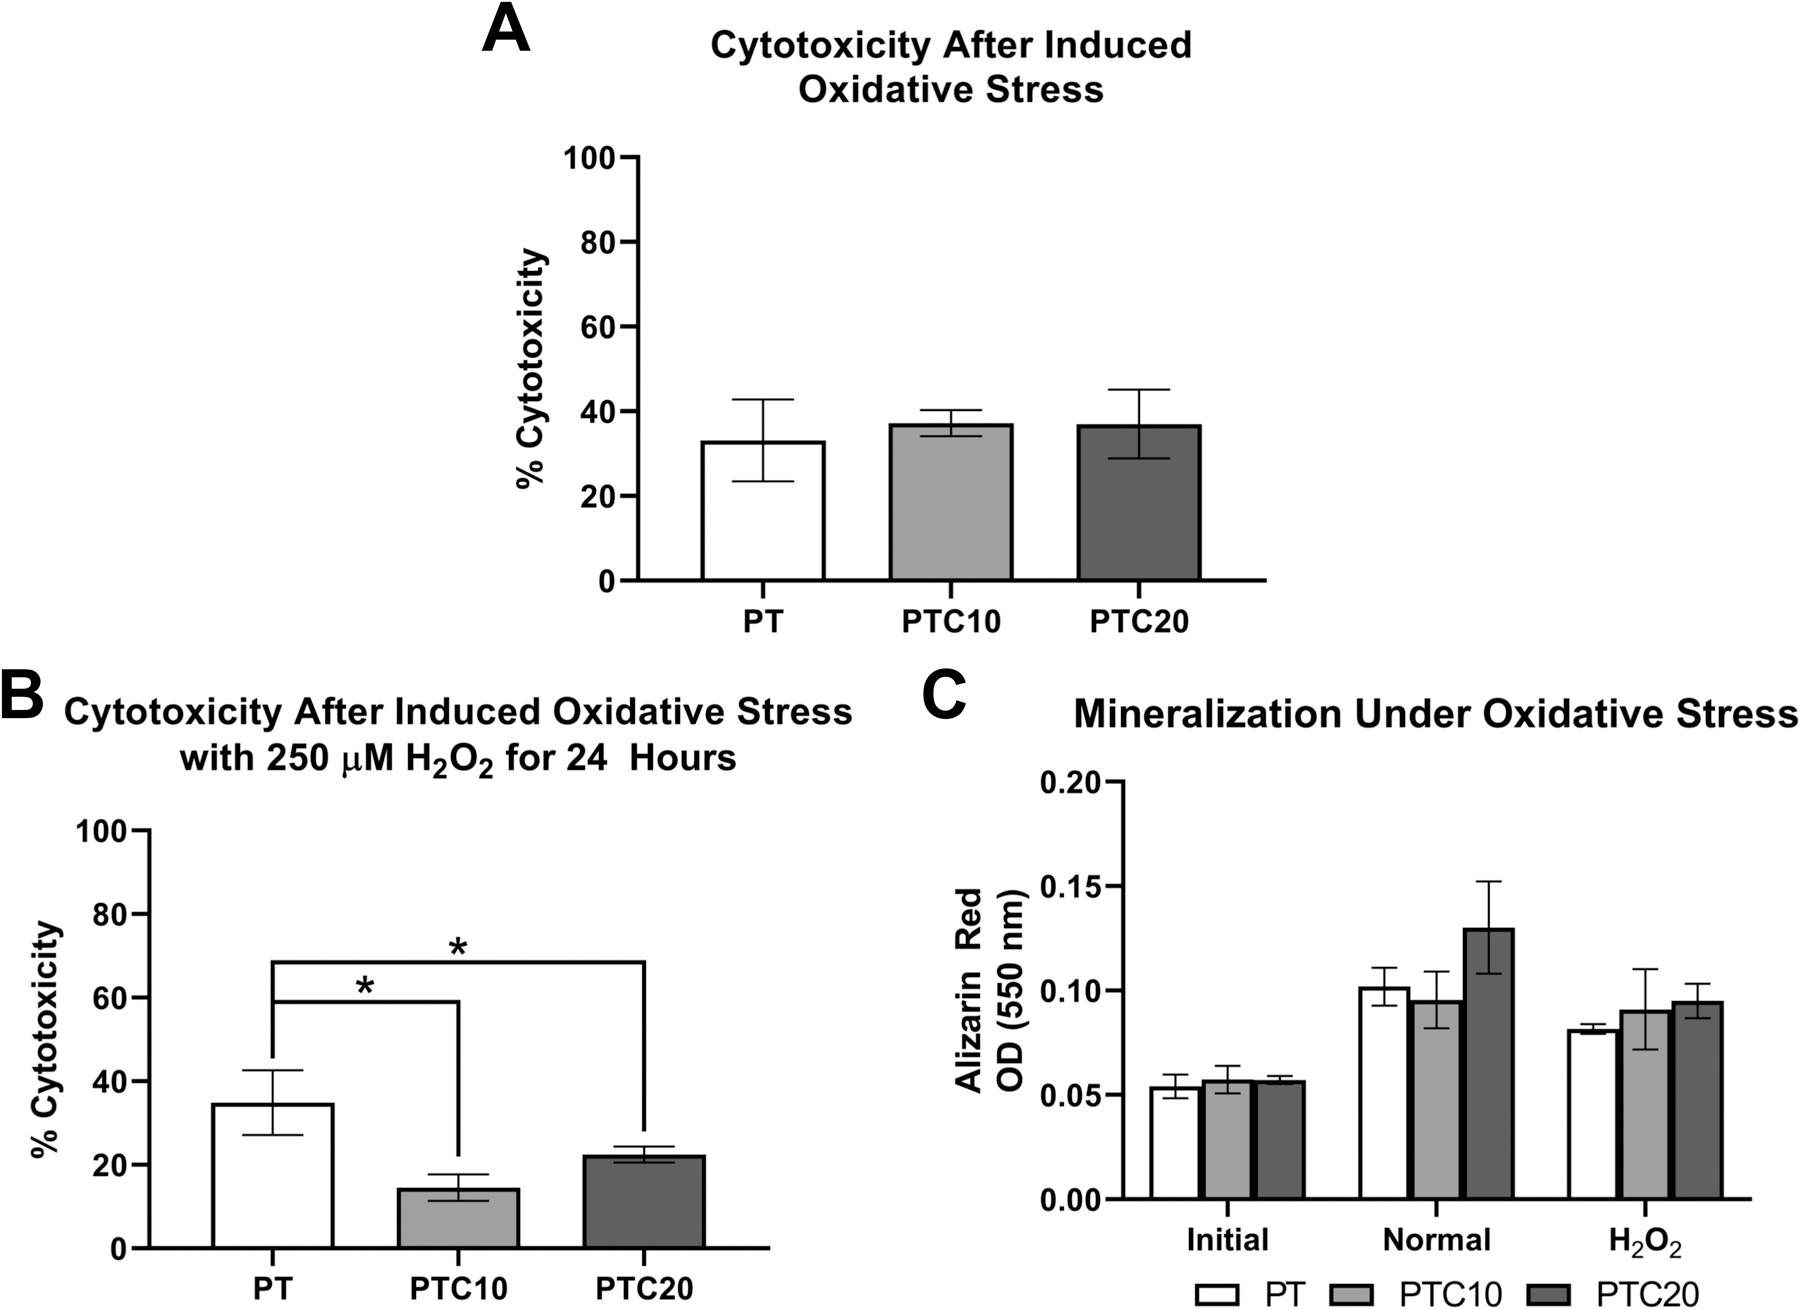
In-vitro Hob viability and mineralization after induced oxidative stress. (a) Percent cytotoxicity of HObs on nanocomposite scaffolds and exposed to 1mM H2O2 for 2 hours (n=3). (b) Percent cytotoxicity of HObs on nanocomposite scaffolds and exposed to 250 µM H2O2 over 24 hours (n=3). (c) Quantification of ARS to determine the effect of HOb mineralization after oxidative stress (n=4). Averages were reported as mean ± standard deviation, statistically significant changes are denoted by the * symbol.
Mineralization Under Induced Oxidative Stress
To observe the effects of oxidative stress on osteoblast function scaffolds were stained with ARS to compare the degree of mineralization after 20 days between HObs on scaffolds cultured in HObDM (Normal) versus exposure to 250 µM H2O2 (H2O2) for 24 hours and returned to HObDM. Scaffolds without cells seeded were collected to determine an initial level of calcium (Initial). Cellular cytotoxicity was measured after 24 hours of induced oxidative stress. The resulting cell percent cytotoxicity values were as follows (Fig. 4 (b)) : PT 34.87 ± 7.72%, PTC10 14.53 ± 3.19%, PTC20 22.46 ± 1.94%. Using a one-way ANOVA with a Tukey’s post hoc analysis, average cell cytotoxicity on PTC10 and PTC20 scaffolds were significantly lower than PT scaffolds (α=0.05, p=0.0007, p=0.0156). The amount of mineralization was then quantified by measuring OD of solubilized ARS. The OD from each scaffold and condition were as follows (Fig. 4 (c)): PT (Initial: 0.054 ± 0.006, Normal: 0.102 ± 0.009, H2O2: 0.082 ± 0.002); PTC10 (Initial: 0.057 ± 0.007, Normal: 0.096 ± 0.014, H2O2: 0.091 ± 0.019); PTC20 (Initial: 0.057 ± 0.002, Normal: 0.130 ± 0.022, H2O2: 0.095 ± 0.008). Outliers were removed from PT Initial and H2O2 PTC20 samples in accordance with a ROUT (Q=1%) analysis. The results were then analyzed using a two-way ANOVA and Tukey’s multiple comparisons test to identify statistically significant changes in mineralization. All scaffolds showed significantly increased mineralization in comparison to the initial scaffolds. There was a statistically significant decrease between normal and H2O2 conditions in PT and PTC20 scaffolds (α=0.05, p=0.001, p<0.0001). There was a significant increase in mineralization on PTC20 scaffolds in normal conditions compared to both PT and PTC10 scaffolds (α=0.05, p<0.0001, p<0.0001). There were no statistically significant differences between the three scaffold types exposed to oxidative stress.
In-Vivo Subcutaneous Model
Cell Infiltration
Cell infiltration allows us to examine the ability of cells to enter and grow into the scaffold over time. Cell infiltration into the nanocomposite scaffolds was qualitatively observed as well as measured using ImageJ to quantify nuclei stained using H&E. Representative images of H&E stained scaffolds at higher magnification (Fig. 5) demonstrates cells around scaffold portions (labeled S), purple stained nuclei, as well as the dense ring of cells toward the periphery of the scaffolds at day 7. After 30-days, there was cell infiltration through the thickness of the scaffolds.
Cell infiltration was quantified using ImageJ to count nuclei within the scaffold using the lower magnification images to ensure that all nuclei were accounted (micrographs not shown). Average nuclei counted for each nanocomposite type were as follows (Fig. 6 (a)): P (D7: 4623 ± 1657, D30: 6700 ± 2620), PT (D7: 8504 ± 1402, D30: 10693 ± 2412), PTC10 (D7: 10709 ± 3468, D30: 11394 ± 2933), PTC20 (D7: 8716 ± 4138, D30: 10346 ± 2169). A two-way ANOVA with a Tukey’s post-hoc was used to test for statistical significance between scaffold types at each time point. There was one statistically significant difference in nuclei quantification at day 7 between P and PTC10 scaffolds (α=0.05, p=0.0212). No other statistically significant changes in nuclei quantification between all scaffold types at each time point were observed. We also compared the change in nuclei amount for each scaffold type from 7- to 30-days using a two-way ANOVA and Sidak’s post-hoc and found that there were no significant differences in the number of nuclei counted from day 7 to 30 for all scaffold types.
Figure 6.
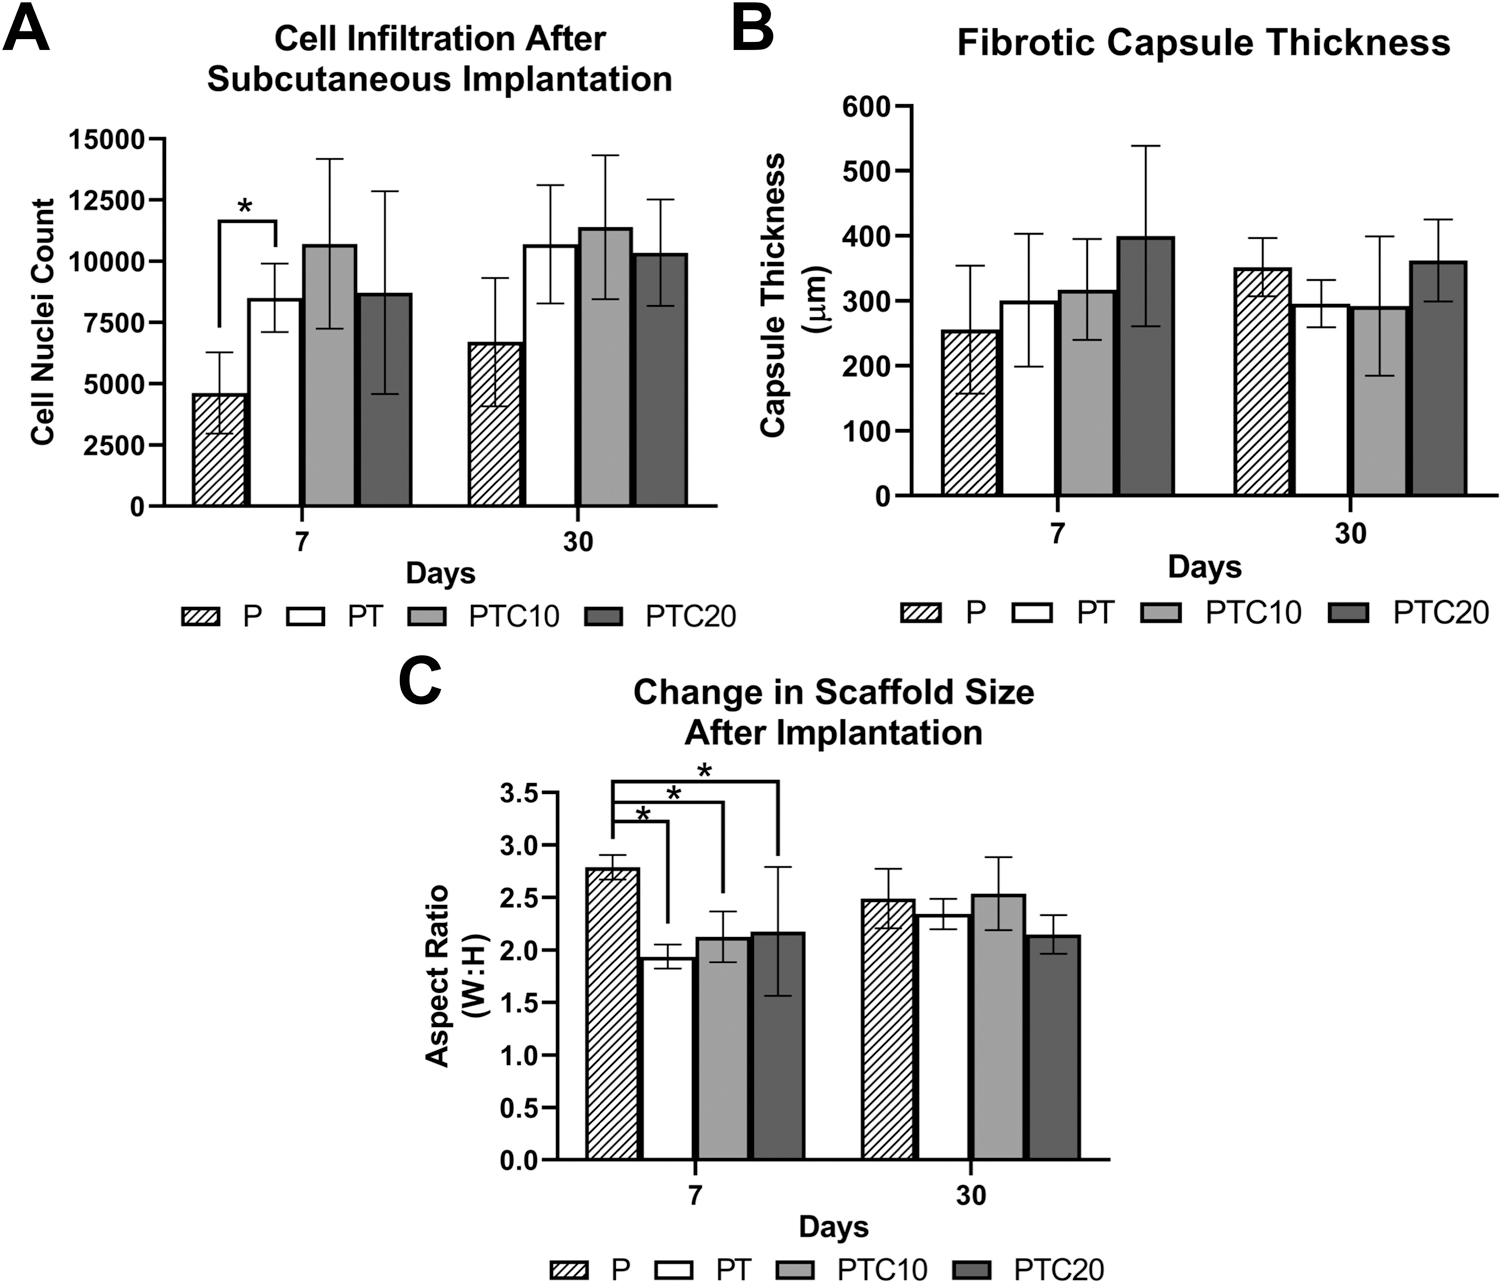
Quantification of subcutaneous tissue interactions with nanocomposite scaffolds in-vivo. (a) Quantification of cell nuclei within the nanocomposites to determine cell infiltration using ImageJ software. (b) Quantification of fibrotic capsule thickness around the nanocomposites using ImageJ software. (c) Quantification of scaffold aspect ratio (width: height) to determine the change in scaffold size over 30 days of implantation using ImageJ software. Averages were reported as mean ± standard deviation. Statistical significance is denoted with *.
Fibrotic Capsule
Fibrotic capsule thickness was quantified using ImageJ to measure the thickness of a dense collagen band in three locations around the periphery of the scaffolds (Fig. 5). Average fibrotic capsule thicknesses for each nanocomposite type were as follows (Fig. 6 (b)): P (D7: 255.89 ± 98.41 μm, D30: 351.92 ± 44.84 μm); PT (D7: 300.97 ± 102.19 μm, D30: 295.72 ± 36.68 μm); PTC10 (317.43 ± 77.75 μm, D30: 292.00 ± 107.13 μm); PTC20 (D7: 399.75 ± 138.99 μm, D30: 362.39 ± 62.99 μm). A ROUT analysis (Q=1) was used to determine outliers for removal in PTC10 samples at the day 7 timepoint. A two-way ANOVA with a Tukey’s post-hoc was used to test for statistical significance between the scaffold types within each time point, and a Sidak’s post-hoc was used to compare each scaffold type across timepoints. We found that there were no significant differences in the thickness of the fibrotic capsule between scaffold types and no change in thickness from day 7 to 30 for all scaffold types.
Change in Scaffold Size
A change in the size of the scaffolds was suspected during H&E imaging. To evaluate quantify this change, we used ImageJ to measure the widths and heights of each scaffold for each time point and aspect ratios were calculated. After 7-days, the average widths and heights were calculated (Fig. 6 (c)): P (D7: 2.79 ± 0.12, D30: 2.49 ± 0.28); PT (D7: 1.94 ± 0.12, D30: 2.34 ± 0.15); PTC10 (2.13 ± 0.24, D30: 2.54 ± 0.35); PTC20 (D7: 2.18 ± 0.62, D30: 2.15 ± 0.18). After 30-days, we found that there was an increase in the aspect ratio, implying that there was a decrease in scaffold heights. Using a two-way ANOVA with a Tukey’s post hoc, we found that there was only one significant difference in scaffold size on day 7 between P scaffolds and PT, PTC10, and PTC20 scaffolds, respectively (α=0.05, p=0.0067, p=0.0257, p=0.0427). When comparing nanocomposite dimensions from day 7 to day 30 using a two-way ANOVA with a Tukey’s post hoc, we determined that there were no statistically significant changes across each time point.
DISCUSSION
Biocompatibility is an essential parameter when designing scaffolds for bone tissue engineering. Confirmation that the material system does not elicit a negative response when in contact with cells is essential for the success of a biomaterial.(33),(42),(43) There are many ways to evaluate biocompatibility beginning in in-vitro cell studies and evolving to more complex studies utilizing in-vivo models.
In previous work, our group has investigated the physical, mechanical and biocompatibility properties of this scaffold system.(34) Using material characterization techniques such as energy dispersive x-ray spectroscopy and x-ray diffraction were confirmed the presence of both additives, β-TCP and CNPs over the surface of the composite using line and area scans. For initial testing, the biocompatibility and FRS properties of the scaffolds were studied using a murine pre-osteoblast cell line. Experiments were completed to measure viability, cell attachment, mineralization, and viability under oxidative stress. This testing provided the preliminary results required to continue onto research with human primary cells and in-vivo murine models.
To build on our previously published work utilizing a murine cell line, we sought to expand our work to a more clinically relevant cell types, human primary osteoblast cells. Baseline studies included cell attachment and viability of HObs on the surface of the nanocomposite scaffolds are methods to confirm compatibility. SEM micrographs showed HOb attachment to all three scaffold compositions: PT, PTC10, and PTC20 after 7 days of culture. HOb cells attached across the scaffold surfaces and branched across the porous network. This confirmed that the nanocomposite compositions were able to support the attachment of osteoblasts. Cellular viability of HObs after 7 days of culture was also measured. All three nanocomposites were confirmed to be non-cytotoxic as they maintained viabilities above 80%. Many studies involving CNPs have reported no significant decrease in cell viability after culture, such as Karakoti et al., Li et al., and Ball et al.(6),(17),(44) These studies allowed us to infer that the incorporation of CNPs did not affect cellular viability in HObs as the viabilities of all compositions were nearly within a 5% range of each other.
Measurement of the proliferation of the HObs after seeding on to the nanocomposites allowed us to track the growth behavior of the cells during mineralization. Across the 35 days of culture, we saw an overall increase in the cell number across the three nanocomposite variants. It has been reported that composite scaffolds containing bioactive elements such as calcium phosphates result in increased osteoconductivity. Therefore incorporating additives like β-TCP has become a common practice in bone tissue engineering.(22),(45)–(47) There is a plateau in the proliferation of HObs seeded on PTC20 scaffolds at both 28 and 35 day time points. This plateau could be attributed to the increased mineralization seen on the PTC20 scaffolds at these time points. Reduction in HOb proliferation during mineralization has been reported in many instances.(48),(49)
The next study focused on the mineralization potential of the HObs on the nanocomposites. Mineralization is a key function of osteoblasts during bone formation and repair and the ability of the cells to undergo this process in-vitro is a positive indicator for the nanocomposites in bone tissue engineering applications. There was increased mineralization by HObs the longer the cells were cultured on the nanocomposites. At the 35-day time point, there was an increase in average mineralization with the increasing CNP value, where PTC20 scaffolds were significantly more mineralized compared to the other two systems. This increase could be a result of the increase in CNP concentration. Zhou et al. reported a qualitative increase in ARS staining of the mineralized matrix by HObs exposed to CNPs.(50) Groups such as Zhou et al. and Xiang et al. reported increased cellular viability, proliferation, and stimulated cell behaviors such as angiogenesis.(20),(50) Zhou et al. reported that there is increase ALP activity in osteoblasts exposed to CNPs which is a characteristic of stimulated mineralization.(50)
The final in-vitro assessments were designed to study the FRS behavior of the scaffolds in a simulated oxidative stress environment using H2O2. Cell viability and level of mineralization were examined to determine the effect of oxidative stress on HObs cultures on the nanocomposite scaffolds. A modified LDH assay was completed to assess the cytotoxicity of HObs after culture with 1 mM H2O2 for two hours. We discovered that all the nanocomposites were able to sustain the viability of the HObs under oxidative stress with no significant changes in viability after the 2 hours treatment. Zhou et al. investigated the protective nature of CNPs and HObs under oxidative stress caused by H2O2 and reported that the addition of CNPs to the scaffolds was able to reduce cytotoxicity caused by exposure to oxidative stress.(16)
The effect on mineralization by HObs after induced oxidative stress was measured as another method to confirm the protective properties of the nanocomposite scaffolds. It has been reported that oxidative stress reduces the mineralization function of osteoblasts.(2),(4),(51) Both Arai et al. and Lee et al. reported that mineralization by pre-osteoblasts was reduced after exposure to hydrogen peroxide. This reduction is due to cell damage, increased cytotoxicity, and reduced osteogenic gene expression.(52),(53) We found that there was a statistically significant decrease in cytotoxicity of the HObs seeded onto PTC10 and PTC20 scaffolds. These results coupled with recovered mineralization by the HObs on CNP containing scaffolds after exposure to oxidative stress. The difference in the amount of mineralization between the normal and oxidative stress conditions was anticipated because we knew that ROS triggered a reduction in mineralization in osteoblasts upon exposure. The level of mineralization showed that there are potential protective properties by the nanocomposite scaffolds.
In addition to the in-vitro biocompatibility studies, we investigated the biocompatibility of the nanocomposites in-vivo. We utilized a subcutaneous implantation model using Sprague-Dawley rats to obtain a preliminary snapshot of in-vivo biocompatibility. Nanocomposite scaffolds were implanted for 7- and 30-days followed by histological preparation and staining. H&E staining was used to characterize cell infiltration, fibrotic capsule formation, and change in scaffold dimensions. We anticipated the material system would be biocompatible because the individual components have been reported to be biocompatible. POC has previously been reported to be biocompatible in in-vivo orthopedic studies by Qui et al. and Chung et al. They report biocompatibility of POC/HA composites with surrounding bone tissue and minimal immune response.(54)–(56) β-TCP is used as an additive in bone tissue engineering because of its similarities to natural bone apatite composed mainly of calcium and phosphate, and because of this it has been used in countless composite scaffolds.(33),(57)–(60) Multiple studies have reported CNPs to be biocompatible in-vitro and in-vivo.(61)–(63)
We were able to qualitatively see the progression of cell infiltration from 7-days to 30-days within our nanocomposite scaffolds. Total cell infiltration was likely due to the strategic fabrication employed to create interconnected pores between 200–300 μm, an ideal pore size for bone tissue engineering.(22),(23),(30),(34),(42)
H&E staining is a conventional and practical method to assess cell infiltration, fibrotic capsule formation, and change in scaffold morphology because it stains for cytoplasm and nuclei focusing on the overall location of cells within the scaffold and the formation of collagen bands.(37),(38),(64),(65) Quantitatively we saw a subtle increase in the average number of cells present in the scaffold, but the differences were not statistically significant. Cell infiltration is an essential characteristic for scaffolds because it shows that cells can attach, grow, and migrate through the porous network and begin their cellular functions. Infiltration of possible fibroblasts through the scaffolds shows potential for cell infiltration by osteoblasts in future studies. Persistent cell infiltration corroborates our in-vitro biocompatibility studies where we saw little change in viability after seeding cells onto the scaffolds because the infiltrated fibroblasts were able to endure contact with the scaffold material for 30 days. A significant increase in cell number was not anticipated because the subcutaneous implant model is not active a fracture site where there is a plethora of cell signaling molecules are released to attract cells to heal and remodel the site.(43),(47),(66) Delioramali et al. studied the in-vivo potential of a porous CNP/Bioglass composite scaffold and reported cell infiltration through the scaffold.(37) Their scaffolds were made using a foaming technique that resulted in an average pore size around 500 μm pores. Their findings support that CNPs are biocompatible when placed in-vivo.
Fibrotic capsule thickness further assessed the biocompatibility of the nanocomposite scaffolds. We found that the fibrotic capsules did not demonstrate significant changes from day 7 to day 30, suggesting that there was not a sustained reaction to the presence of the scaffold in the implantation site. Other in-vivo studies investigating fibrotic capsule formation with composites for bone tissue engineering also reported that the creation of fibrotic capsules ranging from 50–200 μm did not interfere with following cell infiltration and processes.(67)–(70) Other studies also reported decreases in the size of the fibrotic capsule around their polymer/carbon nanotube composite scaffolds after 4- and 12-weeks of implantation from 30 cell layers to around 10 cell layers.(71) In our study, after one week we report fibrotic capsules thicknesses ranging from 300–400 μm; after four weeks the capsule thicknesses decreased to less than 300 μm. The decrease complies with other findings that report decreased capsule thickness to around 100–200 μm with increased implantation time up to 12 weeks. The size of the fibrotic capsule can be regulated through the addition of growth factors and proteins to guide the response towards regeneration.(70),(72)
The final observations using H&E were the changes in scaffold morphology with increased length of implantation. During imaging of the scaffold sections, we observed a qualitative change in the scaffold size and shape. Therefore, we measured the respective widths and heights of each scaffold to generate an aspect ratio. We saw a decrease in the length of the scaffold heights from 7- to 30-days after implantation, resulting in an increased aspect ratio. This change could be due to the beginnings of scaffold decomposition combined with the compression of the scaffold during wound healing. Subcutaneous implant studies have shown that during wound healing from the creation of the pocket, the surrounding tissue slightly contracts. This force would also cause a change in the height of the scaffold over time.(69),(70),(72) The degradation of the nanocomposite scaffold, raises the question of the distribution of the CNPs throughout the body. Biodistribution studies completed in mice reported that CNPs do not cause an immunogenic response in the body.(61),(73),(74) Hirst et al. examined the accumulation of CNPs in the major organs of a rat: liver, spleen, lungs, kidney, heart, and brain.(73) They also studied multiple pathways to introduce CNPs into the body: intravenous injection, intraperitoneal injection, and oral delivery. The majority of the CNPs were accumulated in the spleen and liver, trace levels in the lungs and kidneys, and the heart and brain had close to no accumulation. Their study also demonstrated a lack of immune response in the liver and spleen in response to CNPs.
The addition of CNPs to the scaffold system had significant effects in a number of studies, mainly experiments focused on the effects of oxidative stress. Additional studies would need to be completed with different nanocomposite compositions. The scaffolds would contain the same amount of β-TCP throughout each composition and the concentration of CNPs would vary. This would allow us to compare the effects of CNPs on the cells and surrounding tissues.
CONCLUSIONS
The bone tissue engineering field is continually developing new composite material systems for synthetic tissue grating applications. We investigated and found free radical scavenging nanocomposite scaffolds to be biocompatible when studied with human osteoblasts in-vitro and their interactions with subcutaneous tissues in-vivo. Through these assessments we determined the scaffolds were biocompatible; the osteoblasts did not exhibit a cytotoxic response when seeded onto the scaffolds. The osteoblast cells also proliferated on the nanocomposites until they underwent mineralization. We found that CNPs may act as a stimulant of osteoblast mineralization in human osteoblast primary cells. We confirmed that the scaffolds can provide a protective effect to osteoblasts placed under oxidative stress by reducing cell cytotoxicity as well as recovered mineralization after treatment with hydrogen peroxide. The results of the in-vitro osteoblast studies provided us with promising feedback of biocompatibility and osteoblast function for the application of the nanocomposite systems in higher order studies.
Preliminary in-vivo studies further investigated the interactions between the nanocomposite scaffolds and surrounding cells and tissues using histological analysis of scaffold sections after 7 and 30 days of implantation. After 30 days of implantation, there was complete cell infiltration through the thickness of the nanocomposite scaffolds, confirming that our pore size is within an optimal range for infiltration, leading to the potential for total remodeling in bone tissue engineering applications. We noted the development of a fibrotic capsule around the perimeter of the scaffold and saw that the capsule thickness did not significantly change. This capsule formation implies that there was a neutral immunogenic response from the implantation of the scaffolds. We discovered signs of potential scaffold degradation due to the change in height after 30 days of implantation. From these preliminary studies, we can see the nanocomposite scaffolds have features of biocompatibility and we acknowledge the need for further examination to measure the inflammatory and immunogenic responses to the nanocomposites.
ACKNOWLEDGEMENTS
The authors would also like to acknowledge the University of Florida’s Animal Care Services team for providing guidance and excellent surgical resources. The authors would also like to acknowledge the University of Florida Department of Materials Science and Engineering undergraduate laboratory and Dr. Nancy Ruzycki for access to the Phenom ProX scanning electron microscope. Research reported in this publication was supported by the University of Florida Clinical and Translational Science Institute, which is sponsored in part by the NIH National Center for Advancing Translational Sciences under award number UL1TR001427. The content is solely the responsibility of the authors and does not necessarily represent the official views of the National Institutes of Health.
References
- 1.Symons MCR. Radicals generated by bone cutting and fracture. Free Radic Biol Med. 1996;20:831–5. [DOI] [PubMed] [Google Scholar]
- 2.Wauquier F, Leotoing L, Coxam V, Guicheux J, Wittrant Y. Oxidative stress in bone remodelling and disease. Trends Mol Med. 2009;15:468–77. [DOI] [PubMed] [Google Scholar]
- 3.Karakoti AS, Monteiro-Riviere NA, Aggarwal R, Davis JP, Narayan RJ, Self WT, McGinnis J, Seal S. Nanoceria as antioxidant: Synthesis and biomedical applications. JOM. 2008;60:33–7. [DOI] [PMC free article] [PubMed] [Google Scholar]
- 4.Sheweita SA, Khoshhal KI. Calcium metabolism and oxidative stress in bone fractures: role of antioxidants. Curr Drug Metab. 2007;8:519–25. [DOI] [PubMed] [Google Scholar]
- 5.Mandoli C, Pagliari F, Pagliari S, Forte G, Di Nardo P, Licoccia S, Traversa E. Stem Cell Aligned Growth Induced by CeO2 Nanoparticles in PLGA Scaffolds with Improved Bioactivity for Regenerative Medicine. Adv Funct Mater. 2010;20:1617–24. [Google Scholar]
- 6.Ball JP, Mound BA, Monsalve AG, Nino JC, Allen JB. Biocompatibility evaluation of porous ceria foams for orthopedic tissue engineering. J Biomed Mater Res Part A. 2015;103:8–15. [DOI] [PubMed] [Google Scholar]
- 7.Das S, Dowding JM, Klump KE, McGinnis JF, Self W, Seal S. Cerium oxide nanoparticles: applications and prospects in nanomedicine. Nanomedicine. 2013;8:1483–508. [DOI] [PubMed] [Google Scholar]
- 8.Chigurupati S, Mughal MR, Okun E, Das S, Kumar A, McCaffery M, Seal S, Mattson MP. Effects of cerium oxide nanoparticles on the growth of keratinocytes, fibroblasts and vascular endothelial cells in cutaneous wound healing. Biomaterials. 2013;34:2194–201. [DOI] [PMC free article] [PubMed] [Google Scholar]
- 9.Das S, Singh S, Dowding JM, Oommen S, Kumar A, Sayle TXT, Saraf S, Patra CR, Vlahakis NE, Sayle DC, Self WT, Seal S. The induction of angiogenesis by cerium oxide nanoparticles through the modulation of oxygen in intracellular environments Biomaterials. Elsevier Ltd; 2012;33:7746–55. [DOI] [PMC free article] [PubMed] [Google Scholar]
- 10.Karakoti A, Singh S, Dowding JM, Seal S, Self WT. Redox-active radical scavenging nanomaterials Chem Soc Rev. Royal Society of Chemistry; 2010;39:4422–32. [DOI] [PubMed] [Google Scholar]
- 11.Grulke E, Reed K, Beck M, Huang X, Cormack A, Seal S. Nanoceria: factors affecting its pro- and anti-oxidant properties Environ Sci Nano. Royal Society of Chemistry; 2014;1:429–44. [Google Scholar]
- 12.Korsvik C, Patil S, Seal S, Self WT. Superoxide dismutase mimetic properties exhibited by vacancy engineered ceria nanoparticles. Chem Commun. 2007;1056. [DOI] [PubMed] [Google Scholar]
- 13.Pirmohamed T, Dowding JM, Singh S, Wasserman B, Heckert E, Karakoti AS, King JES, Seal S, Self WT. Nanoceria exhibit redox state-dependent catalase mimetic activity. Chem Commun. 2010;46:2736. [DOI] [PMC free article] [PubMed] [Google Scholar]
- 14.Heckert EG, Karakoti AS, Seal S, Self WT. The role of cerium redox state in the SOD mimetic activity of nanoceria. Biomaterials. 2008;29:2705–9. [DOI] [PMC free article] [PubMed] [Google Scholar]
- 15.Xu C, Qu X. Cerium oxide nanoparticle: a remarkably versatile rare earth nanomaterial for biological applications NPG Asia Mater. Nature Publishing Group; 2014;6:e90. [Google Scholar]
- 16.Zhou G, Zheng B, Wei H, Zhang J, Wang S, Li Y, Gao J, Li S, Wang W. Cerium oxide nanoparticles protect primary osteoblasts against hydrogen peroxide induced oxidative damage. Micro Nano Lett. 2014;9:91–6. [Google Scholar]
- 17.Karakoti AS, Tsigkou O, Yue S, Lee PD, Stevens MM, Jones JR, Seal S. Rare earth oxides as nanoadditives in 3-D nanocomposite scaffolds for bone regeneration. J Mater Chem. 2010;20:8912. [Google Scholar]
- 18.Das S, Chigurupati S, Dowding J, Munusamy P, Baer DR, McGinnis JF, Mattson MP, Self W, Seal S. Therapeutic potential of nanoceria in regenerative medicine. MRS Bull. 2014;39:976–83. [Google Scholar]
- 19.Dowding JM, Song W, Bossy K, Karakoti A, Kumar A, Kim A, Bossy B, Seal S, Ellisman MH, Perkins G, Self WT, Bossy-Wetzel E. Cerium oxide nanoparticles protect against Aβ-induced mitochondrial fragmentation and neuronal cell death. Cell Death Differ. 2014;21:1622–32. [DOI] [PMC free article] [PubMed] [Google Scholar]
- 20.Xiang J, Li J, He J, Tang X, Dou C, Cao Z, Yu B, Zhao C, Kang F, Yang L, Dong S, Yang X. Cerium Oxide Nanoparticle Modified Scaffold Interface Enhances Vascularization of Bone Grafts by Activating Calcium Channel of Mesenchymal Stem Cells. ACS Appl Mater Interfaces. 2016;8:4489–99. [DOI] [PubMed] [Google Scholar]
- 21.Patil S, Reshetnikov S, Haldar MK, Seal S, Mallik S. Surface-Derivatized Nanoceria with Human Carbonic Anhydrase II Inhibitors and Fluorophores: A Potential Drug Delivery Device. J Phys Chem C. 2007;111:8437–42. [Google Scholar]
- 22.Baler K, Ball JP, Cankova Z, Hoshi RA, Ameer GA, Allen JB. Advanced nanocomposites for bone regeneration Biomater Sci. Royal Society of Chemistry; 2014;2:1355. [DOI] [PubMed] [Google Scholar]
- 23.Hutmacher DW, Schantz JT, Lam CXF, Tan KC, Lim TC. State of the art and future directions of scaffold-based bone engineering from a biomaterials perspective. J Tissue Eng Regen Med. 2007;1:245–60. [DOI] [PubMed] [Google Scholar]
- 24.Thadavirul N, Pavasant P, Supaphol P. Development of polycaprolactone porous scaffolds by combining solvent casting, particulate leaching, and polymer leaching techniques for bone tissue engineering. J Biomed Mater Res Part A. 2014;102:3379–92. [DOI] [PubMed] [Google Scholar]
- 25.Kothapalli CR, Shaw MT, Wei M. Biodegradable HA-PLA 3-D porous scaffolds: Effect of nano-sized filler content on scaffold properties. Acta Biomater. 2005;1:653–62. [DOI] [PubMed] [Google Scholar]
- 26.Roohani-Esfahani S-I, Nouri-Khorasani S, Lu Z, Appleyard R, Zreiqat H. The influence hydroxyapatite nanoparticle shape and size on the properties of biphasic calcium phosphate scaffolds coated with hydroxyapatite-PCL composites Biomaterials. Elsevier Ltd; 2010;31:5498–509. [DOI] [PubMed] [Google Scholar]
- 27.Lobo SE, Livingston Arinzeh T. Biphasic Calcium Phosphate Ceramics for Bone Regeneration and Tissue Engineering Applications. Materials (Basel). 2010;3:815–26. [Google Scholar]
- 28.Erisken C, Kalyon DM, Wang H. Functionally graded electrospun polycaprolactone and β-tricalcium phosphate nanocomposites for tissue engineering applications. Biomaterials. 2008;29:4065–73. [DOI] [PubMed] [Google Scholar]
- 29.Rezwan K, Chen QZ, Blaker JJ, Boccaccini AR. Biodegradable and bioactive porous polymer/inorganic composite scaffolds for bone tissue engineering. Biomaterials. 2006;27:3413–31. [DOI] [PubMed] [Google Scholar]
- 30.Leong K, Chua C, Sudarmadji N, Yeong W. Engineering functionally graded tissue engineering scaffolds. J Mech Behav Biomed Mater. 2008;1:140–52. [DOI] [PubMed] [Google Scholar]
- 31.Rogel MR, Qiu H, Ameer GA. The role of nanocomposites in bone regeneration. J Mater Chem. 2008;18:4233. [Google Scholar]
- 32.Scaffaro R, Lopresti F, Botta L, Rigogliuso S, Ghersi G. Preparation of three-layered porous PLA/PEG scaffold: relationship between morphology, mechanical behavior and cell permeability. J Mech Behav Biomed Mater. Elsevier; 2016;54:8–20. [DOI] [PubMed] [Google Scholar]
- 33.Liu Y, Lim J, Teoh S-H. Review: Development of clinically relevant scaffolds for vascularised bone tissue engineering. Biotechnol Adv. Elsevier Inc.; 2013;31:688–705. [DOI] [PubMed] [Google Scholar]
- 34.Dulany K, Goins A, Kelley A, Allen JB. Fabrication of a Free Radical Scavenging Nanocomposite Scaffold for Bone Tissue Regeneration Regen Eng Transl Med. Regenerative Engineering and Translational Medicine; 2018;4:257–67. [Google Scholar]
- 35.Westhauser F, Senger A-S, Reible B, Moghaddam A. In Vivo Models for the Evaluation of the Osteogenic Potency of Bone Substitutes Seeded with Mesenchymal Stem Cells of Human Origin: A Concise Review. Tissue Eng Part C Methods. 2017;23:881–8. [DOI] [PubMed] [Google Scholar]
- 36.Turnbull G, Clarke J, Picard F, Riches P, Jia L, Han F, Li B, Shu W. 3D bioactive composite scaffolds for bone tissue engineering. Bioact Mater. 2018;3:278–314. [DOI] [PMC free article] [PubMed] [Google Scholar]
- 37.Deliormanlı AM, Seda Vatansever H, Yesil H, Özdal-Kurt F. In vivo evaluation of cerium, gallium and vanadium-doped borate-based bioactive glass scaffolds using rat subcutaneous implantation model. Ceram Int. 2016;42:11574–83. [Google Scholar]
- 38.Kim S-S, Sun Park M, Jeon O, Yong Choi C, Kim B-S. Poly(lactide-co-glycolide)/hydroxyapatite composite scaffolds for bone tissue engineering. Biomaterials. 2006;27:1399–409. [DOI] [PubMed] [Google Scholar]
- 39.Yang W, Both SK, Zuo Y, Birgani ZT, Habibovic P, Li Y, Jansen JA, Yang F. Biological evaluation of porous aliphatic polyurethane/hydroxyapatite composite scaffolds for bone tissue engineering. J Biomed Mater Res Part A. 2015;103:2251–9. [DOI] [PubMed] [Google Scholar]
- 40.Yang J, Webb AR, Pickerill SJ, Hageman G, Ameer GA. Synthesis and evaluation of poly(diol citrate) biodegradable elastomers. Biomaterials [Internet]. 2006;27:1889–98. Available from: http://www.ncbi.nlm.nih.gov/pubmed/16290904 [DOI] [PubMed] [Google Scholar]
- 41.Jansen JA, Vehof JWM, Ruhé PQ, Kroeze-Deutman H, Kuboki Y, Takita H, Hedberg EL, Mikos AG. Growth factor-loaded scaffolds for bone engineering. J Control Release. 2005;101:127–36. [DOI] [PubMed] [Google Scholar]
- 42.Bose S, Roy M, Bandyopadhyay A. Recent advances in bone tissue engineering scaffolds Trends Biotechnol. Elsevier Ltd; 2012;30:546–54. [DOI] [PMC free article] [PubMed] [Google Scholar]
- 43.Mistry AS, Mikos AG. Tissue engineering strategies for bone regeneration. Adv Biochem Eng Biotechnol. 2005;94:1–22. [DOI] [PubMed] [Google Scholar]
- 44.Li K, Xie Y, You M, Huang L, Zheng X. Cerium Oxide-Incorporated Calcium Silicate Coating Protects MC3T3-E1 Osteoblastic Cells from H2O2-Induced Oxidative Stress Biol Trace Elem Res. Biological Trace Element Research; 2016;174:198–207. [DOI] [PubMed] [Google Scholar]
- 45.Chernousova S, Epple M, Epple M. Bioactive bone substitution materials. Adv Biomater Devices Med. 2014;1:74–87. [Google Scholar]
- 46.Bramhill J, Ross S, Ross G. Bioactive Nanocomposites for Tissue Repair and Regeneration: A Review. Int J Environ Res Public Health. 2017;14. [DOI] [PMC free article] [PubMed]
- 47.Amini AR, Laurencin CT, Nukavarapu SP. Bone tissue engineering: recent advances and challenges. Crit Rev Biomed Eng. 2012;40:363–408. [DOI] [PMC free article] [PubMed] [Google Scholar]
- 48.Lian JB, Stein GS, Stein JL, van Wijnen AJ. Transcriptional control of osteoblast differentiation. Biochem Soc Trans. 1998;26:14–21. [DOI] [PubMed] [Google Scholar]
- 49.Hollinger J, Einhorn T, Doll B, Sfeir C, editors. Bone Tissue Engineering. 1st ed. CRC Press; 2005. [Google Scholar]
- 50.Zhou G, Gu G, Li Y, Zhang Q, Wang W, Wang S, Zhang J. Effects of cerium oxide nanoparticles on the proliferation, differentiation, and mineralization function of primary osteoblasts in vitro. Biol Trace Elem Res. 2013;153:411–8. [DOI] [PubMed] [Google Scholar]
- 51.Bai X, Lu D, Bai J, Zheng H, Ke Z, Li X, Luo S. Oxidative stress inhibits osteoblastic differentiation of bone cells by ERK and NF-κB. Biochem Biophys Res Commun. 2004;314:197–207. [DOI] [PubMed] [Google Scholar]
- 52.Arai M, Shibata Y, Pugdee K, Abiko Y, Ogata Y. Effects of reactive oxygen species (ROS) on antioxidant system and osteoblastic differentiation in MC3T3-E1 cells. IUBMB Life. 2007;59:27–33. [DOI] [PubMed] [Google Scholar]
- 53.Lee DH, Lim B-S, Lee Y-K, Yang H-C. Effects of hydrogen peroxide (H2O2) on alkaline phosphatase activity and matrix mineralization of odontoblast and osteoblast cell lines. Cell Biol Toxicol. 2006;22:39–46. [DOI] [PubMed] [Google Scholar]
- 54.Qiu H, Yang J, Kodali P, Koh J, Ameer GA. A citric acid-based hydroxyapatite composite for orthopedic implants. Biomaterials. 2006;27:5845–54. [DOI] [PubMed] [Google Scholar]
- 55.Chung EJ, Qiu H, Kodali P, Yang S, Sprague SM, Hwong J, Koh J, Ameer GA. Early tissue response to citric acid-based micro- and nanocomposites. J Biomed Mater Res Part A. 2011;96A:29–37. [DOI] [PMC free article] [PubMed] [Google Scholar]
- 56.Chung EJ, Kodali P, Laskin W, Koh JL, Ameer GA. Long-term in vivo response to citric acid-based nanocomposites for orthopaedic tissue engineering. J Mater Sci Mater Med. 2011;22:2131–8. [DOI] [PubMed] [Google Scholar]
- 57.Campana V, Milano G, Pagano E, Barba M, Cicione C, Salonna G, Lattanzi W, Logroscino G. Bone substitutes in orthopaedic surgery: from basic science to clinical practice. J Mater Sci Mater Med. 2014;25:2445–61. [DOI] [PMC free article] [PubMed] [Google Scholar]
- 58.Arinzeh TL, Tran T, Mcalary J, Daculsi G. A comparative study of biphasic calcium phosphate ceramics for human mesenchymal stem-cell-induced bone formation. Biomaterials. 2005;26:3631–8. [DOI] [PubMed] [Google Scholar]
- 59.Carson JS, Bostrom MPG. Synthetic bone scaffolds and fracture repair. Injury. 2007;38 Suppl 1:S33–7. [DOI] [PubMed] [Google Scholar]
- 60.Pina S, Oliveira JM, Reis RL. Natural-based nanocomposites for bone tissue engineering and regenerative medicine: a review. Adv Mater. 2015;27:1143–69. [DOI] [PubMed] [Google Scholar]
- 61.Rajeshkumar S, Naik P. Synthesis and biomedical applications of Cerium oxide nanoparticles - A Review. Biotechnol reports (Amsterdam, Netherlands). Elsevier; 2018;17:1–5. [DOI] [PMC free article] [PubMed] [Google Scholar]
- 62.Limbach LK, Li Y, Grass RN, Brunner TJ, Hintermann MA, Muller M, Gunther D, Stark WJ. Oxide Nanoparticle Uptake in Human Lung Fibroblasts: Effects of Particle Size, Agglomeration, and Diffusion at Low Concentrations. Environ Sci Technol. 2005;39:9370–6. [DOI] [PubMed] [Google Scholar]
- 63.Singh S Cerium oxide based nanozymes: Redox phenomenon at biointerfaces. Biointerphases. 2016;11:04B202. [DOI] [PubMed] [Google Scholar]
- 64.Salgado CL, Grenho L, Fernandes MH, Colaço BJ, Monteiro FJ. Biodegradation, biocompatibility, and osteoconduction evaluation of collagen-nanohydroxyapatite cryogels for bone tissue regeneration. J Biomed Mater Res A. 2016;104:57–70. [DOI] [PubMed] [Google Scholar]
- 65.Poh PSP, Hutmacher DW, Holzapfel BM, Solanki AK, Stevens MM, Woodruff MA. In vitro and in vivo bone formation potential of surface calcium phosphate-coated polycaprolactone and polycaprolactone/bioactive glass composite scaffolds Acta Biomater. Acta Materialia Inc.; 2016;30:319–33. [DOI] [PubMed] [Google Scholar]
- 66.Winkler T, Sass FA, Duda GN, Schmidt-Bleek K. A review of biomaterials in bone defect healing, remaining shortcomings and future opportunities for bone tissue engineering: The unsolved challenge. Bone Joint Res. 2018;7:232–43. [DOI] [PMC free article] [PubMed] [Google Scholar]
- 67.Fredriksson C, Hedhammar M, Feinstein R, Nordling K, Kratz G, Johansson J, Huss F, Rising A. Tissue Response to Subcutaneously Implanted Recombinant Spider Silk: An in Vivo Study. Materials (Basel). 2009;2:1908–22. [Google Scholar]
- 68.Cao H, Mchugh K, Chew SY, Anderson JM. The topographical effect of electrospun nanofibrous scaffolds on the in vivo and in vitro foreign body reaction. J Biomed Mater Res Part A. 2009;93A:1151–9. [DOI] [PMC free article] [PubMed] [Google Scholar]
- 69.Yim EKF, Liao I, Leong KW. Tissue Compatibility of Interfacial Polyelectrolyte Complexation Fibrous Scaffold: Evaluation of Blood Compatibility and Biocompatibility. Tissue Eng. 2007;13:423–33. [DOI] [PMC free article] [PubMed] [Google Scholar]
- 70.Jones KS. Effects of biomaterial-induced inflammation on fibrosis and rejection. Semin Immunol. 2008;20:130–6. [DOI] [PubMed] [Google Scholar]
- 71.Sitharaman B, Shi X, Walboomers XF, Liao H, Cuijpers V, Wilson LJ, Mikos AG, Jansen JA. In vivo biocompatibility of ultra-short single-walled carbon nanotube/biodegradable polymer nanocomposites for bone tissue engineering. Bone. 2008;43:362–70. [DOI] [PubMed] [Google Scholar]
- 72.Rolfe B, Mooney J, Zhang B, Jahnke S, Le S-J, Chau Y-Q, Huang Q, Wang H, Campbell G, Campbell J. The Fibrotic Response to Implanted Biomaterials: Implications for Tissue Engineering Regen Med Tissue Eng - Cells Biomater. InTech; 2011. [Google Scholar]
- 73.Hirst SM, Karakoti A, Singh S, Self W, Tyler R, Seal S, Reilly CM. Bio-distribution and in vivo antioxidant effects of cerium oxide nanoparticles in mice. Environ Toxicol. 2013;28:107–18. [DOI] [PubMed] [Google Scholar]
- 74.Rzigalinski BA, Carfagna CS, Ehrich M. Cerium oxide nanoparticles in neuroprotection and considerations for efficacy and safety. Wiley Interdiscip Rev Nanomedicine Nanobiotechnology. 2017;9. [DOI] [PMC free article] [PubMed] [Google Scholar]