

Abstract
Purpose
To compare the dosimetric performances of intensity‐modulated proton therapy (IMPT) plans generated with two different beam angle configurations (the Right–Left oblique posterior beams and the Superior–Inferior oblique posterior beams) for the treatment of distal esophageal carcinoma in the presence of uncertainties and interplay effect.
Methods and Materials
Twenty patients’ IMPT plans were retrospectively selected, with 10 patients treated with the R‐L oblique posterior beams (Group R‐L) and the other 10 patients treated with the S‐I oblique posterior beams (Group S‐I). Patients in both groups were matched by their clinical target volumes (CTVs—high and low dose levels) and respiratory motion amplitudes. Dose‐volume‐histogram (DVH) indices were used to assess plan quality. DVH bandwidth was calculated to evaluate plan robustness. Interplay effect was quantified using four‐dimensional (4D) dynamic dose calculation with random respiratory starting phase of each fraction. Normal tissue complication probability (NTCP) for heart, liver, and lung was calculated, respectively, to estimate the clinical outcomes. Wilcoxon signed‐rank test was used for statistical comparison between the two groups.
Results
Compared with plans in Group R‐L, plans in Group S‐I resulted in significantly lower liver Dmean and lung V30Gy[RBE] with slightly higher but clinically acceptable spinal cord Dmax. Similar plan robustness was observed between the two groups. When interplay effect was considered, plans in Group S‐I performed statistically better for heart Dmean and V30Gy[RBE], lung Dmean and V5Gy[RBE], and liver Dmean, with slightly increased but clinically acceptable spinal cord Dmax. NTCP for liver was significantly better in Group S‐I.
Conclusions
IMPT plans in Group S‐I have better sparing of liver, heart, and lungs at the slight cost of spinal cord maximum dose protection, and are more interplay‐effect resilient compared to IMPT plans in Group R‐L. Our study supports the routine use of the S‐I oblique posterior beams for the treatments of distal esophageal carcinoma.
Keywords: beam angle, esophageal cancer, intensity‐modulated proton therapy, interplay effect
1. INTRODUCTION
Esophageal carcinoma is the eighth most common malignancy and the sixth most common cause of cancer death worldwide. 1 In the United States, the 5‐yr relative survival rate for the esophageal cancer patients is low, only about 20%. 2 Due to the proximity of organs‐at‐risk for distal esophageal cancer patients, the delivery of tumoricidal dose of radiation without causing significant toxicity is challenging. 3 , 4
Intensity‐modulated proton therapy (IMPT) has distinct advantages in terms of high conformality of target coverage and organs at risk (OARs) protection 5 , 6 , 7 , 8 . However, compared to photon‐based intensity‐modulated radiation therapy (IMRT) and the older passive‐scattering proton therapy (PSPT), IMPT can suffer from greater sensitivity to proton beam range and patient setup uncertainties. 9 , 10 , 11 Additionally, respiratory motion makes IMPT even more vulnerable because of the interplay effect, which is caused by the interference between dynamic beamlet delivery and intra‐fractional tumor motion. 12 , 13 , 14 , 15 , 16 , 17 , 18 , 19 , 20 , 21 , 22 , 23 This poses a greater challenge when treating distal esophageal carcinoma due to adjacent diaphragmatic and gastric motion.
Robust optimization 24 , 25 , 26 , 27 , 28 , 29 , 30 , 31 , 32 , 33 , 34 , 35 , 36 , 37 , 38 , 39 , 40 , 41 , 42 , 43 , 44 , 45 , 46 , 47 has been introduced to mitigate the impact of uncertainties, and is now widely accepted in the routine proton clinical practice. However, techniques to mitigate interplay effect would still require further improvement. 48 Abdominal compression and breath holding can help limit the motion, but often result in less patient comfort during treatments. Gating 49 and repainting 13 , 16 , 50 can provide better dose distribution during motion, but will inherently prolong the treatment time. Tumor tracking 51 , 52 and the recently proposed 4D optimization 45 , 53 , 54 , 55 are still in development, and will need further verifications prior to routine clinical use. Currently at our institution, IMPT plans are derived for distal esophageal cancer based on the averaged four‐dimensional computed tomography (4D‐CT) with uncertainties considered. Generated IMPT plans are then verified by plan evaluation on maximum exhalation and maximum inhalation respiratory phases, as well as a separate interplay effect calculation. 45
Previous dosimetric studies 56 , 57 , 58 , 59 of esophageal carcinoma treatment compared both proton and photon treatments. Zhang et al. reported that proton therapy provided significantly better sparing of the lungs than IMRT. 56 Shiraishi et al. found that in patients with mid to distal esophageal cancer, proton therapy resulted in significantly lower radiation exposure to the whole heart and cardiac structures compared to IMRT. 57 Lin et al. concluded in a large‐scale multi‐institutional study that proton therapy was associated with significantly less postoperative complications and shorter length of in‐hospital stay than 3D conformal radiation therapy and IMRT. 58 Liu et al. carried out a comparative study between small‐spot IMPT and volumetric‐modulated arc therapy (VMAT), and found that small‐spot IMPT significantly improved sparing of heart, liver, and lungs with clinically acceptable plan robustness. 34 Most recently, Lin et al. reported the result of a phase IIB trial that for locally advanced esophageal cancer, proton beam therapy (PBT) reduced the risk and severity of adverse events (AEs) while maintaining similar progression‐free survival (PFS) when compared with IMRT. 59
Specifically for IMPT, different configurations may lead to different outcomes, such as spot sizing and spacing. 38 The selection of beam angles is important as well. At our institution, two different sets of beam angles are typically used for IMPT planning for distal esophageal cancer: the Right–Left (R‐L) oblique posterior beams (Group R‐L) and the Superior–Inferior (S‐I) oblique posterior beams (Group S‐I) (Fig. 1). To the best of our knowledge, no comparative study has been reported comparing these two different configurations of beam angles in IMPT for the treatment of distal esophageal cancer. In this study, we compared the IMPT plan quality and robustness for distal esophageal carcinoma between R‐L oblique posterior beams (Group R‐L) and S‐I oblique posterior beams (Group S‐I). The interplay effect was also quantified for both beam orientations.
Fig. 1.
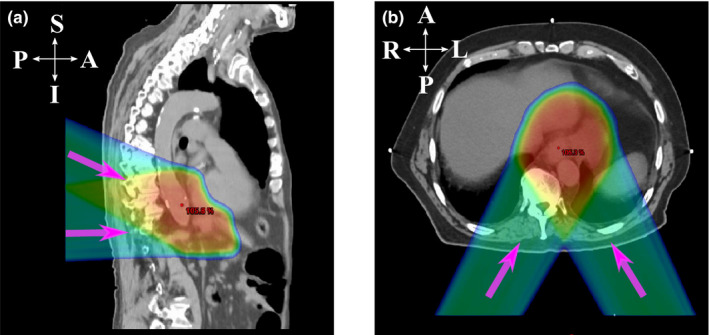
Two different beam angle configurations. The purple arrows indicate different beam directions. (a) Sagittal plane of a typical patient treated with Superior–Inferior (S‐I) oblique posterior beams, and (b) transverse plane of a typical patient treated with Right–Left (R‐L) oblique posterior beams.
2. MATERIALS AND METHODS
2.A. Patient selection
Twenty patients with distal esophageal carcinoma treated with IMPT at our institution between March 2017 and December 2019 were retrospectively reviewed. All these patients were treated with the same prescription doses for the clinical target volumes (CTVs) (50 Gy[RBE] for CTVhigh and 45 Gy[RBE] for CTVlow). Prescription doses for both volumes (CTVhigh and CTVlow) were typically delivered in 25 daily fractions via simultaneously integrated boost (SIB).
To assess the impact of different beam angles, patients were chosen based on the dosimetrist’s choice for beam angles at the time of IMPT planning, typically two sets, thus could be divided into two groups. In the first group, two oblique posterior beams in the S‐I direction with a couch angle of 270° were employed (Group S‐I). In the second group, two oblique posterior beams in the R‐L direction of a couch angle of 180° were employed (Group R‐L). In Group R‐L, a few patients were treated with one or two additional anterior beams for better target dose distribution and adjacent organ protection (See Table S1).
For all patients, tumor locations were distal (ie, near the gastroesophageal junction), where the impact of the respiratory motion was important and the protection of OARs could be difficult anatomically. In our earlier proton practice, the patients were planned and treated with mainly oblique posterior beams in the R‐L direction. We then started exploring using oblique posterior beams in the S‐I directions, which has become more commonly used recently. Thus, 20 patients (10 in each group) were selected for this comparison. We matched the patients by comparing their CTV volumes and also tumor motion amplitudes, so that they were most presentative clinically for statistical comparison (Table 1). Tumor motion amplitude in this paper is defined as the largest motion in one direction (S‐I, A‐P, or R‐L, see Table S2). Additionally, no patients had any implanted electronic devices, and no range shifter was used in the treatment of any patients. All selected patients were treated with curative intent as determined by the clinical radiation oncologists.
Table 1.
Target characteristics between two treatment/beam angle groups.
| Group S‐I | Group R‐L | P‐value a | |
|---|---|---|---|
| Patient number | 10 | 10 | |
| CTVhigh (cm3) [median (range)] | 179.4 (132.2 ~ 295.6) | 207.4 (56.8 ~ 338.6) | 0.285 |
| CTVlow (cm3) [median(range)] | 390.5 (242.6 ~ 546.3) | 415.8 (279.0 ~ 732.9) | 0.879 |
| Tumor motion amplitude (cm) [median (range)] | 0.8 (0.5 ~ 0.9) | 0.8 (0.6 ~ 1.0) | 0.261 |
The Wilcoxon signed‐rank test was used.
2.B. Treatment planning
Treatment planning was carried out for all patients by using the commercial treatment planning system EclipseTM (version 13, Varian Medical System, Palo Alto, CA). All the IMPT plans were generated on the averaged 4D‐CT with CTV density override (HU = 50) for improving plan robustness related to respiratory motion. An optimization target volume (OTV) was constructed by adding a uniform 5‐mm margin to the CTV to assist the robust plan generation. At least one spot was placed outside OTV to ensure the forming of a uniform dose distribution within OTV. Discrete energy layers from 71.3 to 205.3 MeV were used (Table S1).
For beam placement, two posterior beams were typically used, whereas one or two additional anterior beams could be optionally introduced as needed to achieve a clinically acceptable plan (ie, meeting the institutional dose‐volume constraints and plan robustness requirements). More details regarding treatment planning for distal esophageal carcinoma can be found in Liu et al. 34 For the current study, as described in Section 2.A, all patients from Group S‐I had two S‐I oblique posterior beams with no additional supplemental beams required. For the 10 patients from the Group R‐L, besides two R‐L oblique posterior beams, two patients had one extra anterior beam each and one patient had two additional anterior beams (Table S1).
Pencil‐beam convolution supposition (PCS) was used for all patients to carry out the volume‐dose calculation and beamline modifiers. For optimization, single‐field optimization (SFO) was usually applied as the preferred method. Alternative multiple‐field optimization (MFO) would be used if SFO failed to meet the clinical requirements at first try. For the SFO approach, the PCS model was utilized; for the MFO approach, the nonlinear uniform proton optimizer (NUPO) was used. When MFO approach was used, an evaluation of dose distribution per field would be done using EclipseTM to make sure the per field gradient was shallow, so that the plan would be robust to independent beam shifts during the delivery. In all selected patients, the plan optimizations of six patients used SFO method, with three patients in each group. After the planning on the averaged 4D‐CT, two verification plans on the maximum inhalation and maximum exhalation phases without the density override were generated to evaluate the influence of respiratory motion, which in turn acted as guidance for the adjustment of the original plan generated on the averaged 4D‐CT. When all three plans (the original plan on the averaged 4D‐CT and two verification plans on the maximum inhalation and exhalation phases) had met the clinical requirements (Table 2), they could be considered optimal.
Table 2.
Dose‐volume constraints for organs‐at‐risk.
| Structure | Dose limits a |
|---|---|
| Liver | Dmean < 25 Gy[RBE]; V30Gy[RBE] < 60% |
| Total lung | V5Gy[RBE] < 60%; V20Gy[RBE] < 15%; Dmean < 15 Gy[RBE] |
| Spinal cord | Dmax < 45 Gy[RBE]; V45Gy[RBE] < 0.1% |
| Heart | V25Gy[RBE] <50%; V40Gy[RBE] < 30%; Dmean < 26 Gy[RBE] |
| Left/right kidney | V18Gy[RBE] < 10%; Dmean < 18 Gy[RBE] |
These DVCs are carefully generated by experienced radiation oncologists and physicists at our institution. They are generally more restrictive (thus safer) than the ones recommended by RTOG.
2.C. Treatment delivery
Hitachi ProBeat‐V spot‐scanning proton machines (Hitachi, Tokyo, Japan) were used to deliver the treatment at our institution. The energy range of the machine was from 71.3 to 228.8 MeV with 97 discrete energy layers. The characteristic times during the delivery were: approximately 1 s in proton acceleration or deceleration, averaged 1.91 s in energy switching, averaged 1.93 ms in magnet preparation and verification, averaged 7.9 s in proton extraction, approximately 0.1 s in extraction setup, and approximately 3 ms of time interval between spots. The spot dose delivery rate is 8.7 MU/s. 60
2.D. Plan quality evaluation
For the target volume, we calculated the D95% (the minimum dose covering the lowest 95% of the irradiated structure’s volume), D5% (the minimum dose covering the highest irradiated 5% of the structure’s volume), and D2cc (the minimum dose covering the highest irradiated 2cc of the structure’s volume) of both CTVhigh and CTVlow according to the corresponding dose‐volume‐histograms (DVHs). Each of the CTV‐related parameters was normalized by the corresponding prescribed dose (CTVhigh by 50 Gy [RBE] and CTVlow by 45 Gy [RBE]). CTV D95%, D5%‐D95%, and D2cc were used to illustrate target dose coverage, target dose homogeneity, and hot spots, respectively.
For the OAR protection, we calculated lung Dmean (mean dose), spinal cord Dmax (maximum dose), heart Dmean, and liver Dmean. In addition, we also calculated relative volumes V5Gy[RBE] and V20Gy[RBE] for lung, V30Gy[RBE] and V40Gy[RBE] for heart, V30Gy[RBE] for liver, V18Gy[RBE] for kidney, and V45Gy[RBE]cc for stomach, with VXGy[RBE] and VXGy[RBE]cc defined as the normalized and absolute (cc) volume of a structure receiving at least X Gy[RBE] dose, respectively.
2.E. Robustness qualification
Patient setup uncertainties were considered by a 3‐mm rigid shift in both positive and negative directions along the three axes of anterior–posterior (A‐P), right‐left (R‐L), and superior–inferior (S‐I). As the contouring of the target volumes (CTVhigh and CTVlow) had already taken the anatomical constraints, the pathology and location of the tumor, and the potential microscopic tumor extent and anatomic boundaries of heart, lungs, liver, kidneys, and bowel, 34 a 3‐mm rigid shift in all six directions was considered appropriate for the patient setup uncertainties. Patient range uncertainties were considered by scaling the nominal beam range up and down by 3%. Altogether, a set of 13 different scenarios was generated (one nominal and 12 perturbed scenarios). A band graph of DVHs corresponding to all 13 scenarios was obtained. The bandwidth was then used to evaluate the plan robustness, with the horizontal bandwidth for the dose at a reference volume and the vertical bandwidth for the volume at a reference dose. Smaller bandwidth would indicate better plan robustness.
2.F. Interplay effect evaluation
Dose calculation software was developed at our institution to assess dose distribution in the presence of interplay effect. Every spot for each field per fraction was assigned to the corresponding respiratory phase according to their temporal relationship with the spot delivery sequence and patient‐specific respiratory motions. Then, the dose of each phase was calculated with respect to the assigned spots. Finally, the calculated dose of each phase was then deformed onto the reference phase (maximum exhalation phase) through deformable image registration to get the final 4D dynamic dose. 45 Our software can handle 10 respiratory phases; however, in practice, only two equally weighted extreme phases (maximum exhalation and maximum inhalation phases) would be selected due to computation time considerations. The starting phase for each field per fraction was randomized to help mitigate its influence. The actual fraction number of the treatment plan was used in the calculation. The multiple energy extraction (MEE) method was adopted for more efficient delivery compared to the single energy extraction (SEE) method. 61 , 62
Iso‐layer repainting was utilized to mitigate the impact of interplay effect. During the repainting process, a minimum MU limit of 0.003 MU and a patient‐specific maximum MU limit of our proton machine were employed. When the respiratory motion amplitude was within 5 mm, the maximum MU limit was set to be 0.04 MU. Otherwise, the maximum MU limit was changed to 0.01 MU for more repainting in order to mitigate interplay effect due to increased respiratory motions. Any MU values larger than the maximum limit were split into several less intensive spots with their intensities equal to the maximum MU limit and one possible residual spot. If the intensity of a spot or a residual spot was between the minimum and maximum MU limits, it was delivered with its actual intensity. For a spot or a residual spot that had intensity less than the minimum MU limit, its delivery was adjusted according to its intensity. If the intensity was larger than half of the minimum limit, it was rounded up to be the minimum MU limit, while otherwise, the spot was dropped. Note that the maximum and minimum MU limits mentioned here were well investigated and benchmarked machine‐specifically only within our institution, thus might only apply well on our machine.
2.G. Normal tissue complication probability evaluation
To estimate the clinical outcomes of the IMPT plans for patients from each group, the normal tissue complication probability (NTCP) was calculated for heart, lung, and liver for every patient in the nominal scenario on averaged CT. Based on the DVH information, the Niemierko model 63 , 64 was used for the NTCP calculation.
2.H. Statistical analysis
For fair comparison, all plans were normalized to have a CTVlow D95% of 100% of the prescribed dose in the nominal scenario (without uncertainties or interplay effect considered). Wilcoxon signed‐rank test was applied to carry out the statistical analysis between the selected paired groups. P < 0.05 was considered to be statistically significant. Box‐and‐Whisker plotting was adopted to illustrate the DVH indices for all patients from each group. Any value >1.5 times of the interquartile range above or below the quartile limits was considered as an outlier.
3. RESULTS
3.A. Plan quality in the nominal scenario
On the averaged 4D‐CT in the nominal scenario, compared to Group R‐L, Group S‐I had significantly better dosimetric values in terms of liver Dmean (median value: 140.04 vs 388.59 cGy; P = 0.028; the latter value refers to “Group R‐L” here and also hereafter) and total lung V5Gy[RBE] (median value: 7.26 vs 13.79%; P = 0.047), but resulted in significantly worse hot spot control CTVhigh D2cc (median value: 102.62 vs 104.11%; P = 0.047) and spinal cord Dmax (median value: 40.52 vs 38.75 Gy; P = 0.037). Other DVH indices were comparable [Figs. 2(a)–2(f)].
Fig. 2.
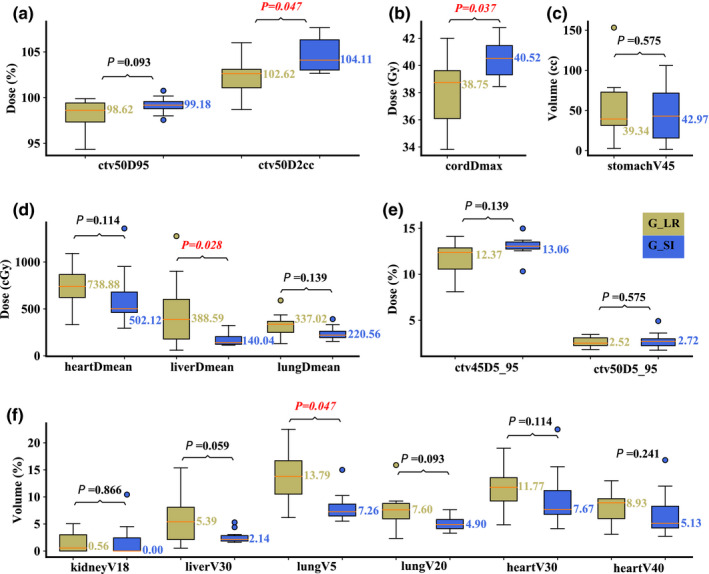
Comparison of the dose‐volume‐histogram indices between plans of Group S‐I and Group R‐L on averaged 4D‐CT. (a) Normalized CTVhigh D95% and CTVhigh D2cc, (b) spinal cord Dmax, (c) stomach V45Gy[RBE]cc, (d) heart Dmean, liver Dmean, and lung Dmean, (e) normalized CTVlow D5%‐D95% and CTVhigh D5%‐D95%, and (f) normalized volume of kidney V18Gy[RBE], liver V30Gy[RBE], lung V5Gy[RBE], lung V20Gy[RBE], heart V30Gy[RBE], and heart V40Gy[RBE]. Boxes in khaki are the results from Group R‐L, while blue boxes are the results from Group S‐I. Numbers on the top are P‐values from Wilcoxon signed‐rank test. P‐values that indicate statistical significance (<0.05) are in red and italicized.
On the maximum inhalation phase in the nominal scenario, compared to Group R‐L, Group S‐I performed significantly better in liver Dmean (median value: 144.41 vs 439.34 cGy; P = 0.017) and V30Gy[RBE] (median value: 2.09 vs 5.78%; P = 0.028), and lung V5Gy[RBE] (median value: 7.80 vs 14.71%; P = 0.028), but significantly worse in spinal cord Dmax (median value: 40.37 vs 38.78 Gy; P = 0.017). All other DVH indices were comparable [Figs. 3(a)–3(f)]. On the maximum exhalation phase in the nominal scenario, similar results were obtained with liver Dmean (median value: 136.7 vs 367.1 cGy; P = 0.017) and V30Gy[RBE] (median value: 2.17 vs 4.87%; P = 0.047), and lung V5Gy[RBE] (median value: 6.62 vs 13.3%; P = 0.037). Group S‐I was also slightly better in CTVlow D95% (median value: 100.03 vs 99.88%; P = 0.005) in this scenario [Figs. 4(a)–4(f)].
Fig. 3.
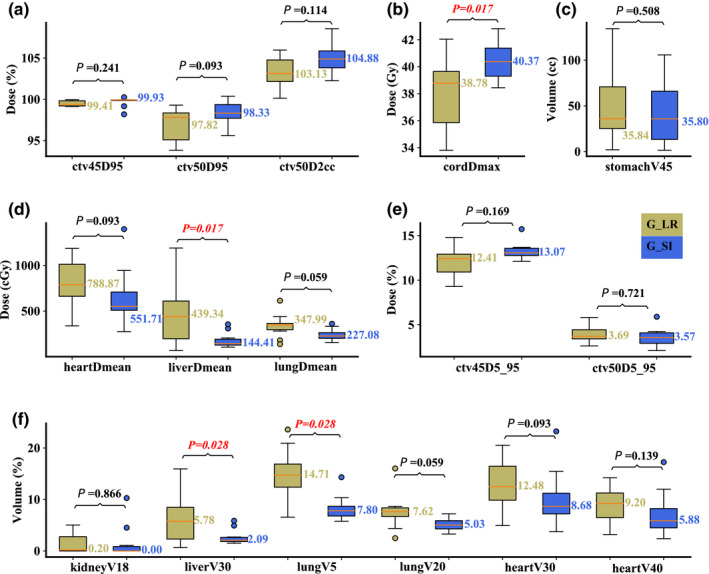
Comparison of the dose‐volume‐histogram indices between plans of Group S‐I and Group R‐L on the maximum inhalation phase. (a) Normalized CTVhigh D95% and CTVhigh D2cc, (b) spinal cord Dmax, (c) stomach V45Gy[RBE]cc, (d) heart Dmean, liver Dmean, and lung Dmean, (e) normalized CTVlow D5%‐D95% and CTVhigh D5%‐D95%, and (f) normalized volume of kidney V18Gy[RBE], liver V30Gy[RBE], lung V5Gy[RBE], lung V20Gy[RBE], heart V30Gy[RBE], and heart V40Gy[RBE]. Boxes in khaki are the results from Group R‐L, while blue boxes are the results from Group S‐I. Numbers on the top are P‐values from Wilcoxon signed‐rank test. P‐values that indicate statistical significance (<0.05) are in red and italicized.
Fig. 4.
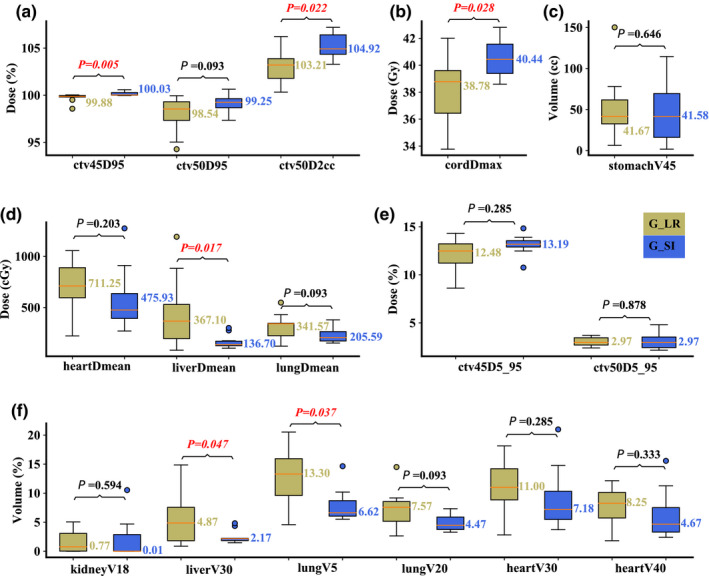
Comparison of the dose‐volume‐histogram indices between plans of Group S‐I and Group R‐L on the maximum exhalation phase. (a) Normalized CTVhigh D95% and CTVhigh D2cc, (b) spinal cord Dmax, (c) stomach V45Gy[RBE]cc, (d) heart Dmean, liver Dmean, and lung Dmean, (e) normalized CTVlow D5%‐D95% and CTVhigh D5%‐D95%, and (f) normalized volume of kidney V18Gy[RBE], liver V30Gy[RBE], lung V5Gy[RBE], lung V20Gy[RBE], heart V30Gy[RBE], and heart V40Gy[RBE]. Boxes in khaki are the results from Group R‐L, while blue boxes are the results from Group S‐I. Numbers on the top are P‐values from Wilcoxon signed‐rank test. P‐values that indicate statistical significance (<0.05) are in red and italicized.
3.B. Plan robustness
On the averaged 4D‐CT, compared to Group R‐L, Group S‐I had significantly better plan robustness for lung V5Gy[RBE] (median value: 0.80 vs 1.85%; P = 0.047), but significantly worse plan robustness for CTVhigh D95% (median value: 2.48 vs 1.49%; P = 0.013). The robustness for other structures was comparable [Figs. 5(a)–5(f)]. On the maximum inhalation phase, significantly better plan robustness of lung V5Gy[RBE] (median value: 0.84 vs 2.21%; P = 0.047) in Group S‐I was observed, whereas significantly better plan robustness of CTVhigh D2cc (median value: 4.02 vs 2.54%; P = 0.017) was observed in Group R‐L [Figs. 6(a)–6(f)]. On the maximum exhalation phase, no significant differences for any DVH indices from both groups were observed [Figs. 7(a)–7(f)].
Fig. 5.
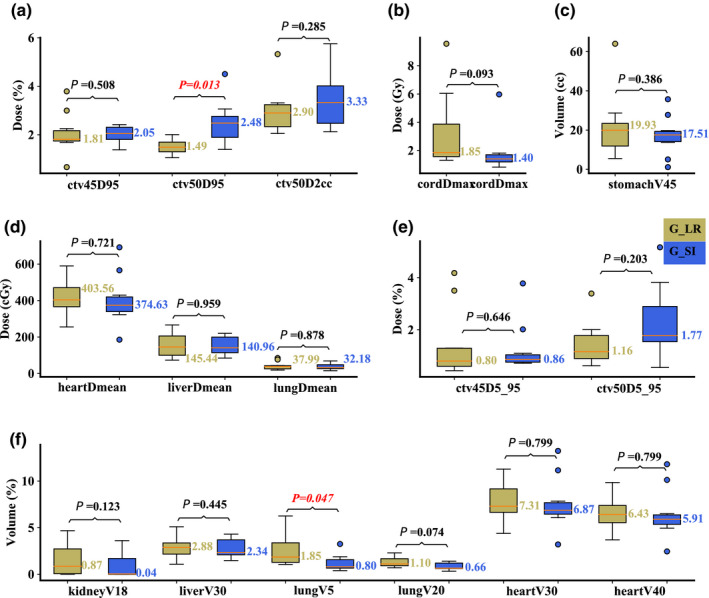
Comparison of the dose‐volume‐histogram bandwidths between plans of Group S‐I and Group R‐L on the averaged 4D‐CT. (a) Normalized CTVhigh D95% and CTVhigh D2cc, (b) spinal cord Dmax, (c) stomach V45Gy[RBE]cc, (d) heart Dmean, liver Dmean, and lung Dmean, (e) normalized CTVlow D5%‐D95% and CTVhigh D5%‐D95%, and (f) normalized volume of kidney V18Gy[RBE], liver V30Gy[RBE], lung V5Gy[RBE], lung V20Gy[RBE], heart V30Gy[RBE], and heart V40Gy[RBE]. Boxes in khaki are the results from Group R‐L, while blue boxes are the results from Group S‐I. Numbers on the top are P‐values from Wilcoxon signed‐rank test. P‐values that indicate statistical significance (<0.05) are in red and italicized.
Fig. 6.
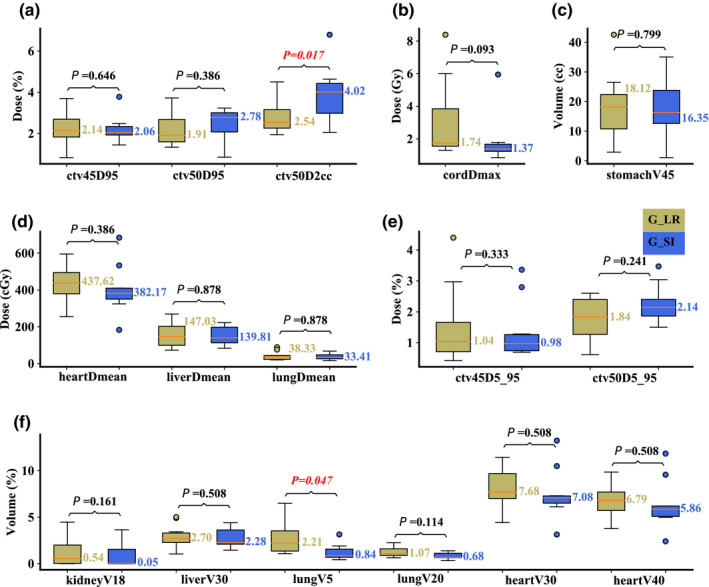
Comparison of the dose‐volume‐histogram bandwidths between plans of Group S‐I and Group R‐L on the maximum inhalation phase. (a) Normalized CTVhigh D95% and CTVhigh D2cc, (b) spinal cord Dmax, (c) stomach V45Gy[RBE]cc, (d) heart Dmean, liver Dmean, and lung Dmean, (e) normalized CTVlow D5%‐D95% and CTVhigh D5%‐D95%, and (f) normalized volume of kidney V18Gy[RBE], liver V30Gy[RBE], lung V5Gy[RBE], lung V20Gy[RBE], heart V30Gy[RBE], and heart V40Gy[RBE]. Boxes in khaki are the results from Group R‐L, while blue boxes are the results from Group S‐I. Numbers on the top are P‐values from Wilcoxon signed‐rank test. P‐values that indicate statistical significance (<0.05) are in red and italicized.
Fig. 7.
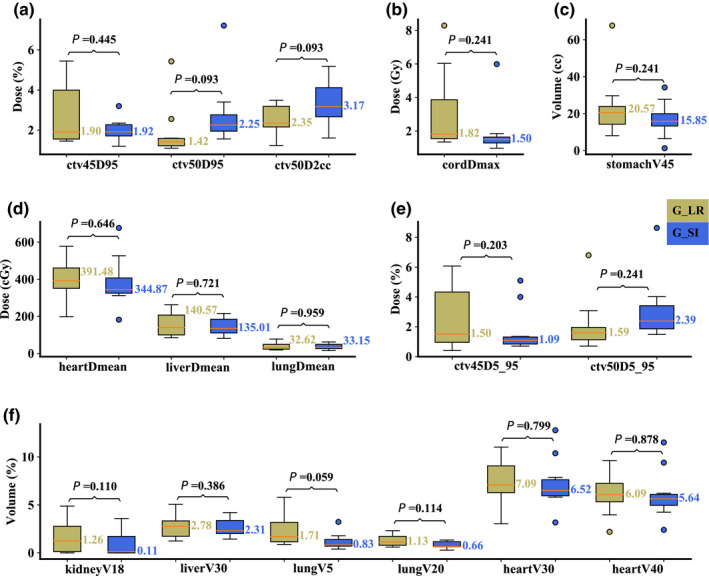
Comparison of the dose‐volume‐histogram bandwidths between plans of Group S‐I and Group R‐L on the maximum exhalation phase. (a) Normalized CTVhigh D95% and CTVhigh D2cc, (b) spinal cord Dmax, (c) stomach V45Gy[RBE]cc, (d) heart Dmean, liver Dmean, and lung Dmean, (e) normalized CTVlow D5%‐D95% and CTVhigh D5%‐D95%, and (f) normalized volume of kidney V18Gy[RBE], liver V30Gy[RBE], lung V5Gy[RBE], lung V20Gy[RBE], heart V30Gy[RBE], and heart V40Gy[RBE]. Boxes in khaki are the results from Group R‐L, while blue boxes are the results from Group S‐I. Numbers on the top are P‐values from Wilcoxon signed‐rank test. P‐values that indicate statistical significance (<0.05) are in red and italicized.
3.C. Interplay effect
Compared to Group R‐L, Group S‐I resulted in significantly better liver Dmean (median value: 575.22 vs 815.19 cGy; P = 0.022), heart Dmean (median value: 131.82 vs 372.75 cGy; P = 0.028), lung Dmean (median value: 247.77 vs 357.27 cGy; P = 0.047), lung V5Gy[RBE] (median value: 8.64 vs 15.46%; P = 0.028), and heart V30Gy[RBE] (median value: 9.13 vs 13.3%; P = 0.022). Group R‐L performed significantly better in spinal cord Dmax (median value: 40.55 vs 38.26 Gy; P = 0.047). All other DVH indices were comparable [Figs. 8(a)–8(f)].
Fig. 8.
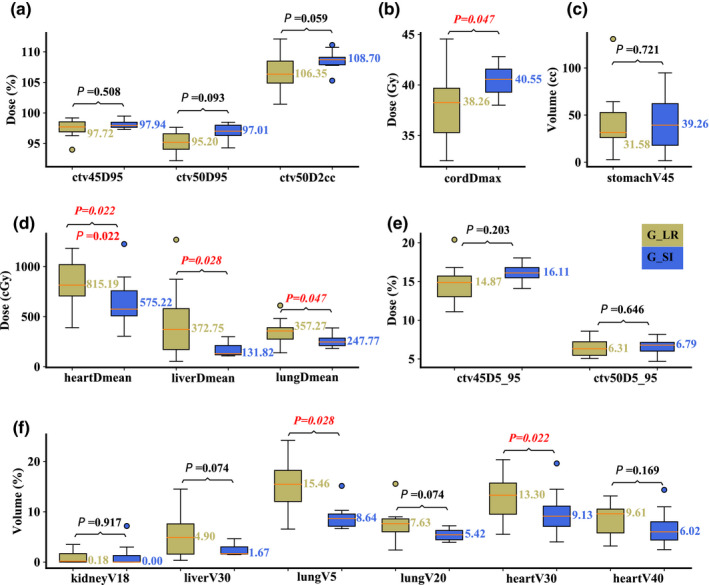
Comparison of the dose‐volume‐histogram indices between plans of Group S‐I and Group R‐L with interplay effect considered. (a) Normalized CTVhigh D95% and CTVhigh D2cc, (b) spinal cord Dmax, (c) stomach V45Gy[RBE]cc, (d) heart Dmean, liver Dmean, and lung Dmean, (e) normalized CTVlow D5%‐D95% and CTVhigh D5%‐D95%, and (f) normalized volume of kidney V18Gy[RBE], liver V30Gy[RBE], lung V5Gy[RBE], lung V20Gy[RBE], heart V30Gy[RBE], and heart V40Gy[RBE]. Boxes in khaki are the results from Group R‐L, while blue boxes are the results from Group S‐I. Numbers on the top are P‐values from Wilcoxon signed‐rank test. P‐values that indicate statistical significance (<0.05) are in red and italicized.
3.D. NTCP
Pericarditis, liver failure, and pneumonitis are considered as the endpoints for heart, liver, and lung, respectively, in the NTCP calculation. Seven of 10 patients from the Group S‐I had lower NTCP for heart, 9 of 10 patients from the Group S‐I had lower NTCP for liver, while the NTCP for lung from almost all patients was zero (Table 3). Significant NTCP for liver from patients of Group S‐I was observed (median value: 0.0000 vs 0.0027 %; P = 0.0208). NTCP for heart and lung was comparable (Table 4).
Table 3.
Normal tissue complication probability (NTCP) results for heart, lung, and liver.
| Group S‐I | Group R‐L | ||||||
|---|---|---|---|---|---|---|---|
| Patient # | Pericarditis % | Liver failure % | Pneumonitis % | Patient # | Pericarditis % | Liver failure % | Pneumonitis % |
| 1 | 0.0002 | 0.0000 | 0.0000 | 1 | 0.0039 | 0.0351 | 0.0004 |
| 2 | 0.0029 | 0.0000 | 0.0000 | 2 | 0.0046 | 0.0009 | 0.0000 |
| 3 | 0.0002 | 0.0013 | 0.0000 | 3 | 0.0027 | 0.0043 | 0.0000 |
| 4 | 0.0000 | 0.0000 | 0.0000 | 4 | 0.0006 | 0.0000 | 0.0000 |
| 5 | 0.0001 | 0.0000 | 0.0000 | 5 | 0.0072 | 0.0050 | 0.0000 |
| 6 | 0.0007 | 0.0001 | 0.0000 | 6 | 0.0032 | 0.0000 | 0.0000 |
| 7 | 0.0650 | 0.0014 | 0.0000 | 7 | 0.0095 | 0.0857 | 0.0000 |
| 8 | 0.0002 | 0.0000 | 0.0000 | 8 | 0.0003 | 0.0011 | 0.0000 |
| 9 | 0.0173 | 0.0000 | 0.0000 | 9 | 0.0050 | 0.0266 | 0.0000 |
| 10 | 0.0008 | 0.0001 | 0.0000 | 10 | 0.0001 | 0.0000 | 0.0000 |
Table 4.
Statistical comparison of normal tissue complication probability (NTCP) results for heart, lung, and liver.
| Endpoint | Group S‐I Median (range) | Group R‐L Median (range) | P‐value a |
|---|---|---|---|
| Pericarditis | 0.0004 (0.0000,0.0029) | 0.0036 (0.0001,0.0095) | 0.5748 |
| Liver failure | 0.0000 (0.0000,0.0001) | 0.0027 (0.0000,0.0351) | 0.0208 |
| Pneumonitis | 0.0000 (0.0000,0.0000) | 0.0000 (0.0000,0.0000) | 0.3173 |
The Wilcoxon signed‐rank test was used.
4. DISCUSSION
As the first group to do so, in this paper, we evaluated the impacts of two different beam angle configurations in the IMPT treatment planning for distal esophageal carcinoma. The comparisons were carried out between the groups of S‐I oblique posterior versus R‐L oblique posterior beams. The assessments of plan quality in the nominal scenario and plan robustness with 13 uncertainty scenarios were carried out on the averaged 4D‐CT, the maximum inhalation phase, and the maximum exhalation phase, respectively. At last, interplay effect evaluation using the 4D dynamic dose calculation was performed.
For all patients, Orfit board and thermoplastic masks (Orfit, Wijnegem, Belgium) were used for immobilization to mitigate the setup variations. Different from other proton machines in the market, our treatment gantries are only half rotating. Therefore, there is no difference in the setup residual errors for the two different treatment angles since both involve couch and gantry rotation. However, it is true that for proton machines with full rotation, only gantry rotation is involved in the R‐L oblique posterior beam angle setting, while both couch and gantry rotation are involved in the S‐I oblique posterior beam angle setting. The latter might introduce additional setup residual errors in the treatment of distal esophageal carcinoma.
The idea of altering the IMPT beam angle from posterior R‐L oblique to posterior S‐I oblique pairs was initially motivated by the hypothesis‐generating inquiry that S‐I oblique posterior beams would better spare adjacent OARs located laterally to the target and have better plan robustness by going along with the S‐I axis that usually has the largest amount of respiratory motion. Generally speaking, on one hand, the R‐L oblique posterior beams have more potential to penetrate the nearby OARs, such as kidneys, lungs, liver etc., while the S‐I oblique posterior beams would have less beam paths through the diaphragm radially. On the other hand, the S‐I oblique posterior beams may traverse more volume of the spinal cord, thus possibly resulting in higher dose to this OAR. With the expected increased but clinically acceptable maximum spinal cord dose, the possible benefits of better OAR sparing and better plan robustness to respiratory motion make the evaluation of S‐I oblique posterior beam angles worthwhile—particularly for anatomically midline and posterior targets, such as distal esophageal cancer and pancreatic tumors, which can be affected by respiratory motion. Our findings confirmed this hypothesis, as reasonable amounts of potentially beneficial reductions of radiation dose in lungs, liver, and heart were observed in Group S‐I, with a slightly higher—but clinically acceptable—spinal cord maximum dose. It is important to note that all plans in Group S‐I still met our institutional dose‐volume constraints for spinal cord. Clinically, we observed no spinal cord toxicity as a result of this approach to date. 65 Additionally, even though the slight worse hot spot control in target volume from Group S‐I was observed, we believe this had little influence for the plan for two reasons. First, the difference was quite small, <2%, and evidently under clinically acceptable level. Second, during respiratory motion, the most hot spot in a plan would mostly stay within the target volume, or occasionally move to one of the adjacent organs: lung, liver, and heart. All these organs are parallel‐type organs that have relatively large volume effect, especially for lung. Thus, the dose‐response may be closer to mean dose rather than the hot spot. In fact, comparable or even better mean dose results in these organs were observed in Group S‐I, which could be confirmed by the comparable or even better NTCP results.
As for plan robustness, using different beam angles did not appear to produce any adverse impact with the Group S‐I approach. This is understandable because identical optimization methods were applied. Group S‐I had even better plan robustness with regard to lung protection. The better plan robustness for lung from Group S‐I was expected as the new beam angles would traverse less lung volumes, and better focus proton delivery to the posterior mediastinal areas where the targets were located. Comparatively, Group R‐L beams would pass through a larger amount of lung tissue in the transverse dimension. Therefore, any misalignment or anatomical change in patients would have a larger impact on Group R‐L patients, which was demonstrated by our data. With regard to interplay effect considered, the better sparing of lung, liver, and heart in the Group S‐I patients demonstrated in our study could be attributed to the comprehension that the S‐I obliquely placed posterior beams would have better insensitivity to respiratory motion. Thus, clinically it should be chosen routinely for IMPT planning. At our institution, S‐I posterior oblique beams are now the preferred beam angle choice for distal esophageal cancer patients treated with IMPT.
This study has certain limitations. First, the patient groups chosen were heterogeneous and small in number, and also there may exist other characteristics that could bias the results. To help mitigate this effect, best efforts were given to match the CTV sizes and respiratory motion amplitude, so that the two groups became comparable both anatomically and also clinically, on the consensus that all patients had distal esophageal cancers requiring IMPT treatments. Second, our clinical experience as a new proton center is still relatively small 65 ; we await more cancer patients’ proton experience in the future so we could help validate this experience with a larger patient cohort. Third, proton beam distal effects on OARs were not considered in this study. High linear energy transfer (LET) may appear in the distal fall‐off regions of a proton beam and may cause unexpected AEs to nearby OARs. At our institution, every plan will receive a second dose and LET calculation 66 , 67 , 68 after the plan is generated by our TPS (EclipseTM). The physicists and the attending physician will then check for overlap of high dose (at least 50% of the prescription dose) and high LET (at least 6 keV/µm) in nearby OARs during the LET‐guided plan evaluation. If high overlap is observed, the plan will be adjusted to minimize the overlap in nearby OARs. Finally, we caution that this experience should not be generically applied to patients in the setting of re‐irradiation, where spinal cord dose is often the limiting factor in terms of what is achievable. Our ultimate recommendation of using an S‐I oblique posterior beam arrangement as the baseline approach should always be based on the recognition that cases should still be evaluated on an individual basis.
5. CONCLUSIONS
When compared to the IMPT plans with R‐L oblique posterior beam arrangement, IMPT plans with S‐I oblique posterior beams had better sparing of liver, heart, and lungs, whereas resulted in a slight increase in the maximum dose of the spinal cord. Both sets of beam angle configurations resulted in clinically acceptable plan robustness. Moreover, S‐I oblique posterior beam angles led to more interplay‐effect resilient IMPT plans for distal esophageal cancer treatment. This study supports our choice of clinically using the S‐I posterior oblique beams, instead of R‐L posterior oblique beams, as our preferred method for the IMPT treatment of patients with distal esophageal carcinoma requiring chemoradiation.
CONFLICT OF INTEREST
Terence T. Sio, MD, MS, provides strategic and scientific recommendations as a member of the Advisory Board and speaker for Novocure, Inc. This position has no relation to this manuscript. All other authors have no additional conflict to disclose.
ETHICAL CONSIDERATIONS
This research was approved by the Mayo Clinic Arizona institutional review board (IRB, 13‐005709). The informed consent was waived by IRB protocol. Only image and dose‐volume data were used in this study. All patient‐related health information was removed prior to the analysis and also publication of the study.
Supporting information
Table S1. Details of Beam Angle (G for gantry, T for table), IMPT machine characteristics, and beam energy information.
Table S2. Details of tumor motion amplitude in three directions.
ACKNOWLEDGMENTS
This research was supported by the National Cancer Institute (NCI) Career Developmental Award K25CA168984, Arizona Biomedical Research Commission Investigator Award, the Lawrence W. and Marilyn W. Matteson Fund for Cancer Research, and the Kemper Marley Foundation.
T.T.S, W.G.R, R.S.B, M.F, W.W.W, S.E.S, J.B.A, and W.L conceived and planned the experiments. T.T.S, W.G.R, R.S.B, W.W.W, S.E.S, and J.B.A carried out the experiments. M. F. and W.L planned and carried out the simulations. H. F, P. L, C. P, S. K, and W. L contributed to sample preparation. H. F, T. T. S, W. G. R, R. S. B, W.W.W, S. E. S, J. B. A, and W. L contributed to the interpretation of the results. H. F took the lead in writing the manuscript. All authors provided critical feedback and helped shape the research, analysis, and manuscript.
REFERENCES
- 1. Bray F, Ferlay J, Soerjomataram I, Siegel RL, Torre LA, Jemal A. Global cancer statistics 2018: GLOBOCAN estimates of incidence and mortality worldwide for 36 cancers in 185 countries. CA: Cancer J Clin. 2018;68:394–424. [DOI] [PubMed] [Google Scholar]
- 2. Siegel RL, Miller KD, Jemal A. Cancer statistics, 2020. CA: Cancer J Clin. 2020;70:7–30. [DOI] [PubMed] [Google Scholar]
- 3. Kole TP, Aghayere O, Kwah J, Yorke ED, Goodman KA. Comparison of heart and coronary artery doses associated with intensity‐modulated radiotherapy versus three‐dimensional conformal radiotherapy for distal esophageal cancer. Int J Radiat Oncol Biol Phys. 2012;83:1580–1586. [DOI] [PubMed] [Google Scholar]
- 4. Gharzai L, Verma V, Denniston KA, Bhirud AR, Bennion NR, Lin C. Radiation therapy and cardiac death in long‐term survivors of esophageal cancer: an analysis of the surveillance, epidemiology, and end result database. PLoS One. 2016;11:e0158916. [DOI] [PMC free article] [PubMed] [Google Scholar]
- 5. Water TA, Bijl HP, Schilstra C, Pijls‐Johannesma M, Langendijk JA. The potential benefit of radiotherapy with protons in head and neck cancer with respect to normal tissue sparing: a systematic review of literature. Oncologist. 2011;16:366–377. [DOI] [PMC free article] [PubMed] [Google Scholar]
- 6. Lin A, Swisher‐McClure S, Millar LB, et al. Proton therapy for head and neck cancer: current applications and future directions. Transl Cancer Res. 2012;1:255–263. [Google Scholar]
- 7. Frank SJ, Cox JD, Gillin M, et al. Multifield optimization intensity modulated proton therapy for head and neck tumors: a translation to practice. Int J Radiat Oncol Biol Phys. 2014;89:846–853. [DOI] [PMC free article] [PubMed] [Google Scholar]
- 8. Schild SE, Rule WG, Ashman JB, et al. Proton beam therapy for locally advanced lung cancer: a review. World J Clin Oncol. 2014;5:568–575. [DOI] [PMC free article] [PubMed] [Google Scholar]
- 9. Lomax AJ. Intensity modulated proton therapy and its sensitivity to treatment uncertainties 1: the potential effects of calculational uncertainties. Phys Med Biol. 2008;53:1027–1042. [DOI] [PubMed] [Google Scholar]
- 10. Lomax AJ. Intensity modulated proton therapy and its sensitivity to treatment uncertainties 2: the potential effects of inter‐fraction and inter‐field motions. Phys Med Biol. 2008;53:1043–1056. [DOI] [PubMed] [Google Scholar]
- 11. Lomax AJ, Pedroni E, Rutz H, Goitein G. The clinical potential of intensity modulated proton therapy. Z Med Phys. 2004;2004:147–152. [DOI] [PubMed] [Google Scholar]
- 12. Kraus KM, Heath E, Oelfke U. Dosimetric consequences of tumor motion due to respiration for a scanned proton beam. Phys Med Biol. 2011;56:6563–6581. [DOI] [PubMed] [Google Scholar]
- 13. Phillips MH, Pedroni E, Blattmann H, Boehringer T, Coray A, Scheib S. Effects of respiration motion on dose uniformity with a charged particle scanning method. Phys Med Biol. 1992;37:223–233. [DOI] [PubMed] [Google Scholar]
- 14. Lambert J, Suchowerska N, McKenzie DR, Jackson M. Intrafractional motion during proton beam scanning. Phys Med Biol. 2005;50:4853–4862. [DOI] [PubMed] [Google Scholar]
- 15. Grozinger SO, Bert C, Haberer T, Kraft G, Rietzel E. Motion compensation with a scanned ion beam: a technical feasibility study. Radiat Oncol. 2008;3:3–34. [DOI] [PMC free article] [PubMed] [Google Scholar]
- 16. Seco J, Robertson D, Trofimov A, Paganetti H. Breathing interplay effects during proton beam scanning: simulation and statistical analysis. Phys Med Biol. 2009;54:N283–N294. [DOI] [PubMed] [Google Scholar]
- 17. Grozinger SO, Rietzel E, Li Q, Bert C, Haberer T, Kraft G. Simulations to design an online motion compensation system for scanned particle beams. Phys Med Biol. 2006;51:3517–3531. [DOI] [PubMed] [Google Scholar]
- 18. Dowdell S, Grassberger C, Sharp GC, Paganetti H. Interplay effects in proton scanning for lung: a 4D Monte Carlo study assessing the impact of tumor and beam delivery parameters. Phys Med Biol. 2013;58:4137–4156. [DOI] [PMC free article] [PubMed] [Google Scholar]
- 19. Grassberger C, Dowdell S, Lomax A, et al. Motion interplay as a function of patient parameters and spot size in spot scanning proton therapy for lung cancer. Int J Radiat Oncol Biol Phys. 2013;86:380–386. [DOI] [PMC free article] [PubMed] [Google Scholar]
- 20. Knopf A‐C, Hong TS, Lomax A. Scanned proton radiotherapy for mobile targets‐the effectiveness of re‐scanning in the context of different treatment planning approaches and for different motion characteristics. Phys Med Biol. 2011;56:7257–7271. [DOI] [PubMed] [Google Scholar]
- 21. Li Y, Kardar L, Li X, et al. On the interplay effects with proton scanning beams in stage III lung cancer. Med Phys. 2014;41:021721. [DOI] [PMC free article] [PubMed] [Google Scholar]
- 22. Kardar L, Li Y, Li X, et al. Evaluation and mitigation of the interplay effects of intensity modulated proton therapy for lung cancer in a clinical setting. Pract Radiat Oncol. 2014;2014:e259–e268. [DOI] [PMC free article] [PubMed] [Google Scholar]
- 23. Bortfeld T, Jokivarsi K, Goitein M, Kung J, Jiang SB. Effects of intra‐fraction motion on IMRT dose delivery: statistical analysis and simulation. Phys Med Biol. 2002;47:2203–2220. [DOI] [PubMed] [Google Scholar]
- 24. Pflugfelder D, Wilkens JJ, Oelfke U. Worst case optimization: a method to account for uncertainties in the optimization of intensity modulated proton therapy. Phys Med Biol. 2008;53:1689–1700. [DOI] [PubMed] [Google Scholar]
- 25. Unkelbach J, Bortfeld T, Martin BC, Soukup M. Reducing the sensitivity of IMPT treatment plans to setup errors and range uncertainties via probabilistic treatment planning. Med Phys. 2009;36:149–163. [DOI] [PMC free article] [PubMed] [Google Scholar]
- 26. Fredriksson A, Forsgren A, Hardemark B. Minimax optimization for handling range and setup uncertainties in proton therapy. Med Phys. 2011;38:1672–1684. [DOI] [PubMed] [Google Scholar]
- 27. Liu W, Zhang X, Li Y, Mohan R. Robust optimization in intensity‐modulated proton therapy. Med Phys. 2012;39:1079–1091. [DOI] [PMC free article] [PubMed] [Google Scholar]
- 28. Liu W, Li Y, Li X, Cao W, Zhang X. Influence of robust optimization in intensity‐modulated proton therapy with different dose delivery techniques. Med Phys. 2012;39:3089–3101. [DOI] [PMC free article] [PubMed] [Google Scholar]
- 29. Chen W, Unkelbach J, Trofimov A, et al. Including robustness in multi‐criteria optimization for intensity‐modulated proton therapy. Phys Med Biol. 2012;57:591–608. [DOI] [PMC free article] [PubMed] [Google Scholar]
- 30. Liu W, Liao Z, Schild SE, et al. Impact of respiratory motion on worst‐case scenario optimized intensity modulated proton therapy for lung cancers. Pract Radiat Oncol. 2015;2015:e77–86. [DOI] [PMC free article] [PubMed] [Google Scholar]
- 31. Unkelbach J, Alber M, Bangert M, et al. Robust radiotherapy planning. Phys Med Biol. 2018;63:22TR02. [DOI] [PubMed] [Google Scholar]
- 32. An Y, Liang JM, Schild SE, Bues M, Liu W. Robust treatment planning with conditional value at risk chance constraints in intensity‐ modulated proton therapy. Med Phys. 2017;44:28–36. [DOI] [PMC free article] [PubMed] [Google Scholar]
- 33. An Y, Shan J, Patel SH, et al. Robust intensity‐modulated proton therapy to reduce high linear energy transfer in organs at risk. Med Phys. 2017;44:6138–6147. [DOI] [PMC free article] [PubMed] [Google Scholar]
- 34. Liu C, Bhangoo RS, Sio TT, et al. Dosimetric comparison of distal esophageal carcinoma plans for patients treated with small‐spot intensity‐modulated proton versus volumetric‐modulated arc therapies. J Appl Clin Med Phys. 2019;20:15–27. [DOI] [PMC free article] [PubMed] [Google Scholar]
- 35. Liu C, Patel SH, Shan J, et al. Robust optimization for intensity‐modulated proton therapy to redistribute high linear energy transfer (LET) from nearby critical organs to tumors in head and neck cancer. Int J Radiat Oncol Biol Phys. 2020. 10.1016/j.ijrobp.2020.01.013. [DOI] [PubMed] [Google Scholar]
- 36. Liu C, Sio TT, Deng W, et al. Small‐spot intensity‐modulated proton therapy and volumetric‐modulated arc therapies for patients with locally advanced non‐small‐cell lung cancer: a dosimetric comparative study. J Appl Clin Med Phys. 2018;19:140–148. [DOI] [PMC free article] [PubMed] [Google Scholar]
- 37. Liu C, Yu NY, Shan J, et al. Technical Note: treatment planning system (TPS) approximations matter ‐ comparing intensity‐modulated proton therapy (IMPT) plan quality and robustness between a commercial and an in‐house developed TPS for nonsmall cell lung cancer (NSCLC). Med Phys. 2019;46:4755–4762. [DOI] [PubMed] [Google Scholar]
- 38. Liu CB, Schild SE, Chang JY, et al. Impact of spot size and spacing on the quality of robustly optimized intensity modulated proton therapy plans for lung cancer. Int J Radiat Oncol Biol Phys. 2018;101:479–489. [DOI] [PMC free article] [PubMed] [Google Scholar]
- 39. Liu W, inventor; System and Method For Robust Intensity‐modulated Proton Therapy Planning. U.S. patent application 62–044‐585; 2014.
- 40. Liu W., Robustness quantification and robust optimization in intensity‐modulated proton therapy In: Rath A, Sahoo N, eds. Particle Radiotherapy: Emerging Technology for Treatment of Cancer, Berlin: Springer; 2015. [Google Scholar]
- 41. Liu W, Frank SJ, Li X, et al. Effectiveness of robust optimization in intensity‐modulated proton therapy planning for head and neck cancers. Med Phys. 2013;40:51711–51718. [DOI] [PMC free article] [PubMed] [Google Scholar]
- 42. Liu W, Frank SJ, Li X, Li Y, Zhu RX, Mohan R. PTV‐based IMPT optimization incorporating planning risk volumes vs robust optimization. Med Phys. 2013;40:21709–21718. [DOI] [PMC free article] [PubMed] [Google Scholar]
- 43. Liu W, Mohan R, Park P, et al. Dosimetric benefits of robust treatment planning for intensity modulated proton therapy for base‐of‐skull cancers. Pract Radiat Oncol. 2014;4:384–391. [DOI] [PMC free article] [PubMed] [Google Scholar]
- 44. Liu W, Patel SH, Harrington DP, et al. Exploratory study of the association of volumetric modulated arc therapy (VMAT) plan robustness with local failure in head and neck cancer. J Appl Clin Med Phys. 2017;18:76–83. [DOI] [PMC free article] [PubMed] [Google Scholar]
- 45. Liu W, Schild SE, Chang JY, et al. Exploratory study of 4D versus 3D robust optimization in intensity modulated proton therapy for lung cancer. Int J Radiat Oncol Biol Phys. 2016;95:523–533. [DOI] [PMC free article] [PubMed] [Google Scholar]
- 46. Shan J, An Y, Bues M, Schild SE, Liu W. Robust optimization in IMPT using quadratic objective functions to account for the minimum MU constraint. Med Phys. 2018;45:460–469. [DOI] [PMC free article] [PubMed] [Google Scholar]
- 47. Shan J, Sio TT, Liu C, Schild SE, Bues M, Liu W. A novel and individualized robust optimization method using normalized dose interval volume constraints (NDIVC) for intensity‐modulated proton radiotherapy. Med Phys. 2018;46:382–393. [DOI] [PubMed] [Google Scholar]
- 48. Tryggestad EJ, Liu W, Pepin MD, Hallemeier CL, Sio TT. Managing treatment‐related uncertainties in proton beam radiotherapy for gastrointestinal cancers. J Gastrointest Oncol. 2020;11:212–224. [DOI] [PMC free article] [PubMed] [Google Scholar]
- 49. Ohara K, Okumura T, Akisada M, et al. Irradiation synchronized with respiration gate. Int J Radiat Oncol Biol Phys. 1989;17:853–857. [DOI] [PubMed] [Google Scholar]
- 50. Zenklusen SM, Pedroni E, Meer D. A study on repainting strategies for treating moderately moving targets with proton pencil beam scanning at the new Gantry 2 at PSI. Phys Med Biol. 2010;55:5103–5121. [DOI] [PubMed] [Google Scholar]
- 51. Bert C, Saito N, Schmidt A, Chaudhri N, Schardt D, Rietzel E. Target motion tracking with a scanned particle beam. Med Phys. 2007;34:4768–4771. [DOI] [PubMed] [Google Scholar]
- 52. Riboldi M, Orecchia R, Baroni G. Real‐time tumour tracking in particle therapy: technological developments and future perspectives. Lancet Oncol. 2012:e383–e391.. [DOI] [PubMed] [Google Scholar]
- 53. Graeff C. Motion mitigation in scanned ion beam therapy through 4D‐optimization. Physica Medica‐Eur J Med Phys. 2014;30:570–577. [DOI] [PubMed] [Google Scholar]
- 54. Bernatowicz K, Zhang Y, Perrin R, Weber DC, Lomax AJ. Advanced treatment planning using direct 4D optimisation for pencil‐beam scanned particle therapy. Phys Med Biol. 2017;62:6595–6609. [DOI] [PubMed] [Google Scholar]
- 55. Engwall E, Fredriksson A, Glimelius L. 4D robust optimization including uncertainties in time structures can reduce the interplay effect in proton pencil beam scanning radiation therapy. Med Phys. 2018;45:4020–4029. [DOI] [PubMed] [Google Scholar]
- 56. Zhang X, Guerrero TM, Mcguire SE, et al. Four‐dimensional computed tomography–based treatment planning for intensity‐modulated radiation therapy and proton therapy for distal esophageal cancer. Int J Radiat Oncol Biol Phys. 2008;72:278–287. [DOI] [PMC free article] [PubMed] [Google Scholar]
- 57. Shiraishi Y, Xu C, Yang J, Komaki R, Lin SH. Dosimetric comparison to the heart and cardiac substructure in a large cohort of esophageal cancer patients treated with proton beam therapy or Intensity‐modulated radiation therapy. Radiother Oncol. 2017;125:48–54. [DOI] [PubMed] [Google Scholar]
- 58. Lin SH, Merrell KW, Shen J, et al. Multi‐institutional analysis of radiation modality use and postoperative outcomes of neoadjuvant chemoradiation for esophageal cancer. Radiother Oncol. 2017;123:376–381. [DOI] [PubMed] [Google Scholar]
- 59. Lin SH, Hobbs BP, Verma V, et al. Randomized Phase IIB trial of proton beam therapy versus intensity‐modulated radiation therapy for locally advanced esophageal cancer. J Clin Oncol. 2020;38:1569–1579. [DOI] [PMC free article] [PubMed] [Google Scholar]
- 60. Shen J, Tryggestad E, Younkin JE, et al. Technical note: using experimentally determined proton spot scanning timing parameters to accurately model beam delivery time. Med Phys. 2017;44:5081–5088. [DOI] [PubMed] [Google Scholar]
- 61. Younkin J, Bues M, Keole S, Stoker J, Shen J. Multiple energy extraction reduces beam delivery time for a synchrotron‐based proton spot‐scanning system. Med Phys. 2017;44:2872. [DOI] [PMC free article] [PubMed] [Google Scholar]
- 62. Younkin JE, Bues M, Sio TT, et al. Multiple energy extraction reduces beam delivery time for a synchrotron‐based proton spot‐scanning system. Adv Radiat Oncol. 2018;3:412–420. [DOI] [PMC free article] [PubMed] [Google Scholar]
- 63. Niemierko A, Goitein M. Modeling of normal tissue response to radiation: the critical volume model. Int J Radiat Oncol Biol Phys. 1993;25:135–145. [DOI] [PubMed] [Google Scholar]
- 64. Gay HA, Niemierko A. A free program for calculating EUD‐based NTCP and TCP in external beam radiotherapy. Physica Med. 2007;23:115–125. [DOI] [PubMed] [Google Scholar]
- 65. Bhangoo RS, DeWees TA, Nathan YY, et al. Acute toxicities and short‐term patient outcomes after intensity‐modulated proton beam radiotherapy or intensity‐modulated photon radiotherapy for Esophageal Carcinoma: a single‐center experience. Adv Radiat Oncol. 2020;5:871–879. [DOI] [PMC free article] [PubMed] [Google Scholar]
- 66. Younkin JE, Morales DH, Shen J, et al. Clinical validation of a ray‐casting analytical dose engine for spot scanning proton delivery systems. Tech Cancer Res Treat. 2019;18:1533033819887182. [DOI] [PMC free article] [PubMed] [Google Scholar]
- 67. Deng W, Ding X, Younkin JE, et al. Hybrid 3D analytical linear energy transfer calculation algorithm based on precalculated data from Monte Carlo simulations. Med Phys. 2020;47:745–752. [DOI] [PubMed] [Google Scholar]
- 68. Deng W, Younkin JE, Souris K, et al. Integrating an open source Monte Carlo code “MCsquare” for clinical use in intensity‐modulated proton therapy. Med Phys. 2020;47:2558–2574. [DOI] [PubMed] [Google Scholar]
Associated Data
This section collects any data citations, data availability statements, or supplementary materials included in this article.
Supplementary Materials
Table S1. Details of Beam Angle (G for gantry, T for table), IMPT machine characteristics, and beam energy information.
Table S2. Details of tumor motion amplitude in three directions.