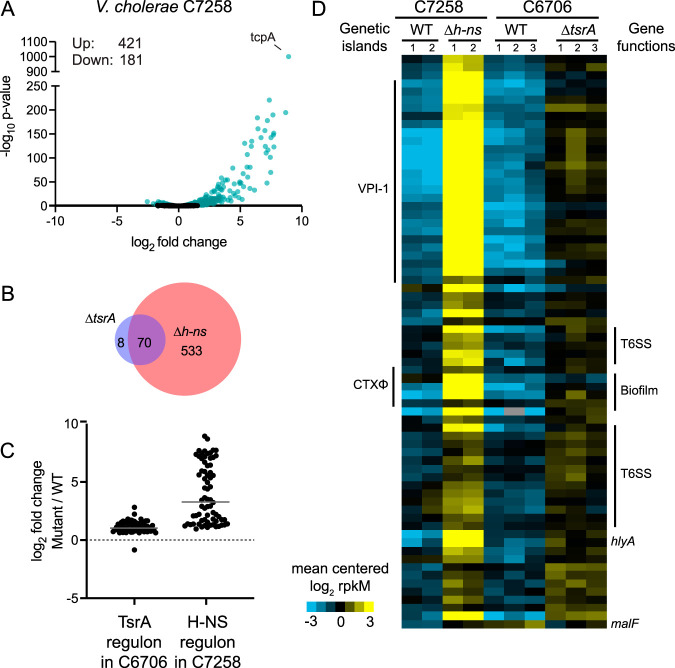
FIG 4.
The V. cholerae TsrA and H-NS regulons largely overlap. (A) Volcano plot representation of the differential expression analysis of the wild type versus the isogenic Δh-ns mutant of V. cholerae C7258 RNA-seq data sets. The x axis shows the log2 fold change in expression, and the y axis shows the log odds of a gene being differentially expressed (ac, –log10 P value). Genes are shown in blue if they pass the absolute confidence threshold (ac, ≥1.3; equivalent to a P value of ≤0.05). (B) Venn diagram of the overlap between the TsrA and H-NS regulon members of V. cholerae strains C6706 and C7258, respectively. (C) Fold changes between the ΔtsrA and Δh-ns mutants and wild-type strains of C6706 and C7258 in the expression of all differentially regulated genes in either regulon. The gray horizontal bar represents the mean fold change in each regulon, 2.2- and 16-fold, for the TsrA and H-NS regulons, respectively. (D) Heat map of mean-centered, log2-transformed expression values of members of the H-NS and TsrA regulons. Two and three biological replicates are depicted for the H-NS (47) and TsrA (this study) data sets, respectively. Each row in the heat map represents a gene, and each column in the heat map represents a sample (identified above the heat map); if no ortholog of the gene is found in the strain, the field is shaded gray. Genetic islands are indicated on the left of the heat map, and clusters of biofilm formation and T6SS genes are indicated on the right.

