

Summary
Invasion and proliferation are defining phenotypes of cancer, and in glioblastoma blocking one stimulates the other, implying that effective therapy must inhibit both, ideally through a single target that is also dispensable for normal tissue function. The molecular motor myosin 10 meets these criteria. Myosin 10 knockout mice can survive to adulthood, implying that normal cells can compensate for its loss; its deletion impairs invasion, slows proliferation, and prolongs survival in murine models of glioblastoma. Myosin 10 deletion also enhances tumor dependency on the DNA damage and the metabolic stress responses and induces synthetic lethality when combined with inhibitors of these processes. Our results thus demonstrate that targeting myosin 10 is active against glioblastoma by itself, synergizes with other clinically available therapeutics, may have acceptable side effects in normal tissues, and has potential as a heretofore unexplored therapeutic approach for this disease.
Subject Areas: Cell Biology, Cancer
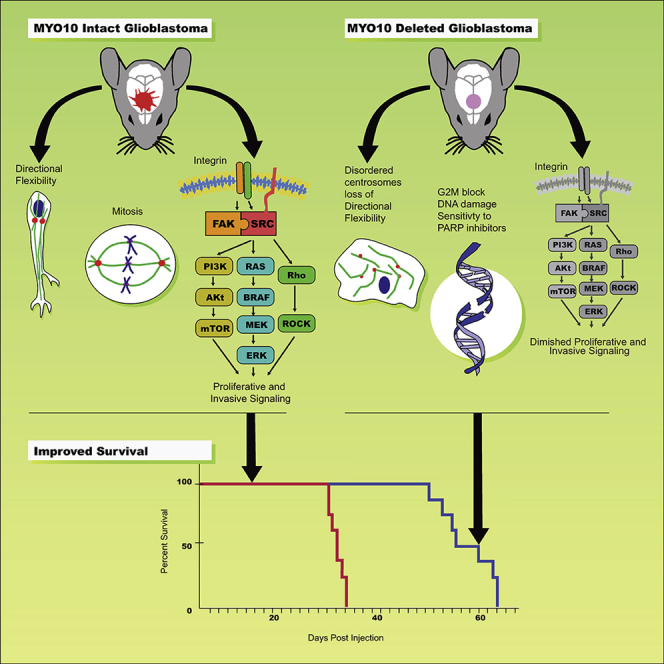
Graphical Abstract
Highlights
-
•
Myosin 10 provides glioblastoma cells with directional flexibility
-
•
Myosin 10 drives glioblastoma growth by stimulating integrin-dependent signaling
-
•
Myosin 10 deletion induces DNA damage and sensitizes tumors to PARP inhibitors
-
•
Targeting myosin 10 prolongs survival in mouse models of glioblastoma
Cell Biology; Cancer
Introduction
Glioblastoma (GBM) is among the most common and lethal of primary brain tumors, with a 5-year survival rate that has remained at approximately 5% in spite of decades of clinical investigation (Puduvalli and Hoang, 2018). Two of its defining phenotypes are its ability to proliferate uncontrollably within and to disperse widely throughout the brain (Giese and Westphal, 1996; Burger and Kleihues 1989). Previous studies have demonstrated that GBM cells either proliferate or invade and that inhibiting one stimulates the other (Dhruv et al., 2013; Picariello et al., 2019; Lu et al., 2012; Norden et al., 2008). We had recently shown that whereas targeting the molecular motor non-muscle myosin IIA (NMIIA) markedly impairs GBM invasion, it also accelerates tumor growth (Picariello et al., 2019). These findings led us to hypothesize that effective therapy requires targeting both proliferation and invasion. We had previously shown that targeting both the NMIIA and IIB isoforms together significantly impairs both invasion and proliferation, due to the roles these molecular motors play in mitosis and cell motility, and markedly prolongs survival in genetically engineered mouse models (GEMMs) of GBM (Picariello et al., 2019). Other molecular motors are also involved in both mitosis and motility. Targeting one of these, the kinesin Kif11, blocks GBM proliferation, invasion, and self-renewal (Venere et al., 2015) and prolongs survival in an orthotopic patient-derived xenograft (PDX) model. However, suppression of Kif11 in normal cells leads to mitotic catastrophe and apoptosis. Thus, we propose that a promising GBM target also needs to satisfy two additional criteria. First, it needs to be dispensable for normal cells, as evidenced by the presence of a viable knockout mouse. Second, its targeting should synergize with other therapies, as tumor cells often adapt to loss of one cellular component by activating others (Lathia et al., 2015).
The molecular motor myosin 10 (MYO10) meets these criteria. MYO10 is required for cell motility, which drives tumor metastasis (Kerber and Cheney, 2011; Plantard et al., 2010). It is upregulated in lung, prostate, and breast carcinomas; its level of expression in melanoma correlates with metastatic capacity; and its deletion reduces metastases and prolongs survival in a mouse model of melanoma (Bidkhori et al., 2013; Cao et al., 2014; Arjonen et al., 2014; Sun et al., 2015; Makowska et al., 2015; Tokuo et al., 2018). In addition, MYO10 plays a role in mitosis by localizing a variety of mitotic and spindle regulators, including microtubules, TPX2, and Wee1, through the MyTH4/FERM domain in its C-terminal tail (Kwon et al., 2015; Woolner et al., 2008; Sandquist et al., 2018). MYO10 also binds several signaling proteins, including β integrins and PKCι (Zhang et al., 2004; Linch et al., 2013). Furthermore, the MYO10 C-terminal tail contains three pleckstrin homology (PH) domains that bind signaling phosphatidyl inositols (Plantard et al., 2010; Cox et al., 2002). Finally, although ~50% of MYO10 knockout mice die at or before birth due to severe neural tube closure defects, the remainder are born with only minor defects, grow to adulthood, and breed successfully, implying that otherwise normal cells can compensate for the loss of this motor (Tokuo et al., 2018; Heimsath et al., 2017).
In this study, we have examined the roles MYO10 plays in GBM biology. We show that targeting MYO10 impairs GBM invasion, slows tumor proliferation, reduces integrin-related signaling, and prolongs survival in GEMMs. However, MYO10 deletion also induces GBMs to activate compensatory processes, including the DNA damage and metabolic stress responses, and inhibiting these is synthetically lethal in the face of MYO10 deletion. Thus, while a MYO10 inhibitor for GBM may be therapeutic and relatively non-toxic, it may also synergize with inhibitors of pathways that it modulates through induction of synthetic lethality. These features highlight the potential that MYO10 has as a therapeutic target in GBM.
Results
Deletion of MYO10 Prolongs Survival in Rodent Models of GBM and Impairs Tumor Dispersion In Vivo
We queried The Cancer Genome Atlas database for MYO10 expression across GBM subtypes (Figure 1A). Compared with brain (B), MYO10 mRNA is upregulated in both the classical (C) and proneural (P) GBM subtypes (two-tailed t test), whereas differences between brain (B) and mesenchymal GBM (M) are not significant. We also assessed the expression of MYO10 at the protein level in human brain, astrocytoma, and GBM. MYO10 protein expression is approximately 2-fold higher in GBM than in either the astrocytoma or the brain (Figure 1B, two-tailed t test).
Figure 1.

MYO10 Deletion Prolongs Survival in GBM and Reduces Tumor Cell Dispersion In Vivo
(A) MYO10 gene expression from The Cancer Genome Atlas database from brain (B) and classical (C), mesenchymal (M), and proneural (P) GBM.
(B) Tumor lysates from human resection specimens of brain (B), astrocytoma (A), and GBM were blotted for MYO10 (left) and actin (right). Data plotted as mean ± 1 SD.
(C) Illustration of the murine proneural GBM model.
(D) Kaplan-Meier survival curves for mice with TP53- (blue dashed), TP53 and MYO10- (red dashed), PTEN- (blue solid), and PTEN and MYO10 (red solid)-deleted tumors (p values derived from log rank test).
(E) Primary tumor cell lines deleted for PTEN or for PTEN and MYO10 were probed for MYO10 expression by western blot. Both RPE1 and PTEN(−/−) cells express the full length MYO10 gene product (blue arrow). PTEN(−/−) cells also express a truncated species with the expected Mr for the “headless” isoform of MYO10 (red arrow).
(F) Mice with TP53 (left) or TP53 and MYO10 (right)-deleted tumors were sacrificed at the time of tumor morbidity, brains were excised, and stained for the hemagglutinin (HA) epitope. In the upper images (scale bar, 2 mm), the black rectangles identify images in the bottom panels at higher magnification (scale bar, 500 μm). Black arrows demonstrate that whereas HA-positive cells can be readily found in the corpus callosum of TP53(−/−) tumors, few are seen in TP53/MYO10(−/−) tumors.
(G) Histologic sections from the same location stained for Ki67 (scale bar, 2 mm). Higher-magnification images are displayed in the lower panels (scale bar, 500 μm).
(H) Immunohistochemical stain for MYO10 in TP53(−/−) (left panel) and TP53/MYO10(−/−) (right panel) tumors. TP53(−/−) tumors stain robustly for MYO10, whereas only tumor blood vessels (black arrows) stain for MYO10 in TP53/MYO10(−/−) tumors.
(I) H&E sections of TP53(−/−) (left) and TP53/MYO10(−/−) (right) tumors (scale bar, 200 μm).
To determine the importance of MYO10 in driving GBM behavior, we utilized an immunocompetent GEMM that we have previously described (Picariello, et al., 2019). This is illustrated in Figure 1C and involves the injection of a bicistronic retrovirus encoding for a platelet-derived growth factor (PDGF)-hemagglutinnin (HA) fusion protein and the cre recombinase. Intracerebral injection of this virus in mice with floxed alleles for a tumor suppressor (either PTEN or TP53) and a gene of interest leads to development of proneural GBMs deleted for PTEN or TP53 and the gene under investigation. In this study, we injected virus into four groups of mice, with floxed alleles for PTEN ± MYO10 and for TP53 ± MYO10. Median survival for mice with TP53-deleted tumors (TP53(−/−); blue broken curve) is 32 days post injection (dpi), whereas that for PTEN(−/−) tumors (blue solid curve) is > 2-fold longer (79 dpi). However, in both cases, co-deleting MYO10 prolongs median survival—by 9 days in TP53/MYO10(−/−) tumors (red broken curve; p = 0.0002, log rank test) and by 20 days in PTEN/MYO10(−/−) tumors (red solid curve; p = 0.0037, log rank test) (Figure 1D). We probed primary GBM cell lines from PTEN(−/−) and PTEN/MYO10(−/−) tumors for MYO10 protein expression and compared with RPE1 cells as a positive control (Figure 1E). A band of the expected Mr for MYO10 (237 kDa) is seen in both RPE1 and PTEN(−/−) cells (blue arrow). However, the PTEN(−/−) cells also express a second band (red arrow) with molecular weight consistent with a “headless” MYO10 variant that utilizes an alternative transcription start site and is expressed in nervous system tissue (163 kDa) (Raines et al., 2012). Neither is detected in the PTEN/MYO10(−/−) cells.
To determine how MYO10 affects tumor morphology, we generated TP53(−/−) and TP53/MYO10(−/−) tumors and sacrificed animals at the time of tumor morbidity (28 days for TP53(−/−) tumors and 40 days for TP53/MY O 10(−/−) tumors). Brains were excised and histologic sections stained for the HA epitope, to mark PDGF-secreting tumor cells (Ki67, MYO10, and H&E) (Figures 1F–1I). MYO10 deletion results in tumors that are approximately 2-fold smaller in cross-sectional area (Figures S1A and S1B). The regions encompassed by the black rectangle in Figures 1F and 1G are shown at higher magnification in the lower panels and demonstrate less dispersion through the corpus callosum (Figure 1F, black arrows) and none through the cortex (Figure 1G, black arrows) with MYO10 deletion. TP53(−/−) tumors stain robustly for MYO10 (Figure 1H, left), whereas TP53/MYO(−/−) tumors only show MYO10 staining in blood vessels (Figure 1H, right, black arrows).
MYO10 Deletion Alters GBM Cell Morphology and Mechanics
In PTEN(−/−) cells, MYO10 is distributed in both the nucleus, as previously described (Woolner et al., 2008), and the cytoplasm and membrane ruffles (Figure S2A). MYO10 binds to both actin filaments, through its N-terminal motor domain, and microtubules, through its C-terminal MyTH4/FERM domain, and has been shown to cross-link mitotic spindle microtubules to the surrounding actin cytoskeleton (Kwon et al., 2015) in metaphase. However, loss of this cross-linking function might alter cellular morphology and mechanics in interphase as well. MYO10 deletion flattens GBM cells cultured on fibronectin-coated glass surfaces by 22% and increases spread surface area by nearly 3.5-fold (Figures 2E and 2F). It also redistributes actin into prominent central stress fibers (Figures 2A and 2B), as previously described (Makowska et al., 2015). These findings suggest that MYO10 deletion softens the cytoplasm, as might be expected if this motor were involved in cross-linking the cytoskeleton. To test this hypothesis, we performed atomic force microscopy of MYO-intact and -deleted cells over the cell body. As Figure 2G demonstrates, MYO10 loss is associated with a highly significant decrease in the Young's modulus.
Figure 2.

MYO10 Deletion Alters GBM Cell Morphology and Mechanics
(A and B) PTEN(−/−) (A) and PTEN/MYO10(−/−) (B) cells were grown on coverslips and stained for actin, MYO10, and DAPI. Scale bars, 100 μm.
(C and D) PTEN(−/−) (C) and PTEN/MYO10(−/−) (D) cells were stained for γ-tubulin, pericentrin, and DAPI. Scale bars, 20 μm.
(E) Surface area for GFP-expressing PTEN(−/−) (blue) and PTEN/MYO10(−/−) (red) cells plated on glass bottom dishes coated with fibronectin.
(F) Cell height for GFP-expressing PTEN(−/−) (blue) and PTEN/MYO10(−/−) (red) cells.
(G) Young's modulus for PTEN(−/−) (blue) and PTEN/MYO10(−/−) (red) cells measured over the cell body. Error bars depict mean ± 1 SD.
As MYO10 is involved in spindle dynamics (Kwon et al., 2015; Woolner et al., 2008; Sandquist et al., 2018), we stained MYO10-intact and -deleted cells for pericentrin and γ-tubulin to visualize the centrosomes. In PTEN(−/−) cells (Figure 2C), pericentrin and γ-tubulin staining define a punctate, perinuclear structure, consistent with the appearance of centrosomes in interphase. By contrast (Figure 2D), centrosomes appear fragmented in most MYO10-deleted cells. This is also illustrated in Figure S2B at lower magnification, where PTEN(−/−) (left) and PTEN/MYO10(−/−) (right) cells have been stained for pericentrin (red) and α-tubulin (green). Although nearly all PTEN(−/−) cells display a discrete red focus, pericentrin staining is more diffuse in approximately 40% PTEN/MYO10(−/−), suggesting that MYO10 deletion induces centrosome disruption or duplication.
MYO10 Deletion Impairs GBM Invasion due to Defects in Cell Directionality
We examined PTEN(−/−) and PTEN/MYO10(−/−) cells for their motility on a 2D barrier-free laminin-coated surface, using a wound assay. Figure 3A reveals that wound closure speed for MYO10-deleted GBM cells (29.4 ± 1.4 μm/h) is nearly identical to that for MYO10-intact cells (31.0 ± 1.3 μm/h). Figure 3B depicts the number of nuclei per 20× field that have extruded through a 3-μm Transwell for PTEN(−/−) (blue) versus PTEN/MYO10(−/−) (red) cells, whereas Figure 3C depicts the corresponding data for TP53(−/−) (blue) and TP53/MYO10-(−/−) (red) cells. Although TP53-deleted cells are more invasive than their PTEN-deleted counterparts, in both cases, MYO10 deletion reduces invasion 2.4- to 3.7-fold. We also suppressed MYO10 in four primary human GBM cell lines (GBM1A, L1, GBM162, QNS120) with small hairpin RNA (shRNA) (Figure S3A). Two of these lines (GBM1A and L1) have tumor-initiating cell features (Galli et al., 2004; Deleyrolle et al., 2011). In each case, we also find that suppression of MYO10 significantly impairs Transwell migration (Figure S3B, p < 0.0001 by one-way ANOVA). These in vitro assays suggest that whereas targeting MYO10 has little effect on cell motility on a barrier-free surface, it appreciably impairs motility when cells need to negotiate through more confined spaces. This is consistent with our histologic examination of MYO10-intact and -deleted GBMs (Figures 1F and 1G), as brain intercellular space is submicrometer in size (Thorne and Nicholson, 2006).
Figure 3.

MYO10 Deletion Reduces GBM Invasion through Confined Spaces by Affecting Directional Persistence
(A) Cell velocities in an in vitro wound assay for PTEN(−/−) (blue) and PTEN/MYO10(−/−) (red) cells.
(B) Migration over 12 h through a 3-μm Transwell chamber was measured for PTEN(−/−) (blue) and PTEN/MYO10(−/−) (red) cells.
(C) Corresponding Transwell assay for TP53(−/−) (blue) and TP53/MYO10(−/−) (red) cells.
(D and E) Cell migration speed (D) and persistence (E) of PTEN(−/−) (blue) and PTEN/MYO10(−/−) (red) cells in 10-μm-high × 10-, 6-, or 3-μm-wide fibronectin-coated microchannels.
(F) Image of a trifurcating microchannel.
(G) Percentage of PTEN(−/−) (blue) and PTEN/MYO10(−/−) (red) cells able to migrate through the 200-μm-long feeder channel to the trifurcation over a period of 24 h.
(H) Percentage of PTEN(−/−) (blue) and PTEN/MYO10(−/−) (red) cells that made a decision to migrate through one of the three branched channels after reaching the trifurcation over a period of 24 h. Cells that did not make a decision either reversed direction or remained stuck in the trifurcation until the end of the imaging period.
(I) Time required for PTEN(−/−) (blue) and PTEN/MYO10(−/−) (red) cells to make a decision to migrate through one of the three branched channels after the cell body reached the trifurcation.
(J) Fraction of PTEN(−/−) (blue) and PTEN/MYO10(−/−) (red) cells migrating through the left, center, or right branch after reaching the trifurcation (n = 3 independent experiments). Data represent mean ± SD (D, E, and I) or mean ± SEM (G, H, and J).
However, in addition to being spatially constricted, the pathways through which GBM cells maneuver are also highly non-linear, requiring tumor cells to shift direction when their pathway turns, and to make directional decisions when it branches—a feature we refer to as directional flexibility. Centrosomes determine migration directionality for many cells, including astrocytes (Luxton and Gundersen, 2011), and given the effect MYO10 deletion has on centrosome distribution, we wondered if its deletion affected directional flexibility. We therefore utilized microfabricated in vitro invasion assays, which have been described previously (Zhao et al., 2019; Mistriotis et al., 2019). We first examined PTEN(−/−) and PTEN/MYO10(−/−) cell motility through fibronectin-coated straight channels with a constant height (H = 10 μm) and varying width (W = 10, 6, or 3 μm). Although both types of cells migrated with similar speeds through these channels (Figure 3D), PTEN/MYO10(−/−) cells migrated with significantly higher directional persistence (Figure 3E and Video S1). To examine this further, we studied the migration behavior of these cells when they encountered a trifurcating microchannel (Figure 3F). In this configuration, cells first migrate through a 200-μm-long feeder channel before reaching a trifurcation, where they face a decision about which direction to turn. The dimensions of the three branched channels are distinct, although the hydraulic resistance of each branch is constant. We found that a higher percentage of PTEN/MYO10(−/−) cells were able to reach the trifurcation (Figure 3G and Video S2) due to their increased directional persistence. Although PTEN(−/−) and PTEN/MYO10(−/−) cells displayed a similar ability to make the decision to migrate through one of the three branched channels (Figure 3H), PTEN/MYO10(−/−) cells took significantly longer to decide which direction to turn (Figure 3I). Furthermore, the highest fraction of PTEN(−/−) cells migrated through the right-most channel, which has the largest cross-sectional area of the three branches (Figure 3J). By contrast, the highest fraction of PTEN/MYO10(−/−) migrated through the center branch, suggesting that these cells prefer to maintain direction rather than travel along a wider track.
Both MYO10-intact and -deleted cells readily migrate through these channels with similar velocity. However, whereas the PTEN(−/−) cells frequently change direction in these channels, the PTEN/MYO10(−/−) cells rarely do.
The PTEN(−/−) cell moves into the wider 200-μm2 channel on the right, whereas the PTEN/MYO10(−/−) cell continues along a straight path.
MYO10 Deletion Slows Tumor Proliferation
We measured tumor cell doubling time in an environmentally controlled live-cell imaging microscope (Figure 4A). Doubling time for PTEN(−/−) cells (15.9 ± 5.2 h) is ~66% shorter than that for PTEN/MYO10(−/−) cells (24.4 ± 7.6 h) on a glass surface (p < 0.0001, two-tailed t test). However, tumor tissue is considerably softer than tissue culture plastic or glass, and as we demonstrated in our recent study, GBM growth rate varies with substrate stiffness (Picariello et al., 2019). We therefore cultured PTEN(−/−) (solid blue) and PTEN/MYO10(−/−) (solid red) cells on fibronectin-coated hydrogels with defined stiffnesses ranging from 0.2 to 50 kPa (Matrigen, Brea, CA). As Figure 4B shows, PTEN(−/−) cells show an optimum for growth on surfaces with Young's modulus from ~1 to 10 kPa. Although MYO10 deletion slows the proliferation rate 25%–30% across the entire range of stiffness, the stiffness optimum does not change. We also measured proliferation kinetics of GBM cells deleted for TP53 or co-deleted for TP53 and MYO10 on tissue culture plastic (Figure 4C) and find the same pattern as in Figure 4A—longer doubling time with MYO10 deletion. shRNA suppression of MYO10 in the four human GBM lines grown on tissue culture plastic also slows proliferation, and to a degree similar to what we observe with our murine GBMs (Figure S3C).
Figure 4.

MYO10 Deletion Slows Tumor Cell Proliferation and Reduces Integrin-Related Signaling
(A) Doubling time for PTEN(−/−) (solid blue) and PTEN/MYO10(−/−) (solid red) cells monitored in an environmentally controlled microscope for 4 days.
(B) Growth rates were measured for PTEN(−/−) (solid blue) and PTEN/MYO10(−/−) (solid red) cells grown on fibronectin-derivatized hydrogels of defined stiffness (Softwells, Matrigen). Cell count was measured every 12 h for 4 days, and data were fit to an exponential growth equation to yield proliferation rates (h−1).
(C) Growth rates of TP53(−/−) (open blue) and TP53/MYO10(−/−) (open red) cells on tissue culture plastic.
(D) 50,000 luciferase-expressing PTEN(−/−) and PTEN/MYO10(−/−) cells were injected into the white matter of NSG recipient mice, and tumor growth was measured using bioluminescence. Luminescence over time was fit to single exponential growth equations (solid colored lines with 95% CI indicated by black dashed lines).
(E) PTEN(−/−) (solid blue) and PTEN/MYO10(−/−) (solid red) cells were stained with DAPI and examined by flow cytometry. MYO10 deletion leads to a greater than 2-fold increase in the fraction of cells in G2M (p = 0.002, two-tailed t test).
(F) Duration in M phase was measured by time lapse microscopy of PTEN(−/−) (solid blue) and PTEN/MYO10(−/−) (solid red) cells in an environmentally controlled microscope for 4 days.
(G–I) Phosphorylation of SRC (G), FAK (H), and ERK1/2 (I) was measured by western blot (left panels), and the ratio of phosphorylated/total species (right panel) is reduced in PTEN/MYO10(−/−) tumor cells (solid red) compared with PTEN(−/−) tumor cells (solid blue) in each case. Error bars represent mean ± 1 SD.
As the microenvironments that constitute a GBM tumor have features not replicated by in vitro experimental platforms, we injected 50,000 luciferase-expressing PTEN(−/−) and PTEN/MYO10(−/−) into the white matter of NSG mice, and monitored tumor growth with bioluminescence. Results are depicted in Figure 4D for PTEN(−/−) cells (solid blue) and PTEN/MYO10(−/−) cells (solid red). The slopes of the fits define in vivo doubling times of 6.6 ± 1.2 days for PTEN(−/−) cells and 15.3 ± 4.4 days for PTEN/MYO10(−/−) cells. These are considerably longer than the corresponding in vitro values (Figures 4A and 4B) and presumably reflect differences in environmental factors that modulate growth. However, the overall pattern remains the same—MYO10 deletion slows tumor proliferation.
As one of the functions of MYO10 is in positioning the mitotic spindle, we might expect that its deletion could alter progression through M phase. Flow cytometry of DAPI-stained PTEN(−/−) and PTEN/MYO10(−/−) tumor cells (Figure 4E, blue versus red) confirms that MYO10 deletion enhances accumulation in G2M. This implies that mitotic duration is prolonged with MYO10 deletion, and we tested this in a live-cell imaging microscope by measuring the time between initial cell rounding and cytokinesis. This increases from 41.4 ± 8.3 to 55.9 ± 26.3 min with MYO10 deletion (Figure 4F, p = 0.0061, two-tailed t test). Although consistent with its role in spindle function, this 35% increase in M phase duration does not explain the 8.5-h difference in cell doubling time, and suggests that other factors contribute as well to the slower growth of MYO10-deleted tumors. MYO10 regulates signaling through its interaction with β-integrins (Arjonen et al., 2014; Zhang et al., 2004; Miihkinen et al., 2020). Integrins activate SRC, focal adhesion kinase (FAK), and the Ras-Raf-MEK-ERK pathway, and each in turn can stimulate invasion and proliferation. In each case, MYO10 deletion reduces activated levels of these signaling effectors by ≥ 2-fold (Figures 4G–4I).
MYO10 Deletion Enhances the DNA Damage Response and Sensitizes GBMs to a PARP Inhibitor
Delays in mitotic progression lead to DNA damage (Bakhoum et al., 2017), so we probed MYO10-deleted and intact murine GBM cells for PARP, cleaved PARP (Figure S4A), and γH2Ax (Figure S4B). Figures 5A–5C show that MYO10 deletion increases the expression of each 3- to 5-fold. We also observe an increase in γH2Ax in each of the four human GBM cell lines suppressed for MYO10 with shRNA (Figure S4C). This implies that MYO10 deletion increases tumor cell dependence on DNA repair mechanisms, which would predict enhanced sensitivity to inhibitors of the DNA damage response. We measured the dose response for MYO10-intact and -deleted murine tumor cells to the central nervous system-permeant PARP inhibitor niraparib. Dose-response curves (Figures 5D and 5E) show that loss of MYO10 significantly enhances sensitivity to this drug. Likewise, the four human GBM cell lines suppressed for MYO10 also show a >25-fold increased sensitivity to niraparib in vitro (Figure S4D).
Figure 5.

MYO10 Deletion Increases DNA Damage and Sensitizes Tumor Cells to a PARP Inhibitor
(A) Normalized PARP levels for PTEN(−/−) and PTEN/MYO10(−/−) cells (left panel) and TP53(−/−) and TP53/MYO10(−/−) cells (right panel).
(B) Corresponding plots of cleaved PARP.
(C) MYO10 deletion increases γH2Ax in both PTEN and TP53-deleted backgrounds. Error bars in (A–C) represent mean ± 1 SD.
(D) Dose response of PTEN(−/−) (solid blue) and PTEN/MYO10(−/−) (solid red) cells to the central nervous system-permeant PARP inhibitor niraparib after 72 h of exposure to vehicle or drug. Data for PTEN/MYO10(−/−) cells fit a Hill equation, yielding values of EC50 and Hill coefficient of 4,417 ± 468 nM and 0.43 ± 0.04, respectively.
(E) Corresponding dose-response curves of TP53(−/−) and TP53/MYO10(−/−) cells to niraparib. Data for TP53/MYO10(−/−) cells fit a Hill equation with EC50 and Hill coefficient of 3,065 ± 144 nM and 0.79 ± 0.05, respectively.
(F) 50,000 luciferase-expressing PTEN(−/−) and PTEN/MYO10(−/−) cells were orthotopically injected into NSG mice, and tumor growth was monitored with bioluminescence. Once photon counts were between 2.5 and 5.0 × 10⁷/s, animals were treated with vehicle (solid circles) or niraparib (open boxes) at a dose of 25 mg/kg at a frequency of 5 days/week by intraperitoneal injection.
(G) Mice with floxed alleles for TP53 (blue) or TP53 and MYO10 (red) were injected with PDGF-IRES-cre retrovirus. At 5 days post retroviral injection, animals were treated with 5 days/week dosing of vehicle (dashed curve) or niraparib (solid curve) at a dose of 25 mg/kg 5 days per week and treatment continued until tumor morbidity. p values derived from log rank tests.
To test the translational value of these findings, we injected luciferase-expressing PTEN(−/−) and PTEN/MYO10(−/−) cells orthotopically into NSG mice and monitored tumor growth with bioluminescence over time with administration of vehicle or niraparib. We initiated treatment with drug or vehicle when photon counts were between 2.5 and 5.0 × 10⁷/s. Results are illustrated in Figure 5F. MYO10-deleted tumors in vehicle-treated mice (red solid circles) grow 2–4 times more slowly than do tumors intact for MYO10 (blue solid circles), consistent with Figure 4D. Niraparib does not alter growth kinetics of MYO10-intact GBMs (blue open boxes), whereas it appreciably slows growth when MYO10 is deleted (red open boxes). We next injected our bicistronic PDGF-IRES-cre retrovirus into mice with floxed alleles for either TP53 or TP53 and MYO10 to generate tumors deleted for these genes. We treated mice with either vehicle (n = 8) or niraparib (n = 8) until they developed signs of tumor morbidity. Although niraparib prolongs median survival in mice with TP53(−/−) tumors, the effect is very modest (Figure 5G; blue, solid versus dashed; 2.5 days = 8%, p = 0.016, log rank test). By contrast, niraparib significantly prolongs median survival in mice whose tumors are co-deleted for MYO10 (Figure 5G; red solid versus dashed; 18 days = 45% increase in median survival, p < 0.0001, log rank test).
What is not clear from the above is whether MYO10 deletion by itself is sufficient to induce DNA damage, or whether this only occurs in the context of malignancy. This issue is translationally relevant, because if MYO10 deletion alone is sufficient, combining a MYO10 inhibitor with a PARP inhibitor or with radiation might be unacceptably toxic to normal tissues. To examine this, we measured PARP (Figure S4E) and γH2Ax (Figure S4F) in lung, spleen, testis, liver, and cerebellum in wild-type (WT), MYO10 heterozygous knockout (HT) mice, and MYO10 homozygous knockout mice (KO). We see no difference between HT and KO mice in PARP for cerebellum, liver, lung, and spleen, with increased PARP expression (but no cleaved PARP) in testes from KO mice. We could not detect γH2Ax expression in any of these tissues from WT, HT, or KO mice, with readily detectable γH2Ax in our positive control (PTEN/MYO10(−/−) tumor cells).
MYO10 Deletion Upregulates the Metabolic Stress Response in a Context-Dependent Manner
To obtain an unsupervised overview of how GBM cells respond to MYO10 deletion, we analyzed lysates of PTEN(−/−) and PTEN/MYO10(−/−) cells with a phospho-antibody array (Cancer Signaling Phospho-Array, Full Moon Biosystems, Mendeley Data "Myosin 10 Phospho Antibody Array,” Mendeley Data, V1, https://doi.org/10.17632/5cnvmf9m2d.1). Of 135 phosphorylated signaling molecules, we observed only five whose phosphorylation increased ≥70% with MYO10 deletion, and each is connected to metabolic and/or endoplasmic reticulum (ER) stress responses. These include STAT4 (2.1-fold, pY693), AMP-activated protein kinase (AMPK, 1.9-fold, pT183), HSP90B (1.8 fold, pS254); JunB (1.8-fold, pS259), JunD (1.7 fold, pS255), and caveolin-1 (1.7-fold, pY14). The activity of AMPK, a master metabolic regulator is increased >100-fold through phosphorylation of T183 by LKB1 and CAMKII (Hardie 2015). AMPK stimulates pinocytosis and increases the glucose and amino acid uptake (Towler and Hardie, 2007; Bae et al., 2011). We validated our results by performing western blots of total and phospho-AMPK on tumor cell lysates. Representative western blots (Figures S5A and S5B) and quantitation of phospho-AMPK/total AMPK (Figure 6A) reveal that in a PTEN-deleted background, MYO10 co-deletion enhances AMPK phosphorylation ~3-fold, associated with an increase in LKB1 expression but without change in total AMPK (Figures S5C and S5D; Figures 6B and 6C). Loss of MYO10 also enhances activating phosphorylation of AKT by ~3-fold (Figures S5E and 6D). The increased activation of AMPK in PTEN/MYO10-co-deleted cells suggests that these cells are more dependent on AMPK and may be more sensitive to the AMPK inhibitor dorsomorphin. PTEN(−/−) cells are completely resistant, whereas PTEN/MYO10(−/−) cells are sensitive (Figure 6E), with an EC50 of 2010 ± 314 nM. To ensure that the effects seen with MYO10 deletion are truly due to the loss of this motor, we suppressed MYO10 expression in PTEN(−/−) cells using stable transfection with two MYO10-directed shRNA-encoding vectors or with a non-targeting (NT) control vector. As with genetic deletion, suppression of MYO10 in murine GBM cells increases AMPK phosphorylation and expression of γH2Ax 3- to 4-fold relative to the non-targeting (NT) control (Figure S6).
Figure 6.

MYO10 Deletion Activates AMPK and AKT and Sensitizes Tumor Cells to AMPK and PI3K Inhibitors
(A) MYO10-deletion increases AMPK-activating phosphorylation (pT 172/183) ~3-fold in a PTEN-deleted background (p < 0.0001, two-tailed t test), but not in a TP53-deleted background (p < 0.0001, two-tailed t test). Baseline AMPK levels are higher in PTEN(−/−) cells than in TP53(−/−) cells (open red versus open blue; p < 0.0001, two-tailed t test).
(B) Levels of LKB1 are increased ~3-fold in PTEN-deleted cells with MYO10 co-deletion.
(C) Levels of AMPK are not appreciably altered by MYO10 co-deletion in a PTEN-deleted background (p = 0.89, two-tailed t test).
(D) Deletion of MYO10 in cells with a PTEN-deleted background increases AKT phosphorylation ~3-fold (p < 0.0001, two-tailed t test), whereas MYO10 deletion in a TP53-deleted background does not (p = 0.99).
(E) GBM cells were treated for 72 h with the AMPK inhibitor dorsomorphin. Only PTEN/MYO10(−/−) cells are sensitive to the drug, with EC50 and Hill coefficient of 2,010 ± 314 nM and 0.5 ± 0.1, respectively.
(F) PTEN(−/−) cells (open red) and PTEN/MYO10(−/−) cells (closed red) were treated with 100 nM of the PI3K inhibitor idelalisib for 24 h. Idelalisib has no effect on AMPK phosphorylation in MYO10-intact cells, but reduces it in MYO10-deleted cells.
(G) Dose response to idelalisib for PTEN(−/−) (open red), PTEN/MYO10(−/−) (closed red), TP53(−/−) (open blue), and TP53/MYO10(−/−) (closed blue) cells. Only the PTEN/MYO10(−/−) cells show any sensitivity, with an EC50 and Hill coefficient of 1,405 ± 182 nM and 0.50 ± 0.05, respectively.
(H) Left panels: PTEN(−/−) (top) and PTEN/MYO10(−/−) (bottom) cells were plated on fibronectin-coated chamber slides and rhodamine-labeled dextran was added. Cells were incubated for 6, 12, and 24 h; fixed; and counterstained with DAPI. Fluorescent imaging after 12 h demonstrates readily detectable red fluorescence in the MYO10-deleted cells with little in MYO10-intact cells. Right panel: intensity of red fluorescence in the field divided by the number of DAPI nuclei is plotted for 6, 12, and 24 h for PTEN(−/−) (blue) and PTEN/MYO10(−/−) (red) cells.
(I) Left panel: Fluorescence imaging of PTEN/MYO10(−/−) cells treated for 12 h with rhodamine dextran in the presence of vehicle (upper panel) or 200 nM dorsomorphin (lower panel). Right panel: intensity of red fluorescence in the field divided by the number of DAPI nuclei is plotted for 12 h of exposure to rhodamine dextran for PTEN(−/−) (blue) and PTEN/MYO10(−/−) (red) cells in the presence of vehicle (open circles) or dorsomorphin (closed circles). Error bars depict mean ± 1 SD. p values determined from two-tailed t test.
However, MYO10 does not regulate AMPK and AKT in a TP53-deleted background (Figures 6A and 6D). Both LKB1 and CAMKII are in turn activated by a rise in cytosolic calcium—LKB1 by binding to MO25, a calcium-binding allosteric modifier, and CAMKII by calcium binding to calmodulin. The rise in calcium requires the generation of phosphatidylinositol 3,4,5-trisphosphate (PIP3) produced by the action of PI3 Kinase (PI3K). AKT is also activated by binding PIP3 through its PH domain (Frech et al., 1997). Hence, the signaling activity of PIP3 could be controlled by two processes—PIP3 dephosphorylation by PTEN and PIP3 sequestration by PH-domain-containing proteins, including MYO10. This suggests that the increase in AMPK and AKT activity we observe requires the combined effects of deleting both PTEN, to enhance PIP3 levels, and MYO10, to reduce PIP3 sequestration. If correct, we would predict that expression of a biologically active PH domain in PTEN/MYO10(−/−) cells would reduce AMPK phosphorylation. As PI3K generates PIP3, we also predict that inhibiting this kinase should also reduce AMPK phosphorylation in PTEN/MYO10(−/−) cells. Furthermore, if co-deletion of PTEN and MYO10 increases bioavailable PIP3, PTEN/MYO10(−/−) tumor cells should have increased dependence on PIP3, and be selectively killed with a PI3K inhibitor. Treatment of PTEN(−/−) cells with the PI3K inhibitor idelalisib (100 nM) has no effect on AMPK phosphorylation, suggesting that baseline AMPK phosphorylation is relatively independent of PIP3 availability. However, it does reduce AMPK phosphorylation in PTEN/MYO10(−/−) cells (Figures S4G and 6F). Furthermore, whereas this drug is selectively toxic to PTEN/MYO10(−/−) cells, it has no appreciable effect on PTEN(−/−), TP53(−/−), or TP53/MYO10(−/−) cells (Figure 6G). Finally, we transfected PTEN(−/−) and PTEN/MYO10(−/−) cells with expression plasmids encoding either a PH domain from Bruton tyrosine kinase fused to GFP or GFP as a control. Western blots show that the PH-GFP fusion, but not GFP, restores phospho-AMPK levels (Figures S7A–S7D) but does not alter the increase in γH2Ax levels, which we observed from MYO10 deletion (Figures S7B and S7D), implying that other domains of the MYO10 molecule are needed instead or as well to prevent DNA damage. By contrast, transfection of a full-length MYO10-GFP fusion protein reverses both the increase in phosphorylated AMPK and γH2Ax (Figures S7E–S7H).
We tested for the effect of MYO10 deletion on AMPK-activated pinocytosis (Towler and Hardie, 2007; Meley et al., 2006) by incubating PTEN(−/−) and PTEN/MYO10(−/−) cells with rhodamine-labeled dextran (Mr 10,000) for 6, 12, and 24 h and measuring rhodamine fluorescence intensity normalized to the total number of DAPI-stained nuclei (Figure 6H). Examples of images taken at 12 h are illustrated in the left two panels, and normalized intensity at 6, 12, and 24 h for 15 fields is depicted in the right panel. Fluorescence intensity in PTEN/MYO10(−/−) cells remained significantly greater than in PTEN(−/−) cells at each time point (two tailed t test), implying that MYO10 deletion enhances rhodamine dextran pinocytosis. We incubated PTEN(−/−) and PTEN/MYO10(−/−) for 12 h with rhodamine dextran in the presence or absence of 200 nM dorsomorphin. Dorsomorphin has little effect in PTEN(−/−) cells, whereas it abolishes the increase in rhodamine dextran uptake induced with MYO10 deletion (Figure 6I).
Discussion
MYO10 Supports the Malignant Phenotype of GBM in Multiple Ways
Given the importance of cell motility in metastasis, it is not surprising that studies of MYO10 in cancer have largely focused on its role in driving tumor invasion. MYO10 has been shown to be important in metastasis in models of malignant melanoma and lung carcinoma (Tokuo et al., 2018; Summerbell et al., 2020). These findings are consistent with the roles MYO10 plays in driving filopodia formation and in activating integrins (Arjonen, et al., 2011; Arjonen, et al., 2014; Zhang et al., 2004; Miihkinen et al., 2020). In lung carcinoma, MYO10 drives collective cell migration, where its expression in leader cells is needed for filopodial persistence and patterning of the extracellular matrix (Summerbell et al., 2020). Collective cell migration in the perivascular space has also been described in some pre-clinical models of GBM, whereas in others, including in our PDGF-driven murine GBM models (Figure 1C), single-cell motility predominates, particularly in white matter (Assanah et al., 2006). Thus, the roles MYO10 plays in tumor biology may vary with both the tumor and the microenvironment. In support of this, while small interfering RNA suppression of MYO10 in lung carcinoma leader cells reduces migration on a 2D surface (Summerbell et al., 2020), its deletion in our murine models of GBM has more subtle effects that are not seen in spatially unconstrained environments (Figure 3A). Rather, MYO10 deletion impairs GBM directional flexibility (Figures 3D–3J). This may explain why we observe significant defects in Transwell migration (Figures 3B and 3C), as tumor cells would need to change direction by 90° to enter the 3-μm pores of the Transwell membrane and crawl through. Loss of directional flexibility would be particularly problematic for tumor cells crawling through the highly branched pathways that they would encounter in brain white matter, cortex, and perivascular space (Assanah et al., 2006). In cell motility, directionality is shaped by actin polymerization in the periphery and centrosome-driven microtubule nucleation, and MYO10 deletion alters the distribution of both (Figures 2A and 2B). This might be mechanistically connected to a loss of MYO10-dependent microtubule-actin cross-linking, which could also explain the cytoplasmic softening that we observe with this motor's deletion (Figure 2G).
MYO10 binds to actin through its motor domain and to microtubules through its C-terminal MyTH4/FERM domain, and as such is able to position the mitotic spindle, containing the centrosomes, by cross-linking spindle microtubules to the actin cortex (Kwon et al., 2015; Woolner et al., 2008). Loss of these functions with MYO10 deletion can explain the lengthening of doubling time and the increase in G2M fraction (Figure 4E)—features that suggest a dysregulation in the mitotic process. Furthermore, MYO10 deletion inhibits activation of proliferation-stimulating signaling effectors downstream of integrins, including SRC, FAK, and ERK1/2 (Figures 4G–4I). We propose that these combined effects on mitosis and signaling explain the reduced proliferation for MYO10-deleted GBM cells, and together with the impairment in tumor cell motility and invasion, also explain the improvement in survival in tumor-bearing mice (Figure 1D).
Targeting MYO10 Synergizes with Other GBM Therapeutics
Given the roles MYO10 plays in signaling and mitosis and given the importance of these processes to cancer development, it is not surprising that targeting MYO10 alters both, and in ways that are translationally relevant. MYO10 deletion or suppression enhances the DNA damage response in murine and human GBM cells, but not in non-transformed tissues. This suggests that targeting MYO10 can induce DNA damage, but only when it occurs in the background of the genetic instability and/or increased mitotic drive that characterizes tumor cells. Regardless of the underlying mechanisms, this upregulation and activation of the DNA damage response led us to predict that MYO10 deletion would enhance sensitivity to PARP inhibitors, and we have confirmed this. These findings are reminiscent of what is seen in GBM tumor-initiating cells, whose radio- and chemo-resistance have also been attributed to an enhanced DNA damage response (Lathia et al., 2015; Bao et al., 2006). Like MYO10-deleted cells, tumor-initiating cells also have an increased dependence on PARP and respond to treatment with PARP inhibitors (Venere et al., 2014). Our results suggest that systemic targeting of MYO10 through a small molecule inhibitor may also synergize with other DNA damaging agents, such as radiotherapy or alkylating chemotherapy. Furthermore, we anticipate that this may occur without untoward toxicity to normal cells, as we do not see an increase in DNA damage in non-transformed tissues that are deleted for MYO10.
Deleting or shRNA suppressing MYO10 induces DNA damage across a broad spectrum of GBMs, including both murine tumors deleted for either TP53 or PTEN and four primary human GBM lines, two of which have tumor-initiating cell characteristics (Figures 5 and S4). We can only reverse this effect by replacing with full length MYO10, as opposed to just a PH domain. This implies that should a small molecule inhibitor of the MYO10 motor domain be developed, it should be effective in inducing DNA damage across a variety of GBMs. However, another signaling consequence of MYO10 deletion—activation of AMPK and AKT—appears to specifically require co-deletion of the tumor suppressor PTEN (Figures 6 and S5–S7). Unlike the effect of MYO10 deletion on DNA damage, upregulation of AMPK and AKT activation can be reversed by over-expression of an exogenous PH domain, consistent with our hypothesis that one of the signaling functions of MYO10 is in regulating bioavailable PIP3. This finding is relevant to the human disease, as PTEN mutations are seen in approximately 35% of GBMs (Yang et al., 2017). Our explanation that MYO10 regulates locally generated PIP3 by sequestering it through its PH domains is consistent with studies in mouse hippocampal neurons, which have shown that like MYO10, PIP3 accumulates in filopodia (Luikart et al., 2008).
MYO10 Has Potential as an Unexplored, Therapeutic Target in GBM
Members of both the kinesin and myosin families play multiple roles that in aggregate support the malignant behavior of GBM. For example, while the kinesin family member Kif11 is needed for bipolar spindle formation during mitosis, including in GBM cells, we found that it is also plays an important role in GBM invasion, and its inhibition by highly specific small molecule inhibitors significantly prolongs survival in GBM PDX models in vivo (Venere et al., 2015). Likewise, we have shown that targeting myosin II either genetically or pharmacologically blocks both invasion and proliferation in GBM and produces a significant survival advantage in murine models of this disease (Picariello et al., 2019). We have also argued that molecular motors represent points where multiple, redundant proliferation- and invasion-stimulating signaling pathways converge, and as such, their inhibition should produce a robust, sustained anti-tumor effect. Although we have shown this to be the case for both Kif11 and myosin II, pharmacologic inhibition of Kif11 can be myelosuppressive, and genetic knockout of myosin IIA or IIB is lethal in mice (Ma and Adelstein, 2014). By contrast, not only is MYO10 important in both tumor invasion and proliferation but also MYO10 knockout mice can grow to adulthood and breed normally, implying that normal cells can accommodate to loss of this motor. Taken together, our findings highlight important roles that MYO10 plays in driving the malignant phenotype of GBM and they argue that further studies are warranted to validate the potential of a therapeutic strategy that targets this pleiotropic molecular motor.
Limitations of the Study
Much of the work described in this report has relied on well-characterized GEMMs of GBM, and we have used them to demonstrate that genetic deletion of MYO10 has pleiotropic effects in this tumor that have translational potential. Although these GEMMs faithfully recapitulate many of the molecular and histologic features of human GBM, they likely do not reproduce the inter- and intra-tumoral heterogeneities that are typical of the human disease. In this regard, we do note that several of the central conclusions of our report—that MYO10 targeting impairs tumor invasion, slows proliferation, and sensitizes tumor cells to inhibitors of DNA damage repair—are also consistent with our studies of four primary human GBM cell lines. However, validating the importance of MYO10 as a GBM target, identifying the tumor cell subtypes for which its targeting is likely to be effective, and determining how to optimize such a therapeutic approach, will require extensive evaluation of patient-derived xenograft models and will be investigated in future studies in our laboratories.
Resource Availability
Lead Contact
Steven S. Rosenfeld, Mayo Clinic, 4500 San Pablo Road, Jacksonville, FL 32224; rosenfeld.steven@mayo.edu
Materials Availability
All genetically engineered mouse models generated in this study will be made available on request, but we may require a payment and/or a completed Materials Transfer Agreement if there is potential for commercial application. All unique/stable reagents generated in this study are available from the Lead Contact with a completed Materials Transfer Agreement.
Data and Code Availability
Data from the phospho-antibody array is available through Mendeley Data at the following link: Rosenfeld, Steven (2020), “Myosin 10 Phospho Antibody Array,” Mendeley Data, V1, https://doi.org/10.17632/5cnvmf9m2d.1.
Methods
All methods can be found in the accompanying Transparent Methods supplemental file.
Acknowledgments
This work was supported by NIH grants R01NS073610 and U54CA210910 to S.S.R.; R01NS103473 and R01NS052738 to P.C.; R01CA184803 and U54CA210173 to K.K.; R01CA200399, R01CA195503, and R01CA216855 to A.Q.H.; R01GM134531 to R.C.; R01CA78383 and R01CA150190 to D.M.; T32CA009156 to the Lineberger Cancer Center for E.G.H.; and NSF grant DGE-1746891 to E.W. We wish to thank Dr. Justin D. Lathia (Cleveland Clinic) for the gift of the L1 cell line and Ms. Trine Giaever for illustrations.
Author Contributions
Conception and Design: R.S.K, S.S.R., P.C., K.K., R.C., and A.D.
Development of Methodology: R.S.K., S.S.R., K.K., P.M., E.W., E.H., and S.B.
Acquisition of Data: R.S.K., P.M., E.W., E.H., J.F.C., H.S.P., A.L., R.W., N.Z., M.L.-V., T.K., and S.B.
Analysis and Interpretation of Data: R.S.K., A.D., P.M., E.W., R.C., K.K., P.C., and S.S.R.
Administrative, Technical, or Material Support: A.Q.-H., J.A.H., and R.E.C.
Declaration of Interests
The authors declare that they have no competing interests.
Published: December 18, 2020
Footnotes
Supplemental Information can be found online at https://doi.org/10.1016/j.isci.2020.101802.
Supplemental Information
References
- Arjonen A., Kaukonen R., Ivaska J. Filopodia and adhesion in cancer cell motility. Cell Adh. Migr. 2011;5:421–430. doi: 10.4161/cam.5.5.17723. [DOI] [PMC free article] [PubMed] [Google Scholar]
- Arjonen A., Kaukonen R., Mattila E., Rouhi P., Högnäs G., Sihto H., Miller B.W., Morton J.P., Bucher E., Taimen P. Mutant p53-associated myosin-X upregulation promotes breast cancer invasion and metastasis. J. Clin. Invest. 2014;124:1069–1082. doi: 10.1172/JCI67280. [DOI] [PMC free article] [PubMed] [Google Scholar]
- Assanah M., Lochhead R., Ogden A., Bruce J., Goldman J., Canoll P. Glial progenitors in adult white matter are driven to form malignant gliomas by platelet-derived growth factor-expressing retroviruses. J. Neurosci. 2006;26:6781–6790. doi: 10.1523/JNEUROSCI.0514-06.2006. [DOI] [PMC free article] [PubMed] [Google Scholar]
- Bae H.B., Zmijiewski J.W., Deshane J.S., Tadie J.M., Chaplin D.D., Takashima S., Abrahamn E. AMP activated protein kinase enhances the phagocytic ability of macrophages and neutrophils. FASEB J. 2011;25:4358–4368. doi: 10.1096/fj.11-190587. [DOI] [PMC free article] [PubMed] [Google Scholar]
- Bakhoum S.F., Kabeche L., Compton D.A., Powell S.N., Bastians H. Mitotic DNA damage response: at the crossroads of structural and numerical cancer chromosome instabilities. Trends Cancer. 2017;3:225–234. doi: 10.1016/j.trecan.2017.02.001. [DOI] [PMC free article] [PubMed] [Google Scholar]
- Bao S., Wu Q., McLendon R.E., Hao Y., Shi Q., Hjelmeland A., Dewhirst M.W., Bigner D.D., Rich J.N. Glioma stem cells promote radioresistance by preferential activation of the DNA damage response. Nature. 2006;444:756–760. doi: 10.1038/nature05236. [DOI] [PubMed] [Google Scholar]
- Bidkhori G., Narimani Z., Hosseini Ashtiani S., Moeini A., Nowzari-Dalini A., Masoudi-Nejad A. Reconstruction of an integrated genome-scale co-expression network reveals key modules involved in lung adenocarcinoma. PLoS One. 2013;8:e67552. doi: 10.1371/journal.pone.0067552. [DOI] [PMC free article] [PubMed] [Google Scholar]
- Burger P.C., Kleihues P. Cytologic composition of the untreated glioblastoma with implications for evaluation of needle biopsies. Cancer. 1989;63:2014–2023. doi: 10.1002/1097-0142(19890515)63:10<2014::aid-cncr2820631025>3.0.co;2-l. [DOI] [PubMed] [Google Scholar]
- Cao R., Chen J., Zhang X., Zhai Y., Qing X., Xing W., Zhang L., Malik Y.S., Yu H., Zhu X. Elevated expression of myosin X in tumours contributes to breast cancer aggressiveness and metastasis. Br. J. Cancer. 2014;111:539–550. doi: 10.1038/bjc.2014.298. [DOI] [PMC free article] [PubMed] [Google Scholar]
- Cox D., Berg J.S., Cammer M., Chinegwundoh J.O., Dale B.M., Cheney R.E., Greenberg S. Myosin X is a downstream effector of PI(3)K during phagocytosis. Nat. Cell Biol. 2002;4:469–477. doi: 10.1038/ncb805. [DOI] [PubMed] [Google Scholar]
- Deleyrolle L.P., Harding A., Cato K., Siebzehnrubl F.A., Rahman M., Azari H., Olson S., Gabrielli B., Osborne G., Vescovi A., Reynolds B.A. Evidence for label-retaining tumour-initiating cells in human glioblastoma. Brain. 2011;134:1331–1343. doi: 10.1093/brain/awr081. [DOI] [PMC free article] [PubMed] [Google Scholar]
- Dhruv H.D., McDonough Winslow W.S., Armstrong B., Tuncali S., Eschbacher J., Kislin K., Loftus J.C., Tran N.L., Berens M.E. Reciprocal activation of transcription factors underlies the dichotomy between proliferation and invasion of glioma cells. PLoS One. 2013;15:e7213410. doi: 10.1371/journal.pone.0072134. [DOI] [PMC free article] [PubMed] [Google Scholar]
- Frech M., Andjelkovic M., Ingley E., Reddy K.K., Falck J.R., Hemmings B.A. High affinity binding of inositol phosphates and phosphoinositides to the pleckstrin homology domain of RAC/protein kinase B and their influence on kinase activity. J. Biol. Chem. 1997;272:8474–8481. doi: 10.1074/jbc.272.13.8474. [DOI] [PubMed] [Google Scholar]
- Galli R., Binda E., Orfanelli U., Cipelletti B., Gritti A., De Vitis S., Fiocco R., Foroni C., Dimeco F., Vescovi A. Isolation and characterization of tumorigenic, stem-like neural precursors from human glioblastoma. Cancer Res. 2004;64:7011–7021. doi: 10.1158/0008-5472.CAN-04-1364. [DOI] [PubMed] [Google Scholar]
- Giese A., Westphal M. Glioma invasion in the central nervous system. Neurosurgery. 1996;39:235–250. doi: 10.1097/00006123-199608000-00001. [DOI] [PubMed] [Google Scholar]
- Hardie D.G. AMPK: positive and negative regulation, and its role in whole-body energy homeostasis. Curr. Opin. Cell Biol. 2015;33:1–7. doi: 10.1016/j.ceb.2014.09.004. [DOI] [PubMed] [Google Scholar]
- Heimsath E.G., Jr., Yim Y.I., Mustapha M., Hammer J.A., Cheney R.E. Myosin X knockout is semi-lethal and demonstrates that myosin X functions in neural tube closure, pigmentation, hyaloid vasculature repression, and filopodia formation. Sci. Rep. 2017;6:17354. doi: 10.1038/s41598-017-17638-x. [DOI] [PMC free article] [PubMed] [Google Scholar]
- Kerber M.L., Cheney R.E. Myosin-X: a MyTH-FERM myosin at the tips of filopodia. J. Cell Sci. 2011;124:3733–3741. doi: 10.1242/jcs.023549. [DOI] [PMC free article] [PubMed] [Google Scholar]
- Kwon M., Bagonis M., Danuser G., Pellman D. Direct microtubule binding by Myosin 10 orients centrosomes toward retraction fibers and subcortical actin clouds. Dev. Cell. 2015;34:323–337. doi: 10.1016/j.devcel.2015.06.013. [DOI] [PMC free article] [PubMed] [Google Scholar]
- Lathia J.D., Mack S.C., Mulkearns-Hubert E.E., Valentim C.L.L., Rich J.N. Cancer stem cells in glioblastoma. Genes Dev. 2015;29:1203–1217. doi: 10.1101/gad.261982.115. [DOI] [PMC free article] [PubMed] [Google Scholar]
- Linch M., Sanz-Garcia M., Soriano E., Zhang Y., Philippe Riou P., Rosse C., Cameron A., Knowles P., Purkiss A., Kjaer S. A cancer-associated mutation in atypical protein kinase Ci occurs in a substrate-specific recruitment motif. Sci. Signal. 2013;6:ra82. doi: 10.1126/scisignal.2004068. [DOI] [PubMed] [Google Scholar]
- Lu K.V., Chang J.P., Parachoniak C.A., Pandika M.M., Aghi M.K., Meyronet D., Isachenko N., Fouse S.D., Phillips J.J., Cheresh D.A. VEGF inhibits tumor cell invasion and mesenchymal transition through a MET/VEGFR2 complex. Cancer Cell. 2012;22:21–35. doi: 10.1016/j.ccr.2012.05.037. [DOI] [PMC free article] [PubMed] [Google Scholar]
- Luikart B.W., Zhang W., Wayman G.A., Kwon C.-H., Westbrook G.L., Luis F., Parada L.F. Neurotrophin-dependent dendritic filopodial motility: a convergence on PI3K signaling. J.Neurosci. 2008;28:7006–7012. doi: 10.1523/JNEUROSCI.0195-08.2008. [DOI] [PMC free article] [PubMed] [Google Scholar]
- Luxton G.W.G., Gundersen G.G. Orientation and function of the nuclear–centrosomal axis during cell migration. Curr. Opin. Cell Biol. 2011;23:579–588. doi: 10.1016/j.ceb.2011.08.001. [DOI] [PMC free article] [PubMed] [Google Scholar]
- Ma X., Adelstein R.S. The role of vertebrate nonmuscle myosin II in development and human disease. Bioarchitecture. 2014;4:88–102. doi: 10.4161/bioa.29766. [DOI] [PMC free article] [PubMed] [Google Scholar]
- Makowska K.A., Hughes R.E., White K.J., Wells C.M., Peckham M. Specific myosins control actin organization, cell Morphology, and migration in prostate cancer cells. Cell Rep. 2015;13:2118–2125. doi: 10.1016/j.celrep.2015.11.012. [DOI] [PMC free article] [PubMed] [Google Scholar]
- Meley D., Bauvy C., houben-Weerts J.H.P.M., Dubbelhuis P.F., Helmond M.T.J., Codogno P., Meijer A.J. AMP-activated protein kinase and the regulation of autophagic proteolysis. J. Biol. Chem. 2006;281:34870–34880. doi: 10.1074/jbc.M605488200. [DOI] [PubMed] [Google Scholar]
- Miihkinen M., Grönloh M.L.B., Vihinen H., Jokitalo E., Goult B.T., Ivaska J., Jacquemet G. Myosin-X FERM domain modulates integrin activity at filopodia tips. BioRxiv. 2020 doi: 10.1101/2020.05.05.078733. [DOI] [PMC free article] [PubMed] [Google Scholar]
- Mistriotis P., Wisniewski E.O., Bera K., Keys J., Li Y., Tuntithavornwat S., Law R.A., Perez-Gonzalez N.A., Erdogmus E., Zhang Y. Confinement hinders motility by inducing RhoA mediated nuclear influx, volume expansion, and blebbing. J. Cell Biol. 2019;218:4093–4111. doi: 10.1083/jcb.201902057. [DOI] [PMC free article] [PubMed] [Google Scholar]
- Norden A.D., Young G.S., Setayesh K., Muzikansky A., Klufas R., Ross G.L., Ciampa A.S., Ebbeling L.G., Levy B., Drappatz J. Bevacizumab for recurrent glioblastoma. Neurology. 2008;70:779–787. doi: 10.1212/01.wnl.0000304121.57857.38. [DOI] [PubMed] [Google Scholar]
- Picariello H.S., Kenchappa R.S., Rai V., Crish J.F., Dovas A., Pogoda K., McMahon M., Bell E.S., Chandrasekharan U., Luu A. Myosin IIA suppresses glioblastoma development in a mechanically sensitive manner. Proc. Natl. Acad. Sci. U S A. 2019;116:15550–15559. doi: 10.1073/pnas.1902847116. [DOI] [PMC free article] [PubMed] [Google Scholar]
- Plantard L., Arjonen A., Lock J.G., Nurani G., Ivaska J., Strömblad S. PtdIns(3,4,5)P₃ is a regulator of myosin-X localization and filopodia formation. J. Cell Sci. 2010;123:3525–3534. doi: 10.1242/jcs.069609. [DOI] [PubMed] [Google Scholar]
- Puduvalli V.K., Hoang N. Chemotherapy of high grade astrocytomas in adults. Prog. Neurol. Surg. 2018;31:116–144. doi: 10.1159/000467374. [DOI] [PubMed] [Google Scholar]
- Raines A.N., Nagdas S., Kerber M.L., Cheney R.E. Headless Myo10 is a negative regulator of full length Myo10 and inhibits axon outgrowth in cortical neurons. J. Biol. Chem. 2012;287:24873–24883. doi: 10.1074/jbc.M112.369173. [DOI] [PMC free article] [PubMed] [Google Scholar]
- Sandquist J.C., Larson M.E., Woolner W., Ding Z., Bement W.M. An interaction between myosin-10 and the cell cycle regulator Wee1 links spindle dynamics to mitotic progression in epithelia. J. Cell Biol. 2018;217:849–859. doi: 10.1083/jcb.201708072. [DOI] [PMC free article] [PubMed] [Google Scholar]
- Summerbell E.R., Mouw J.K., Bell J.S.K., Knippler C.M., Pedro B., Arnst J.L., Khatib T.O., Commander R., Barwick B.J., Konen J. Epigenetically heterogeneous tumor cells direct collective invasion through filopodia-driven fibronectin micropatterning. Sci. Adv. 2020;6:eaaz6197. doi: 10.1126/sciadv.aaz6197. [DOI] [PMC free article] [PubMed] [Google Scholar]
- Sun Y., Ai X., Shen S., Lu S. NF-kappaB-mediated miR-124 suppresses metastasis of non- small-cell lung cancer by targeting MYO10. Oncotarget. 2015;6:8244–8254. doi: 10.18632/oncotarget.3135. [DOI] [PMC free article] [PubMed] [Google Scholar]
- Thorne R.G., Nicholson C. In vivo diffusion analysis with quantum dots and dextrans predicts the width of brain extracellular space. Proc. Natl. Acad. Sci. U S A. 2006;103:5567–5572. doi: 10.1073/pnas.0509425103. [DOI] [PMC free article] [PubMed] [Google Scholar]
- Tokuo H., Bhawan J., Coluccio L.M. Myosin X is required for efficient melanoblast migration and melanoma initiation and metastasis. Sci. Rep. 2018;8:10449. doi: 10.1038/s41598-018-28717-y. [DOI] [PMC free article] [PubMed] [Google Scholar]
- Towler M.C., Hardie D.G. AMP-activated protein kinase in metabolic control and insulin signaling. Circ. Res. 2007;100:328–341. doi: 10.1161/01.RES.0000256090.42690.05. [DOI] [PubMed] [Google Scholar]
- Venere M., Hamerlik P., Wu Q., Rasmussen R.D., Song L.A., Vasanji A., Tenley N., Flavahan W.A., Hjelmeland A.B., Bartek J., Rich J.N. Therapeutic targeting of constitutive PARP activation compromises stem cell phenotype and survival of glioblastoma-initiating cells. Cell Death Diff. 2014;21:258–269. doi: 10.1038/cdd.2013.136. [DOI] [PMC free article] [PubMed] [Google Scholar]
- Venere M., Horbinski C., Crish J.F., Jin X., Vasanji A., Major J., Burrows A.C., Chang C., Prokop J., Wu Q. The mitotic kinesin Kif11 is a driver of invasion, proliferation, and self-renewal in glioblastoma. Sci. Transl. Med. 2015;7:304ra143. doi: 10.1126/scitranslmed.aac6762. [DOI] [PMC free article] [PubMed] [Google Scholar]
- Woolner S., O'Brien L.L., Wiese C., Bement W.M. Myosin 10 and actin filamentrs are essential for mitotic spindle function. J. Cell Biol. 2008;182:77–88. doi: 10.1083/jcb.200804062. [DOI] [PMC free article] [PubMed] [Google Scholar]
- Yang J.M., Schiapparelli P., Nguyen H.N., Igarashi A., Zhang Q., Abbadi S., Amzel L.M., Sesaki H., Quinones Hinojosa A., Iijima M. Characterization of PTEN mutations in brain cancer reveals that pten mono-ubiquitination promotes protein stability and nuclear localization. Oncogene. 2017;36:3673–3685. doi: 10.1038/onc.2016.493. [DOI] [PMC free article] [PubMed] [Google Scholar]
- Zhang H., Berg J.S., Li Z., Wang Y., Lang P., Sousa A.D., Bhaskar A., Cheney R.E., Stromblad S. Myosin-X provides a motor-based link between integrins and the cytoskeleton. Nat. Cell Biol. 2004;6:523–531. doi: 10.1038/ncb1136. [DOI] [PubMed] [Google Scholar]
- Zhao R., Afthinos A., Zhu T., Mistriotis P., Li Y., Serra S.A., Zhang Y., Yankaskas C.L., He S., Valverde M.A. Cell sensing and decision making in confinement: the role of TRPM7 in a tug of war between hydraulic pressure and cross sectional area. Sci. Adv. 2019;5:eaaw7243. doi: 10.1126/sciadv.aaw7243. [DOI] [PMC free article] [PubMed] [Google Scholar]
Associated Data
This section collects any data citations, data availability statements, or supplementary materials included in this article.
Supplementary Materials
Both MYO10-intact and -deleted cells readily migrate through these channels with similar velocity. However, whereas the PTEN(−/−) cells frequently change direction in these channels, the PTEN/MYO10(−/−) cells rarely do.
The PTEN(−/−) cell moves into the wider 200-μm2 channel on the right, whereas the PTEN/MYO10(−/−) cell continues along a straight path.
Data Availability Statement
Data from the phospho-antibody array is available through Mendeley Data at the following link: Rosenfeld, Steven (2020), “Myosin 10 Phospho Antibody Array,” Mendeley Data, V1, https://doi.org/10.17632/5cnvmf9m2d.1.