

Abstract
Following a pH reduction in their drinking water over a span of more than 20 years, the City of Newark, New Jersey, has struggled with elevated lead (Pb) release from Pb service lines and domestic plumbing in the zone fed by the Pequannock Water Treatment Plant. In response, Newark initiated orthophosphate addition and provided faucet-mounted point-of-use (POU) filters and pitcher filters certified for Pb and particulate reduction under NSF/ANSI Standards 53 and 42 to residential homes in that zone. Water chemistry analysis and size fractionation sampling were performed at four of these houses. Analysis of the particulate material retained by the fractionation filters revealed that Pb was dominantly present in the water as fine Pb(II) orthophosphate particles. A considerable amount of the particulates occurred as a nanoscale fraction that sometimes passed through the POU faucet or pitcher filtration units. Scanning electron microscopy, transmission electron microscopy, and energy-dispersive spectroscopy analyses showed that the nanoparticles (<100 nm) and their aggregates were composed of Pb, phosphorus, and chlorine, which are consistent with pyromorphite, Pb5(PO4)3Cl. Electron diffraction and X-ray analyses supported the presence of hydroxypyromorphite and chloropyromorphite nanoparticles and the size range estimates from the imaging. This research confirmed that nonadherent Pb(II)-orthophosphate nanoparticles were an important form of Pb in drinking water in the Pequannock water quality zone of Newark.
Graphical Abstract
INTRODUCTION
The City of Newark, New Jersey’s drinking water distribution system, is divided into two sections, the Pequannock and Wanaque service areas, each with a separate source water and corrosion control strategy.1,2 In the Pequannock water quality zone, the pH of the water leaving the treatment plant ranged from about 8.5 to 9.0 in the 1990s until about 2001.1 After that, the pH decreased to a range of 8.0–8.3 until about 2014 and then precipitously dropped to the recent average of approximately 7.1.
Elevated lead (Pb) levels were noticed in 2017 in homes on the Pequannock side of the distribution system.3 To gain a better understanding of the Pb corrosion control and release mechanisms,1,2 Newark and their consultant (CDM Smith Inc.), with the support of the New Jersey Department of Environmental Protection (NJDEP), reached out to EPA’s Office of Research and Development (ORD) in late 2018 for assistance with analyzing Pb service line (LSL) scales in the different sections of the Newark distribution system. Mineralogical analysis of five LSL specimens taken from the Pequannock service area revealed that there were essentially two different scale types (see Figure 1 for descriptions). Particularly significant in terms of Pb release mechanisms was the presence of thick deposits of Pb(IV) oxide (β-PbO2), often occurring at the water/scale interface of LSLs. These layers ranged in thickness from approximately 20 to 80 μm, much thicker than those produced in short-term laboratory syntheses.
Figure 1.
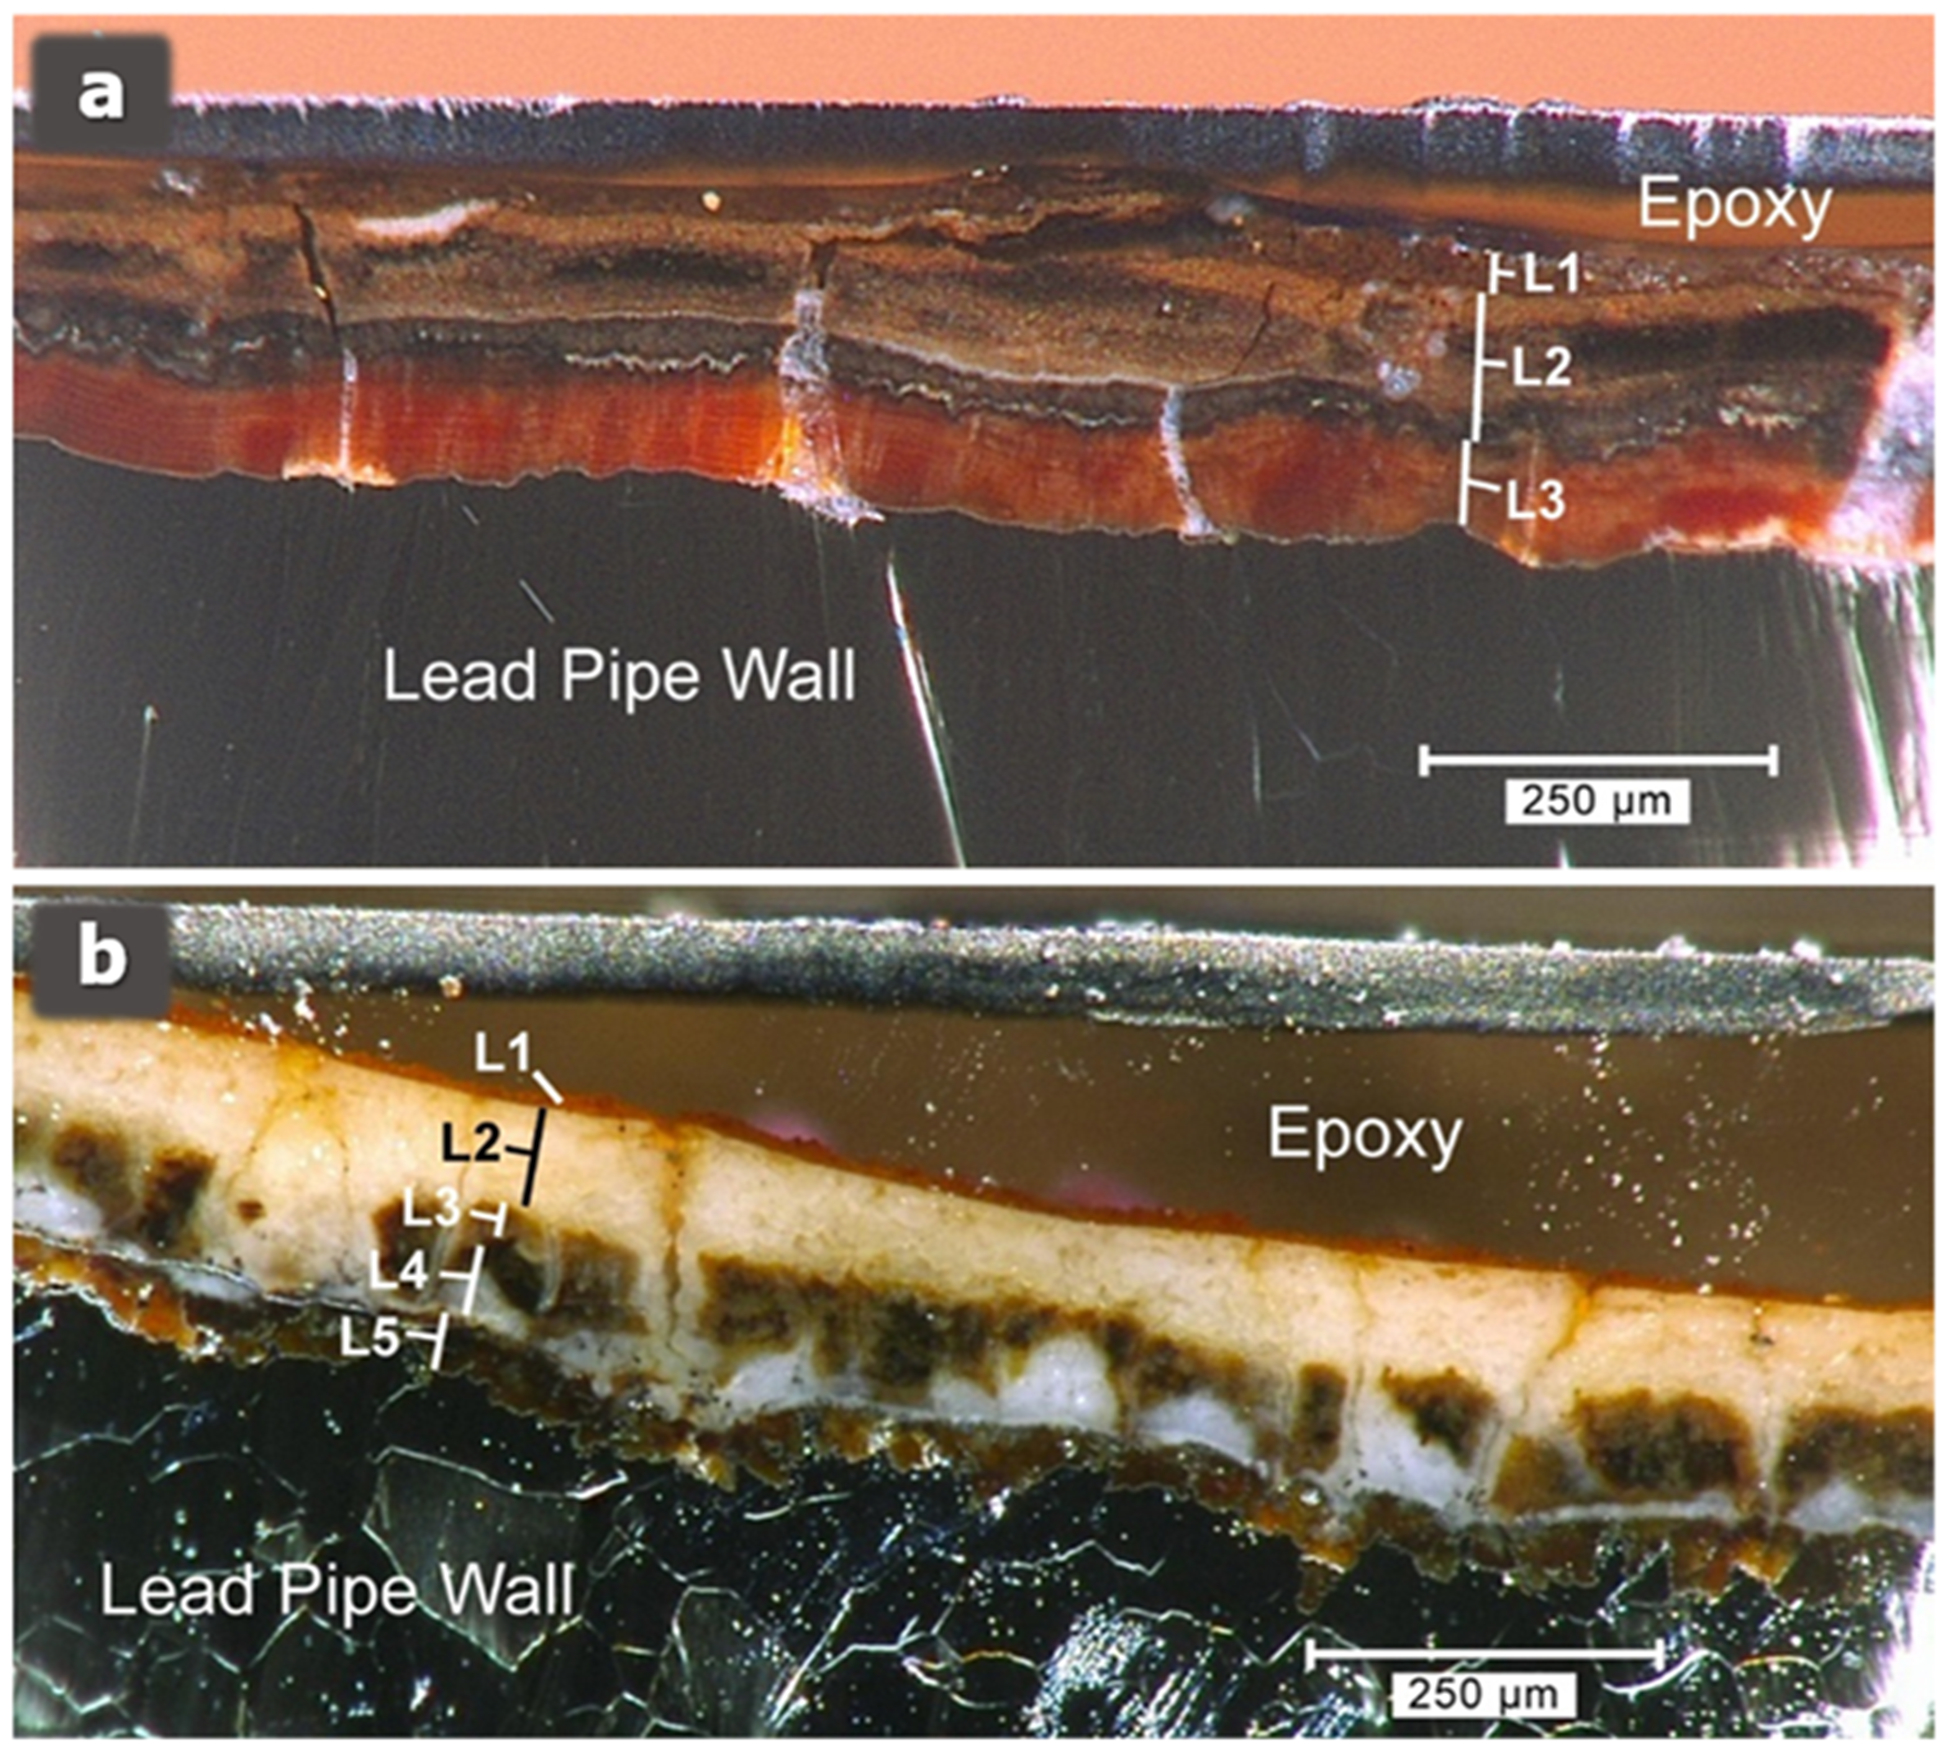
Representative pipe-scale cross sections from the Newark Pequannock zone. (a) Scale composed mainly of Pb(IV) oxides at the surface. Mineralogic composition of layers: L1 is predominantly plattnerite and hydrocerussite, with scrutinyite, cerussite, and amorphous material containing Si, Al, Fe, and Mn; L2 is predominantly plattnerite, with hydrocerussite, cerussite, and scrutinyite; and L3 is litharge. (b) Scale composed mainly of Pb(II) phases at the surface, with Pb(IV) at depth. Mineralogic composition of layers: L1 is predominantly cerussite, with hydrocerussite and amorphous material containing Si, Al, Fe, and Mn; L2 is predominantly hydrocerussite, with cerussite; L3 and L4 are predominantly hydrocerussite, with plattnerite and cerussite; and L5 is litharge.
Schock and Lytle (2011)4 showed a lead potential-pH diagram that explained that there were two plausible routes for reductive dissolution of PbO2 scales: the well-known drop in the oxidation-reduction potential (ORP/EH/pE) often caused by changing the residual disinfectant from free chlorine to monochloramine and lowering of pH. This is thermodynamically possible because the bulk water readily acts as an electron donor, with most of the stability field of PbO2 being above the upper stability boundary for oxygen generation from water under typical drinking water pHs.4,5 In addition, many researchers have pointed out that disinfection byproduct precursors, natural organic matter, and some oxidizable divalent metals that readily occur in drinking waters could also stimulate reductive dissolution of PbO2.4,6,7 The difficulties in meeting trihalomethane targets suggest both that there were additional electron donors available that could facilitate additional reductive dissolution of PbO2, in addition to the decrease in pH.2
Published research has previously observed that orthophosphate does not react with PbO2-scale layers while undergoing reductive dissolution,8–11 unlike the in situ conversion of Pb(II) carbonate and hydroxycarbonate to Pb(II)-orthophosphate solids widely described in corrosion control and Pb remediation literature.12–15
With the results received in late September 2018 of scale analyses and some sequential profiles showing high Pb results, in October 2018, the city began distributing approximately 40,000 PUR (Helen of Troy Limited) point-of-use (POU) faucet mount filters and 1000 PUR pitcher filters and a year’s supply of replacement cartridges, which were provided to residents in the Pequannock area with LSLs or leaded solder. The filters were certified according to the NSF/ANSI Standard 42 for Class I particulates (0.5 to <1 μm in size) and NSF/ANSI Standard 53 for the removal of soluble and particulate Pb below 10 μg/L (certification test requirement at the time). In May 2019, the City of Newark began orthophosphate addition to reduce Pb levels. The city conducted more frequent monitoring of Pb in tap water and initiated sequential profile sampling in a small number of homes to assess corrosion control effectiveness for Pb release from the various plumbing Pb sources. As part of their assessment, the city tested the performance of filters in three homes in July 2019; in two of these homes, they found that more than 10 μg/L passed through the filters (one pitcher and one faucet filter). The results prompted EPA’s Region 2 Administrator to urge Newark to provide bottled water to the community.16
Because of the filtered sample results, additional EPA technical assistance was offered. In late August 2019, the EPA staff performed targeted sampling of four homes that included the two previously sampled homes where filter performance was questioned in the zone receiving water from the Pequannock water treatment plant. Particle size fractionation was then used to gain an understanding of the nature of Pb release and elevated Pb levels. Particle size fractionation was expected to be especially important because Pb(II)-orthophosphate nanoparticles in particular,8,10,13,17–21 and both lead- and metal-phosphate nanoparticles in general,22–30 have been shown to be critical factors in understanding metal transport and mobility through drinking water and environmental systems.
The objective of this work was to identify the nature and size fractionation of lead particles collected from four houses in a specific section of Newark, New Jersey. The findings were intended to complement both laboratory and field studies designed to assess the effectiveness of the POU faucet (installed and treats water at a single tap) and pitcher (self-contained) filter devices to reduce Pb, to investigate the mechanisms of Pb release from the pipe scales, and to investigate the early progress of orthophosphate treatment in mitigating lead release from plumbing in these homes. Ultimately, the goal of the project was to help inform a longer-term strategy to improve corrosion control and reduce drinking water lead concentrations in Newark.
MATERIALS AND METHODS
Sampling Approach and Methodology.
Three homes in Newark were previously sampled by the city and two of those homes had filters that failed to remove Pb to the expected NSF/ANSI 53 certification levels.31 A fourth home was also identified by the city as having a POU filter that failed to reduce Pb levels below 10 μg/L. The City of Newark coordinated site sampling visits with residents. The EPA sampling team along with the city’s consultant (CDM Smith Inc.) and NJDEP staff visited three homes on August 21, 2019, and one home on August 22, 2019 (Figure S1). Residents were asked to flush their kitchen faucet (bypassing the POU device, if present) for at least 5 min and to not use water in the entire home until the sampling team arrived, which was a minimum of 6 h (stagnation period). Prior to sampling, the condition of the filter was examined (e.g., indicator light color was noted, proper device installation was confirmed, etc.), and the homeowner verified that the faucet was flushed prior to stagnation, that no water was used during stagnation, and the length of stagnation time.
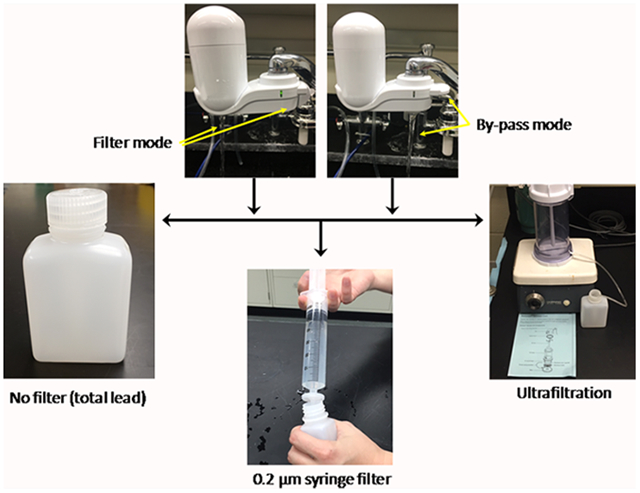
Based on previous sampling events conducted by the city, worst-case Pb levels were associated with LSLs (represented by approximately the seventh liter of water in the sequence) at the test homes with detailed sequential profile sampling. There-fore, this study protocol attempted to capture the Pb levels from the LSLs using the following sampling sequence: (1) after stagnation, the first 5500 mL of water was run through the kitchen faucet—with the POU filter bypassed (“off” position) in the homes with POU devices—which was counted by using successive fills of 500 mL bottles which were then wasted. (2) The POU filter was turned to the “on” position and an additional 500 mL was wasted. (3) For the seventh liter, 1000 mL was collected through the POU filter in a 1 L Nalgene high-density polyethylene bottle (“filtered” sample). In the case of the pitcher filter, the seventh liter sample was poured through the pitcher filter and the filtrate was collected in a separate 1 L Nalgene bottle. (4) With the POU filter bypassed (“off” position), another 1000 mL (eighth liter) was immediately collected in a separate 1 L Nalgene bottle (“bypass” sample). The flow rate during water sample collection was recorded (Table S1). The seventh and eighth liter water samples were collected to assess the total Pb (measured directly) and the fractions of soluble or dissolved Pb (operationally defined as Pb passing an ultrafilter), colloidal Pb particles >0.2 μm, and colloidal Pb particles between 0.01 and 0.2 μm that include nanoparticles (0.01–0.1 μm) trapped on and passing through the POU filter (Figure S2), and to identify any Pb particles in the tap water. (5) Finally, the faucet was left open in the bypass mode for seven additional minutes before a series of fully flushed water quality samples were collected for metals, pH, alkalinity, and total inorganic carbon analyses (Table 1) to reflect the “background” water quality at that time. The background water quality refers to the characteristics of drinking water entering each home after it passed through the service line and premise plumbing. It reflects the water quality in the adjacent distribution system zone, which may not be uniform across the entire system. Water samples (seventh and eighth liters) designated for size fractionation were processed in the field outside of the homes using 0.2 μm polypropylene disk syringe filters and 30 kDa ultrafilters having an estimated pore size of 0.01 μm.32,33 All Pb particle analyses were performed at the EPA Andrew W. Breidenbach Research Center (AWBERC) located in Cincinnati, Ohio, except for transmission electron microscopy (TEM) analyses; associated sample preparation was performed in the field in some cases.
Table 1.
Chemical Analysis of the Background Water for the Four Newark, NJ Homes Sampled by EPA That Previously Had Reported Elevated Lead Levels in POU- or Pitcher-Filtered Water
| analyte (mg/L unless noted) | reporting limit | house 1 | house 2 | house 3 | house 4 |
|---|---|---|---|---|---|
| aluminum | 0.004 | 0.05 | 0.04 | 0.05 | 0.04 |
| calcium | 0.01 | 11.9 | 12.0 | 12.3 | 12.0 |
| chloride | 5.0 | 39.2 | 38.8 | 38.7 | 38.3 |
| iron | 0.001 | 0.012 | 0.028 | 0.015 | 0.036 |
| potassium | 0.30 | 0.6 | 0.6 | 0.6 | 0.5 |
| magnesium | 0.005 | 3.35 | 3.35 | 3.36 | 3.31 |
| manganese | 0.001 | 0.036 | 0.016 | 0.029 | 0.016 |
| sodium | 0.03 | 23.7 | 23.8 | 24.0 | 23.3 |
| lead (μg/L) | 0.001 | 0.052 | 0.013 | 0.038 | 0.004 |
| phosphate (as PO4) | 0.025 | 1.57 | 1.38 | 1.50 | 1.44 |
| silicon | 0.02 | 3.26 | 3.38 | 3.46 | 3.29 |
| sulfate (as SO4) | 0.003 | 9.8 | 10.1 | 10.4 | 9.9 |
| alkalinity (as CaCO3) | 1.0 | 29.6 | 30.4 | 30.3 | 31.5 |
| zinc | 0.0005 | 0.081 | 0.028 | 0.049 | 0.033 |
| TIC (as C) | 7.05 | 7.35 | 7.21 | 7.35 | |
| pHa (units) | 7.6 | 7.6 | 7.6 | 7.6 |
pH estimated from distribution system water samples taken the same day.
Water Chemistry.
During the visit, six water samples from each home were submitted to the Region 2 Laboratory to determine lead concentrations using inductively coupled plasma mass spectrometry (ICP-MS) using appropriate quality assurance/quality control protocols for sample handling procedures. Background water samples were sent to AWBERC to be logged-in, preserved consistent with method specifications, and analyzed within applicable holding times. Total ammonia, nitrite, nitrate, and orthophosphate were analyzed within 24 h of collection using the automated colorimetric EPA Methods 350.1, 353.2, and 365.1, respectively.34–36 Lead was analyzed by ICP-MS following EPA Method 200.8, and all other metals were analyzed using inductively coupled plasma atomic emission spectrometry by EPA Method 200.7.37,38 Total inorganic carbon analyses were performed on samples preserved in glass vials with no airspace using ASTM D513 Test Method B.39 Total alkalinity and chloride were determined using the potentiometric titration standard methods 2320 b.4.6 and 4500-Cl D.40
The background water chemistry is summarized in Table 1. Lead levels in background samples from all houses ranged from 4 to 52 μg/L, which likely reflected substantial pick-up of particulate Pb from service lines as the background flushed water traveled across the pipe surfaces.
Scanning Electron Microscopy and Energy-Dispersive X-ray Spectroscopy.
Samples for particle analysis by scanning electron microscopy (SEM) and energy-dispersive X-ray spectroscopy (EDXS) were prepared in the field (Figure S3). SEM aluminum sample stubs with double-sided carbon adhesive were used to collect Pb particles off the ultrafiltration discs. The side of the stub with the carbon adhesive was dabbed onto the ultrafiltration disc in the field while the disc was still wet. Particles collected on the SEM stubs were then analyzed at EPA’s Advance Materials and Solids Analysis Research Core (AMSARC) in AWBERC using SEM and EDXS. The samples were examined using a JEM7600FE scanning electron microscope (JEOL USA, Inc. Peabody, MA) at 15 kV and a working distance of 8 mm. The elemental composition of particles was identified using both an Oxford X-Max 50 EDS (Oxford Instruments America, Inc., Concord, MA) and a low-angle electron backscatter detector. The EDXS spectra were analyzed using Aztec Software (Oxford Instruments America, Inc., Concord, MA).
TEM and Selected Area Electron Diffraction.
The particle-containing water was transferred from sample bottles directly to sample holder grids in the field for TEM analysis. A 3 mm copper TEM grid was held in place with self-closing forceps so that it was not touching any surfaces and a 1 mL polypropylene disposable pipette-containing sample water was used to place one drop of water sample on the TEM grid. The TEM grid was incubated in contact with the sample until the water had fully evaporated, leaving any particles present on the grid; the grid was then placed into the grid holder. Samples were analyzed at the Electron Microscopy Center in the College of Engineering at the University of Kentucky (Lexington). The samples were analyzed with an FEI CM-20 TEM, and images were taken with an FEI Talos F200X high-resolution TEM imaging system. All micrographs were obtained with the field emission gun operating at 200 kV. ImageJ software program developed by the National Institutes of Health was applied to process the images. CrysTBox program, a toolset implemented in MATLAB, was used to assist in the analysis of electron diffraction patterns. Diffraction patterns of all four samples can be indexed to pyromorphite and compared with the International Centre for Diffraction Data (ICDD, Newtown Square, PA) JCPDS database (Pb5[PO4]3Cl, PDF# 73–1729, ICSD# 24238).
Powder X-ray Diffraction.
X-ray diffraction (XRD) analyses were performed directly from the 0.2 μm and ultrafiltration fractionation filters from the bypassed water filtered solids (from the four houses) to identify crystalline solids retained by each of the filters. XRD samples were prepared at AWBERC. For the ultrafiltration samples, a 32 mm diameter disk was cut from the center of each filter and mounted on a quartz zero-background plate. For the 0.2 μm filter samples, the bottom of each filter housing was carefully cut off using a fine-toothed saw and an artist’s knife. The filters were then removed and fixed to quartz zero background plates with a spray adhesive. Because the 0.2 μm filters were of smaller diameter than the zero background plates, paper shims were used to maintain the correct height of the filter surface in the sample holder. An unused “blank” of both filter types was prepared and mounted in the same manner as the samples to evaluate the characteristic diffraction pattern of the filter material. The samples were analyzed using a PANalytical X’Pert Pro theta/theta powder diffractometer (Malvern Panalytical Inc., Westborough, MA) using Cu Kα radiation generated at 1.8 kW (45 kV, 40 mA) and an X’Celerator RTMS detector. The samples were spun at 1 revolution/s to improve particle statistics. Patterns were collected in the continuous scan mode, from 5 to 89.994° 2θ at a scan speed of 0.01181°/s, with data binned into 0.0167113° steps. Diffraction patterns were analyzed using Jade+ version 9.8 software (Materials Data, Livermore, CA) and the 2018 ICDD PDF-4+ database (ICDD, Newtown Square, PA).
RESULTS AND DISCUSSION
Water Pb Analyses.
Total (soluble, particulate, and colloidal) Pb levels in the bypassed waters were 1300, 75, 727, and 33 μg/L for houses 1, 2, 3, and 4, respectively (Figure 2). Filter fractionation of the bypassed waters showed that soluble Pb represented a small fraction of the total Pb. There was very little difference between 0.2 μm and ultrafiltered water samples, suggesting that Pb particles were larger than 0.2 μm or colloidal or smaller Pb particles agglomerated so that they were unable to pass through the fractionation filters. Considering the ultrafiltered Pb results, soluble Pb (defined as Pb passing the ultrafilter) levels were 23, 31, 30, and 10 μg/L. These values were reasonably within the range of expected solubility of Pb(II)-orthophosphates (e.g., pyromorphite, Pb5[PO4]3Cl, or hydroxypyromorphite, Pb5[PO4]3OH), given the many uncertainty factors.13,41 Despite large differences between total and soluble Pb concentrations (by as much as 2 orders of magnitude in some cases), soluble Pb concentrations were very similar across the sites. Particulate Pb (the difference between total lead and ultrafiltered lead) accounted for most of the total Pb in the water samples (Figure 2), yielding 98, 58, 96, and 70% of the total at houses 1, 2, 3, and 4, respectively. The greatest amount of particulate Pb was associated with homes having the greatest amount of total Pb.
Figure 2.

Pb concentrations in drinking water samples collected from four Newark, New Jersey homes. Water was collected from homes after bypassing the water around POU filters (bypass samples shown in shades of orange) and after passing through the POU or pitcher filter devices (filtered samples shown in shades of blue) provided to the homeowners by the city. Water samples were fractionated through a 0.2 μm filter and through an ultrafilter and presented as the Pb concentration passing the respective filter. Total Pb was measured directly from a nonfiltered sample. Pb water speciation results for (a) house 1, (b) house 2, (c) house 3, and (d) house 4 are shown. The red line in graphs references the Pb level the filters were certified to achieve according to the NSF/ANSI Standard 42 and 53 at the time of the study (10 μg/L).
The POU or pitcher filter-treated water samples showed a similar trend in soluble and particle fractions of Pb. The four homes had postfilter total Pb levels of 45, 28, 22, and 1 μg/L for houses 1, 2, 3, and 4, respectively (Figure 2, Table 2). As with the bypassed water, there was very little difference between 0.2 μm and the ultrafiltered water fractionation results. Based on the ultrafiltered results, soluble Pb levels were 6, 5, 4, and 1 μg/L. Particulate Pb was the dominant form with the exception of house 4, accounting for 87, 82, 82, and 3% of the total lead that passed the POU or pitcher filter at houses 1, 2, 3, and 4, respectively. A complete detailed breakdown of the removal percentages of the different size fractions of Pb for the POU and pitcher filter devices tested is given in Table 2.
Table 2.
Pb Concentrations in the Drinking Water Samples Collected from the Four Newark Homes That Had Previously Reported Elevated Pb Levels in POU- or Pitcher-Filtered Watera
| Pb removed through POU or pitcher deviceb | |||||||||
|---|---|---|---|---|---|---|---|---|---|
| house | total Pb that bypassed POU or pitcher filter (μg/L) | total Pb passing through POU or pitcher filter device (μg/L) | Pb passing 0.2 μm filter (μg/L) | Pb passing ultrafilter or soluble Pb (μg/L) | Pb particles removed by 0.2 μm filter (%) | Pb particles removed by ultrafilter (%) | total Pb (%) | particulate and colloidal Pb (%) | soluble Pb (%) |
| house 1 | 1300 | 45 | 6 | 6 | 88 | 87 | 97 | 97 | 74 |
| house 2 | 75 | 28 | 10 | 5 | 64 | 82 | 63 | 48 | 84 |
| house 3 | 727 | 22 | 4 | 4 | 82 | 82 | 97 | 97 | 87 |
| house 4 | 33 | 1 | 1 | 1 | 3 | 3 | 97 | 100 | 90 |
Total Pb in water that bypassed the POU or pitcher filters is compared to Pb size fractions passing the filters and respective removal percentages.
Removals determined from ultrafilter results.
Solids Analyses.
Colloidal particles trapped on the 0.2 μm filter and ultrafilter were analyzed by SEM/EDXS, TEM, and XRD when sufficient amounts of materials were present. A large fraction of the colloids present on the ultrafilters in bypassed water from all four homes were nanoparticles (<100 nm), represented for houses 1 and 3 in Figure 3a,c. The nature of the nanoparticles appeared to be consistent among all houses, although details were difficult to fully characterize because of magnification and resolution limitations of the SEM. Sufficient particulate material was available in houses 1–3 for SEM/EDXS analyses and is presented in Figures S3–S5. Nanoparticles, occurring individually or as agglomerates, were very small. Most individual particles appeared to be in the 0.01–0.2 μm size range, although it could not be ruled out that smaller ones may have passed the ultrafilter. Interestingly, despite very little difference between Pb in water passing 0.2 μm and ultrafilters (Figure 2), direct size analyses suggested that Pb particles should have passed the 0.2 μm filter. The observation suggests that individual particles agglomerated in masses large enough to be trapped on the 0.2 μm filter. The shape of the particles appeared to be elongated and rounded, but the specific crystal structure was not possible to identify, given that they were too small to see clearly. Elemental analysis of the small particles by EDXS was dominantly composed of elemental Pb, phosphorus, and chlorine (Figures S4 and S6), which is consistent with pyromorphite, Pb5(PO4)3(Cl,OH). Particles that passed the POU filters in houses 1 and 3 were identical to those in the bypass waters (Figure 3b,d). Specifically, the particles were very small nanoparticles (0.01–0.2 μm) composed of elemental Pb, phosphorus, and chlorine. The observations indicate that Pb nanoparticles passed the POU filters.
Figure 3.

Size and morphology analyses of lead nanoparticles suspended in drinking water trapped on ultrafilters before and after passing through the POU filter provided by the City of Newark, New Jersey; specifically, (a) SEM micrograph of particles in bypass water from house 1, (b) SEM micrograph of particles in POU-filtered water from house 1, (c) SEM micrograph of particles in bypass water from house 3, and (d) SEM micrograph of particles in POU-filtered water from house 3.
For the powder XRD analyses, only the 0.2 μm filters had sufficient particulate material to obtain XRD patterns. The 0.2 μm filter materials gave strong but consistent blank patterns that had to be subtracted to detect the solid material on the filters (Figure S6). Several drying and desiccation artifact crystalline solids were identified. Halite (NaCl) was present on filters from all four homes but showed particularly intense peaks on the filter from house 3. A sharp peak near 29.5° 2θ in the sample from house 3 is attributable to calcite (CaCO3). However, small peaks are present at the same position in samples from houses 1 and 2. A broad peak centered near 30.3° 2θ in filter samples from houses 1 and 3 is indicative of a Pb phosphate phase. Potential phases with their primary diffraction peak in this area include hydroxypyromorphite (Pb5[PO4]3OH), a Ca-substituted hydroxypyromorphite with a small amount of Ca incorporated into the crystal lattice, and a tertiary Pb(II)-orthophosphate (Pb3[PO4]2). Crystallite sizes of the different phases were estimated from the measured full width at half-maximum values of the diffraction peaks via the Scherrer equation42 using Jade 9.8 software (Materials Data, Livermore, CA). The broad, Pb phosphate peaks indicate very small crystallite sizes of approximately 0.02 μm for the house 1 and 3 samples. The Pb(II)-orthophosphate particle size estimates were in remarkable agreement with SEM observations of particles trapped on the ultrafilters.
Further corroboration of the nature of the nanoparticles found in the water is shown in the TEM images and selected area diffraction patterns of particles from the filter bypass waters in all four homes (Figure 4). Individual Pb particles were in the nanoparticle size range and were indexed to pyromorphite (Pb5(PO4)3Cl, PDF# 73–1729, ICSD# 24238).
Figure 4.

TEM micrographs and corresponding electron diffraction pattern analyses of lead nanoparticles suspended in POU filter-bypassed waters from (a1–a4) house 1, (b) house 4, and (c) house 3 and pitcher filter-bypassed water from (d) house 2. Diffraction patterns of samples from all four houses can be indexed to pyromorphite (Pb5(PO4)3Cl), PDF# 73–1729, ICSD# 24238. In (a3), pyromorphite nanoparticles can be observed as dark dots, which are highlighted in the yellow circles. In (b), the clear lattice fringes spacings of 0.295 and 0.862 nm, respectively, and an interplanar angle of 59.2° can be indexed to the 112 and 100 planes of Pb5(PO4)3Cl. In (c), the clear lattice fringe spacings of 0.212 and 0.557 nm, respectively, and an interplanar angle of 79.2° can be indexed to the 203 and 101 planes of Pb5(PO4)3Cl. In (d), the clear lattice fringe spacings of 0.366 and 0.862 nm, respectively, and an interplanar angle of 90° can be indexed to the 002 and 100 planes of Pb5(PO4)3Cl.
Results and Discussion.
The results of this study showed that in the four homes sampled by EPA in the City of Newark’s Pequannock drinking water system, the soluble Pb levels were relatively low and consistent with an orthophosphate-treated Pb(II) chemistry system, as compared to a Pb-carbonate-controlled system. However, the unfiltered waterborne Pb was dominantly composed of Pb(II)-orthophosphate nanoparticles based on SEM, TEM, and XRD analyses. The Pb(II)-orthophosphate nanoparticles were highly mobile and did not readily attach to the scale surfaces, which, based on prior representative mineralogical analysis, were often composed of actively dissolving PbO2. There is currently no basis to predict the length of time it would take to mitigate the high rate of Pb release by building up a substantial diffusion barrier deposit of Pb(II)-orthophosphate material to impair release into the water. These particles contrast in size, composition, and mineralogy with the turbidity and particle release episode in the Washington DC system in the mid-2000s, which created a surficial deposit of complex amorphous material including Fe, Ca, Al, and P on the lead pipes.43
Because a fraction of the small mobile Pb particles passed through the POU and pitcher filters used in three of the homes under these particular scale and water quality conditions, verification of lead reduction performance of the POU faucet-mount and pitcher filters under similar uncommon water chemistry and scale transformation situations should be considered. This field experience and parallel laboratory experimentation (to be reported elsewhere) strongly suggest that the current Pb(II) carbonate-based lead particulate challenge water used for certification under NSF/ANSI 5331 contains much larger particulates than were observed in this study and fails to predict the breakthrough of lead phosphate nanoparticles in certain water qualities, particularly the ones with very low hardness. Given that the increasing number of public water systems having LSLs that are moving toward the use of phosphate-based chemicals for corrosion control, which many research papers have shown frequently, favors the formation of lead and other nanoparticles, additional research should be done to evaluate a more robust and applicable filter certification challenge water to give consumers an additional level of safety.
Although there are still uncertainties in the exact steps along the reaction pathway leading to formation and release of Pb particles, factors including water chemistry, corrosion control, and Pb pipe scale mineralogy would certainly play a significant role in the potential for particle formation and agglomeration in the water and at the pipe/water interface. For example, formation of the same phosphate nanoparticles may not occur, or occur to the same extent, in a water system where the passivating scales on the lead pipes consist primarily of an adherent and stable Pb(II) carbonate- or hydroxycarbonate-based scale, instead of the thick surficial β-PbO2 layer as was observed in some locations during this study. This work also reinforces the best practice that water systems encountering disinfection byproduct problems need to understand the nature of the pipe scale deposits, especially if they have LSLs, and do not undertake pH or disinfection changes without adequate study to ensure that lead mobilization will not occur.
Additional work is warranted to better understand the extent of particulate Pb release in homes across Newark’s distribution system and to generally better understand the mechanism(s) controlling Pb release during established PbO2-scale transformations under real drinking water distribution system conditions. Such information would help the city minimize Pb levels at consumer’s taps and will also help other cities avoid similar events.
Supplementary Material
ACKNOWLEDGMENTS
The authors would like to acknowledge the EPA Region 2 colleagues for analyzing water samples, assisting with field sampling, and valuable technical discussions, and the New Jersey Department of Environmental Protection for assisting with field sampling. The authors would also like to acknowledge the City of Newark, the residents of Newark that allowed us to sample in their homes, and the city’s consultant, Sandy Kutzing and others with CDM Smith, for allowing us to sample in the city, assisting with field sampling, and valuable technical discussions. Last, the authors greatly appreciate the assistance of Michelle Latham from EPA’s Safe and Sustainable Water Resources Program for reviewing and editing the manuscript, Jonathan Pressman (EPA ORD), Regan Murray (EPA ORD), Thomas Speth (EPA ORD), Andrea Porter (EPA Region 5), and Christine Ash (EPA Region 2) for providing technical manuscript reviews, Mariah Caballero (Oak Ridge Associated Universities program) for graphics editing, and EPA ORD management for their support.
Footnotes
The authors declare no competing financial interest.
The information in this article has been reviewed in accordance with the U.S. Environmental Protection Agency’s policy and approved for publication. The views expressed in this article are those of the authors and do not necessarily represent the views or the policies of EPA. Any mention of trade names, manufacturers, or products does not imply an endorsement by the U.S. Government or EPA; EPA and its employees do not endorse any commercial products, services, or enterprises.
Supporting Information
The Supporting Information is available free of charge at https://pubs.acs.org/doi/10.1021/acs.est.0c03797.
Photographs of field work and filtration systems at locations sampled, operational details and status of filtration systems, lead results for particle size fractionation study, and analytical result details for particle morphology and composition not critical for the body of the paper (PDF)
Complete contact information is available at: https://pubs.acs.org/10.1021/acs.est.0c03797
Contributor Information
Casey Formal, Office of Research and Development, Center for Environmental Solutions & Emergency Response, Water Infrastructure Division, Oak Ridge Associated Universities (ORAU) Student Services Contractor to the U.S. Environmental Protect Agency, Cincinnati 45268, United States.
Maily Pham, Office of Research and Development, Center for Environmental Solutions & Emergency Response, Water Infrastructure Division, U.S. Environmental Protect Agency, Cincinnati, Ohio 45268, United States.
REFERENCES
- (1).CDM Smith. Pequannock WTP Corrosion Control Review and Recommendations—Final; City of Newark Department of Water and Sewer Utilities, March 15, 2019. [Google Scholar]
- (2).CDM Smith. Wanaque Gradient Corrosion Control Review; City of Newark Department of Water and Sewer Utilities, June 28, 2019. [Google Scholar]
- (3).e-CFR Electronic Code of Federal Regulations. Title 40: Protection of Environment, Part 141—National Primary Drinking Water Regulations, Subpart I—Control of Lead and Copper. 2019, https://www.ecfr.gov/cgi-bin/text-idx?SID=e2518c71584f661373492ec68f3f6660&mc=true&node=sp40.25.141.i&rgn=div6 (accessed April 23, 2019).
- (4).Schock MR; Lytle DA Internal Corrosion and Deposition Control In Water Quality and Treatment: A Handbook of Community Water Supplies, 6th ed.; McGraw-Hill, Inc.: New York, 2011. [Google Scholar]
- (5).Pourbaix M; De Zoubov N; Vanleuenhaghe C; Van Rysselberghe P Section 17.5. Lead In Atlas of Electrochemical Equilibria in Aqueous Solutions; National Association of Corrosion Engineers: Houston, TX, 1966; Chapter IV, pp 485–492. [Google Scholar]
- (6).Lin Y-P; Valentine RL The Release of Lead from the Reduction of Lead Oxide (PbO2) by Natural Organic Matter. Environ. Sci. Technol 2008, 42, 760–765. [DOI] [PubMed] [Google Scholar]
- (7).Lin Y-P; Valentine RL Reduction of Lead Oxide (PbO2) and Release of Pb(II) in Mixtures of Natural Organic Matter, Free Chlorine and Monochloramine. Environ. Sci. Technol 2009, 43, 3872–3877. [DOI] [PubMed] [Google Scholar]
- (8).Bae Y; Giammar D Processes Controlling the Development of Effective Lead Corrosion Control with Orthophosphate; Water Research Foundation: Denver, CO, 2019; project no. 4686. [Google Scholar]
- (9).DeSantis MK; Schock MR; Bennett-Stamper C Incorporation of Phosphate in Destabilized PbO2 Scales Proceedings AWWA Water Quality Technology Conference, Toronto, ON, November 4–7, 2012. [Google Scholar]
- (10).Zhao J; Giammar DE; Pasteris JD; Dai C; Bae Y; Hu Y Formation and Aggregation of Lead Phosphate Particles: Implications for Lead Immobilization in Water Supply Systems. Environ. Sci. Technol 2018, 52, 12612–12623. [DOI] [PubMed] [Google Scholar]
- (11).DeSantis MK; Schock MR; Tully J; Bennett-Stamper C Orthophosphate Interactions with Destabilized PbO2 Scales. Environ. Sci. Technol 2020. Submitted manuscript. [DOI] [PMC free article] [PubMed] [Google Scholar]
- (12).Grimes SM; Johnston SR; Batchelder DN Lead Carbonate-Phosphate System: Solid-Dilute Solution Exchange Reactions in Aqueous Systems. Analyst 1995, 120, 2741–2746. [Google Scholar]
- (13).Schock MR; Wagner I; Oliphant R The Corrosion and Solubility of Lead in Drinking Water In Internal Corrosion of Water Distribution Systems, 2nd ed.; AWWA Research Foundation/DVGW Forschungsstelle: Denver, CO, 1996; pp 131–230. [Google Scholar]
- (14).Tully J; DeSantis MK; Schock MR Water quality–pipe deposit relationships in Midwestern lead pipes. AWWA Water Sci. 2019, 1, No. e1127. [PMC free article] [PubMed] [Google Scholar]
- (15).Noel JD; Wang Y; Giammar DE Effect of water chemistry on the dissolution rate of the lead corrosion product hydrocerussite. Water Res. 2014, 54, 237–246. [DOI] [PubMed] [Google Scholar]
- (16).Lopez PD EPA letter to Commissioner McCabe and Mayor Baraka, August 9, 2019. 2019, https://www.epa.gov/sites/production/files/2019-08/documents/letter_to_mccabe_and_baraka-final.pdf.
- (17).Lytle DA; Schock MR; Scheckel K The Inhibition of Pb(IV) Oxide Formation in Chlorinated Water by Orthophosphate. Environ. Sci. Technol 2009, 43, 6624–6631. [DOI] [PubMed] [Google Scholar]
- (18).Aljijakli M; Zhao J; Dai C; Hu Y Aggregation of Lead Phosphate Nanoparticles: Implications for Lead Immobilization in Soil and Pipes. 2017, http://hdl.handle.net/10657/2427 (accessed November 20, 2019).
- (19).Devamani RHP; Alagar M Synthesis and Characterization of Lead (II) Phosphate Nano particles. NanoTechnology 2013, 61, 16922–16926. [Google Scholar]
- (20).Hulsmann AD Particulate Lead in Water-Supplies. J. Inst. Water Environ. Manage 1990, 4, 19–25. [Google Scholar]
- (21).Trueman BF; Anaviapik-Soucie T; L’Hérault V; Gagnon GA Characterizing colloidal metals in drinking water by field flow fractionation. Environ. Sci.: Water Res. Technol 2019, 5, 2202–2209. [Google Scholar]
- (22).Harrison RM; Laxen DPH Physicochemical speciation of lead in drinking water. Nature 1980, 286, 791–793. [DOI] [PubMed] [Google Scholar]
- (23).Gounaris V; Anderson PR; Holsen TM Characteristics and Environmental Significance of Colloids in Landfill Leachate. Environ. Sci. Technol 1993, 27, 1381–1387. [Google Scholar]
- (24).Hedberg J; Blomberg E; Odnevall Wallinder I In the Search for Nanospecific Effects of Dissolution of Metallic Nanoparticles at Freshwater-Like Conditions: A Critical Review. Environ. Sci. Technol 2019, 53, 4030–4044. [DOI] [PubMed] [Google Scholar]
- (25).Magnuson ML; Lytle DA; Frietch CM; Kelty CA Characterization of Submicrometer Aqueous Iron(III) Colloids Formed in the Presence of Phosphate by Sedimentation Field Flow Fractionation with Multiangle Laser Light Scattering Detection. Anal. Chem 2001, 73, 4815–4820. [DOI] [PubMed] [Google Scholar]
- (26).Schäfer T; Huber F; Seher H; Missana T; Alonso U; Kumke M; Eidner S; Claret F; Enzmann F Nanoparticles and their influence on radionuclide mobility in deep geological formations. Appl. Geochem 2012, 27, 390–403. [Google Scholar]
- (27).Soldatova AV; Balakrishnan G; Oyerinde OF; Romano CA; Tebo BM; Spiro TG Biogenic and Synthetic MnO2 Nanoparticles: Size and Growth Probed with Absorption and Raman Spectroscopies and Dynamic Light Scattering. Environ. Sci. Technol 2019, 53, 4185–4197. [DOI] [PubMed] [Google Scholar]
- (28).Talebi Atouei M; Rahnemaie R; Goli Kalanpa E; Davoodi MH Competitive adsorption of magnesium and calcium with phosphate at the goethite water interface: Kinetics, equilibrium and CD-MUSIC modeling. Chem. Geol 2016, 437, 19–29. [Google Scholar]
- (29).Vargas IT; Pavissich JP; Olivares TE; Jeria GA; Cienfuegos RA; Pastén PA; Pizarro GE Increase of the concentration of dissolved copper in drinking water systems due to flow-induced nanoparticle release from surface corrosion by-products. Corros. Sci 2010, 52, 3492–3503. [Google Scholar]
- (30).Xia X; Xie C; Cai S; Yang Z; Yang X Corrosion characteristics of copper microparticles and copper nanoparticles in distilled water. Corros. Sci 2006, 48, 3924–3932. [Google Scholar]
- (31).NSF/ANSI. Drinking Water Treatment Units—Health Effects; NSF International: Ann Arbor, MI, 2018; NSF/ANSI 53–2018. [Google Scholar]
- (32).Erickson HP Size and shape of protein molecules at the nanometer level determined by sedimentation, gel filtration, and electron microscopy. Biol. Proced. Online 2009, 11, 32–51. [DOI] [PMC free article] [PubMed] [Google Scholar]
- (33).Guo L; Santschi PH Ultrafiltration and its applications to sampling and characterisation of aquatic colloids In Environmental Colloids and Particles: Behaviour, Separation and Characterisation; John Wiley & Sons: Chichester, England, 2007; Vol. 10, p 159. [Google Scholar]
- (34).USEPA. Method 350.1: Determination of Ammonia Nitrogen by Semi-Automated Colorimetry, Revision 2.0 ed.; Environmental Monitoring Systems Laboratory, Office of Research and Development: Cincinnati, OH: 1993, https://www.epa.gov/sites/production/files/2015-06/documents/epa-350.1.pdf. [Google Scholar]
- (35).USEPA. Method 353.2: Determination of Nitrate-Nitrite Nitrogen by Automated Colorimetry, Revision 2.0 ed.; Environmental Monitoring Systems Laboratory, Office of Research and Development: Cincinnati, OH: 1993, https://www.epa.gov/sites/production/files/2015-08/documents/method_353-2_1993.pdf. [Google Scholar]
- (36).USEPA. Method 365.1: Determination of Phosphorus by Semi-Automated Colorimetry, Revision 2.0 ed.; Environmental Monitoring Systems Laboratory, Office of Research and Development: Cincinnati, OH: 1993, https://www.epa.gov/sites/production/files/2015-08/documents/method_365-1_1993.pdf. [Google Scholar]
- (37).USEPA. Method 200.7: Determination of Metals and Trace Elements in Water and Wastes by ICP Atomic Emission Spectroscopy, Revision 4.4, EPA/600/R-94/111; Environmental Monitoring Systems Laboratory, Office of Research and Development: Cincinnati, OH, 1994. [Google Scholar]
- (38).USEPA. Method 200.8: Determination of Trace Elements in Waters and Wastes by Inductively Coupled Plasma-Mass Spectrometery, Revision 5.4, EPA/600/R-94/111; Environmental Monitoring Systems Laboratory, Office of Research and Development: Cincinnati, OH, 1994. [Google Scholar]
- (39).ASTM. Standard Test Method for Total and Dissolved Carbon Dioxide in Water; American Society for Testing and Materials: Conshohocken, PA, 2012; Vol. 11.01, D 513–11. [Google Scholar]
- (40).APHA; AWWA; WEF. Standard Methods for the Examination of Water and Wastewater, 23rd ed.; American Water Works Association: Denver, CO, 2018. [Google Scholar]
- (41).Wahman DG; Pinelli MD; Schock MR; Lytle DA Practical Relationships from Theoretical Lead Solubility Modeling. 17th Annual EPA Small Systems Drinking Water Virtual Workshop, Session 8A, Cincinnati, OH, September 1–3, 2020. [Google Scholar]
- (42).Patterson AL The Scherrer Formula for X-Ray Particle Size Determination. Phys. Rev 1939, 56, 978–982. [Google Scholar]
- (43).Tesfai F; Constant P; Reiber S; Giani R; Donnelly M Precipitate Formation in the Distribution System Following Addition of Orthophosphate Proceedings AWWA Water Quality Technology Conference, Denver, CO, 2006. [Google Scholar]
Associated Data
This section collects any data citations, data availability statements, or supplementary materials included in this article.