
Figure 2.
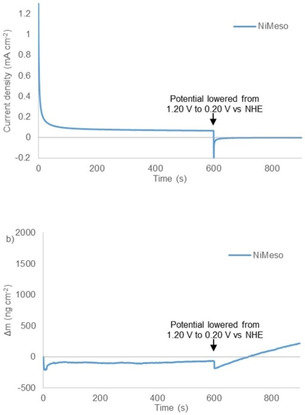
Controlled potential electrolysis measurements at 1.20 V vs. NHE (non‐catalytic conditions) for 600 s followed by 300 s at 0.2 V vs. NHE (a) and simultaneous electrochemical quartz microbalance measurements (b) of 1 mM NiMeso (blue) in a 0.1 M pH 7.0 phosphate buffer using a gold working electrode.