

Abstract
Quinone‐based, aqueous redox flow batteries are a promising technology for large‐scale, low‐cost energy storage. To understand the influence of substituent and substituent pattern effects of quinone‐based derivatives on the redox potential, a screening study was performed that included benzoquinone, naphtaquinone, and anthraquinone derivatives. The order of substituent influence is −OH>−Me/−OMe for decreasing the redox potential and −F<−SO3 −<−CN, −NO2 for increasing the redox potential, which is in agreement with general expectations. We found that the consideration of resonance and inductive effects design strategies of redox‐active materials can be extended by the ability of intramolecular hydrogen bond formation, steric hindrance, and energetic differences of conformers for oxidized and reduced species. Due to the complexity and overlap of these effects, theoretical screening studies can provide guidance for the design of new molecular materials. In addition to the redox potential, other parameters such as stability, solubility, and kinetic rate constant or synthetic accessibility are crucial to consider.
Keywords: density functional theory, quinones, redox flow battery, screening, substitution
A computational screening study has been performed in order to understand and optimize substituent pattern effects of quinone‐based redox‐flow systems. Therefore, the type, number, and position of substituents at benzo‐, naphto‐ and anthraquinione derivatives has been investigated.

Introduction
Aromatic organic compounds constitute a promising class of active materials for large‐scale, low‐cost energy storage applications, especially for redox flow batteries (RFBs).1, 2 A successful example in this context is the RFB with 9,10‐anthraquinone‐2,7‐disulfonic acid and the Br2/Br couple.1 Lin et al. reported a non‐toxic ferrocyanide paired with anthraquinone derivatives in less‐corrosive alkali electrolyte.3 Furthermore, an aqueous RFB with only quinone materials was build employing 9,10‐anthraquinone‐2,7‐disulfonic acid and 1,2‐benzoquinone‐3,5‐disulfonic acid.4 The quinones represent a particularly promising class of aromatic compounds that show fast charge transfer kinetics and a tunable redox potential depending on the substitution of the quinone framework.5 In acidic aqueous solution, the reduction of quinone to hydroquinone takes place by a very fast, simultaneous two‐electron and two‐proton transfer reaction.5, 6, 7, 8 It has been discussed that the promising properties of these quinone materials depend strongly on their aromaticity.9
In the quest for new quinone‐based materials, computational methods and molecular modeling represent powerful tools to contribute to the understanding, screening and design of these organic active materials supporting the development of organic batteries. In order to optimize the properties of quinones, Bachmann et al. studied approximately 50 anthraquinone derivatives by means of density functional theory (DFT) calculations.5 They showed the importance of electron donating substituents for improving the electrochemical windows with sufficient stability against oxidation. The influence of substituents to the, for example, redox potential of quinoxaline derivatives has also been shown by Assary et al.6 Furthermore, a comparison of substitution effects concerning one‐electron and two‐electron reduction processes on 1,4‐benzoquinone was conducted by Hammes‐Schiffer and co‐workers.10 The redox behavior of tetrachloro‐o‐benzoquinone interacting with water molecules was investigated by Guo et al.11
A large computational high‐throughput screening study of 1710 quinone derivatives has been utilized for Q/QH2 couples in aqueous solution at low pH value.7 The results allow for an analysis of structure‐property relationships and the prediction of novel and potentially suitable candidates for organic redox flow batteries. Also, the same authors considered single substituted quinone derivatives and showed that substitution next to the quinone carbonyl/hydroxyl group has a strong impact on the redox potential whereas substitution at other positions influences the solubility.7 Another large high‐throughput virtual screening of about 1400 organic molecules with a multi‐step screening procedure demonstrated the successful in silico design of candidates for redox flow batteries.8 In a recent study, Tabor et al. investigated quinone‐based materials with the substituents of carbon acid, phosphonic acid and sulfonic acid regarding their influence on the redox potential and stability against the unwanted Michael addition and the formation of gem‐diols.12 Therefore, they applied DFT calculations in combination with semi‐empirical methods and performed over 1 000 000 calculations. All these studies show that screening procedures already do play an important role and will play an increasing role for the discovery of new functional molecular materials.
In line with the expected substituent effects from qualitative considerations of chemical bonds and electron densities, Er et al.7 determined the order of the reduction potentials for single and fully substituted BQ, NQ and AQ derivatives for aqueous redox flow batteries according to −OH<−Me<−OMe<−H<−F<−SO3H<−CN, −NO2. This qualitative trend is also in agreement with the available experimental data for Qs with −SO3 and −OH substituents.13 Furthermore, it has been shown for diaza‐anthraquinones and dihydroxy‐phthalazines that −OMe, −Me and −OH result in redox potential lowering.14, 15 General chemistry concepts indicate that methyl substituents have a positive inductive effect, which should lower the redox potential. Methoxy and hydroxyl substituents show a positive resonance effect and a negative inductive effect which could lead to an increase or decrease of the redox potential. For the fluorine substituent an increase of the redox potential is expected due to the strong inductive effect that predominates the positive resonance effect. Cyano, sulfonic acid and nitro groups are expected to increase the redox potential due to negative resonance and inductive effects.
Cumulative behavior has been shown for the redox potential shifts by increasing the number of substituents.7 However, the value of the redox potential shifts strongly depends on the kind of substituent.7 Thus, Er et al. reported variations of the redox potentials from 0.1 to 0.4 V for −Me, −OMe, −F, −NO2 and −CN, and 1.3 to 1.4 V for −OH and −SO3 − substituents by comparing single and fully substituted Q derivatives that cannot be explained by considering simply inductive and resonance effects.
In this work, we aim to close the gap between the considerations of single and fully substituted (or selectively substituted) BQ, NQ and AQ derivatives by investigating a large variational space of possible numbers and positions of substituents on quinone based structures. We choose as base structures 1,4‐benzoquinone (BQ), 1,4‐naphtoquinone (NQ) and 9,10‐anthraquinone (AQ) derivatives and functionalized them with seven substituents, namely −Me, −OMe, −OH, −F, −CN, −SO3 − and −NO2. The labelling of the substituent positions of BQ, NQ or AQ derivatives is given in Figure 1. We use the notation QS(P1, P2, …) for the investigated redox active molecules with Q=BQ, NQ or AQ; S=substituent and P1, P2 for the positions of the substituent. We have analyzed the calculated substitution pattern‐related redox potentials and discuss the results in the context of resonance and inductive effects as well as other effects such as conformer stability, steric hindrance and intramolecular hydrogen bonds. With this study we aim to obtain structural tuning parameters for quinones regarding redox potentials going beyond the classical consideration of electron affinity.
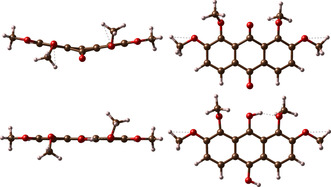
Figure 1.
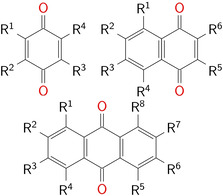
Labeling of substitution positions of 1,4‐benzoquinone (upper left), 1,4‐naphtoquinone (upper right) and 9,10‐anthraquinone (bottom) derivatives.
First, the selection of molecules and conformers as well as the screening procedure is described. Second, we assessed the used method by comparison with other methods and experimental results. Third we analyzed the substituent pattern effects and the influence of their position for BQ, NQ and AQ derivatives on the redox potential. In the last part, we discuss the stability of these molecules by considering distorted molecular structures.
Results and Discussion
Method assessment
Due to the dependence of the redox potential on the chosen density functional, we compared our GGA‐D3 level of theory to the hybrid density functional (‐D3) and perturbation theory level of theory for the pristine BQ, NQ and AQ molecules and selected derivatives. A detailed description of the methodology is given in the computational details. Calculated values at MP2/aug‐cc‐pVTZ (PCM) or B3LYP‐D3/aug‐cc‐pVTZ (PCM) level of theory result in similar values as obtained for PBE‐D3/aug‐cc‐pVDZ (PCM) (see Figure 2). The maximum deviation for MP2 is slightly smaller than for PBE−D3, the maximum deviation for B3LYP slightly larger. It should be noted that the calculation of the redox potential does not only depend on the density functional; parameters such as the solvation free energy of protons and the standard hydrogen reference electrode value can shift the value of the redox potential whereas the qualitative trend remains unaffected. The redox potential shift from pristine BQ to AQ is well described by all methods. In all further calculations, we utilized the PBE‐D3 approach. This GGA functional can be employed in combination with density fitting which noticeably reduces the calculation time. Also, this density functional was applied in other studies of redox potentials of quinones.7
Figure 2.
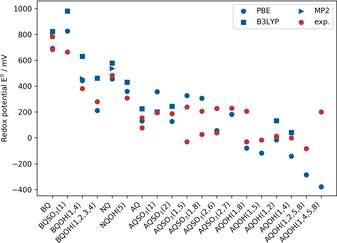
Comparison between the calculated redox potentials (blue) and experimental redox potentials (red)13, 16, 17, 18 vs. SHE. A table with all values and references can be found in the Supporting Information (Table S1).
In order to estimate the qualitative agreement and determine the mean absolute deviation (MAD) for the applied PBE‐D3/aug‐ccpVDZ (PCM) approach, we compared our calculations to available experimental results (see Figure 2, Table S1). The qualitative trend of the calculated redox potentials of the Q derivatives compared to the corresponding pristine molecules is well in line with experimental trends. Exceptions are only the values for BQSO3(1) and AQSO3(2). The experimental data indicates for BQSO3(1) a lowering of the redox potential compared to BQ. However, in line with the electron withdrawing character of the −SO3 − group, our calculated values represent the expected increase of the redox potential. The calculation of the redox potential with explicit water molecules in addition to PCM leads to a lowering of the redox potential because the Michael addition takes place. This gives evidence that in the experimental data, side reactions might have influenced the result. The substituent of the AQSO3(2) molecule is far away from the carbonyl groups and the redox potential shift is rather small. This circumstance might explain a calculated value similar as for AQ.
The MAD of the redox potentials calculated by PBE‐D3/aug‐cc‐pVDZ(PCM) in comparison to experimental values amounts to 71 mV, the maximum deviation is 202 mV for the AQOH(1,2,5,8) molecule. For six molecules two experimental values from different groups have been reported that differ by 77 mV to 269 mV. For these molecules we used the experimental value that is closest to the calculated value in order to determine the MAD. Furthermore, we excluded the redox potential of AQOH(1,4,5,8), because the experimental value is considered to be not reliable due to electrode reactions as mentioned by the authors of Ref. [7].
Whereas the calculated redox potentials of the BQ derivatives are mostly overestimated, the reduction potentials of NQ and AQ derivatives are mostly underestimated. The MAD (79 meV) of the BQ derivatives (4 molecules) is very similar to the one of AQ derivatives (12 molecules, 72 meV). Even by obtaining such relatively small MADs, we are aware that the limitations of the simple polarizable continuum model (PCM) can lead to larger deviations. Kim et al. have shown that for two‐electron, two‐proton redox potentials of AQ derivatives with ether groups at low pH value a large MAD of 194 mV is obtained by DFT calculations in combination with the PCM whereas the MAD of AQ derivatives with other substituents was 33 mV.18
In order to estimate the influence of explicit water molecules on the redox potential, we have performed test calculations for all BQ derivatives and three additional water molecules close to the molecules (see Table S2 in the Supporting Information). For several BQ derivatives (especially for substituents −SO3 −, but also −OMe or −NO2) a Michael addition, a deprotonating of a water molecule or a strong distortion of the substituent occurred. These derivatives are not considered to be stable and were excluded in the following evaluation.
Due to the additional water molecules in the model, the redox potentials are shifted to larger values, with an average difference of +89 mV for all tested molecules. Deviations from this shift only occur for BQNO2(1,3), BQOH(1,4), BQOH(1,2,3), BQOMe(1,2,3), BQSO3(1,4) and BQSO3(1,2,3). For these molecules, no shift of the redox potential or a shift towards smaller values of the redox potential are obtained. Nevertheless, the MAD of the shift is 59 mV, so it is comparable to the MAD of the redox potential of the comparison between theoretical and experimental data. The calculation of selected redox potentials for NQ derivatives shows a comparable behavior. Despite the fact that the absolute values of the redox potential are shifted by the model with the explicit water molecules (combined with PCM), the trends of the redox potential for the BQ derivatives almost not change. With the main focus of analyzing qualitative trends of the substituent effects on the redox potential, we assume that the calculated redox potential trends with the PBE‐D3/cc‐pVDZ(PCM) method are well reproduced.
Analysis of substituent effects for BQ derivatives
The BQ derivatives show the highest redox potentials among the Q derivatives due to the smallest ring size. An increase/decrease of this redox potential due to substituent effects amounts to approximately 0.4 V and −0.5 V, respectively (see Table 1 and Figure 3). Along our expectation of electron withdrawing and donating effects, there is a redox potential increase for BQ derivatives with −NO2, −CN, −SO3 − substituents compared to BQ, whereas the redox potentials decrease for BQ derivatives with −OH, −Me, −OMe substituents. The substituent −F has nearly no influence on the reduction potential and unexpectedly slightly decreases the redox potential. As reported by Hammes–Schiffer and co‐workers, the strong electronic withdrawing inductive effect only significant influences the one‐electron redox potential, not the two electron two hydrogen potentials due to net redox leveling.10 The order of the reduction potentials for each substitution pattern (number and position variation) is the same. The effect of the electron withdrawing or donating character of the substituents can be considered as cumulative comparing the single and full substituted BQ derivatives in agreement with the study of Er et al.7
Table 1.
Redox potentials (all values vs. SHE) for the pristine Qs and the maximal and minimal variation for Q derivatives (der.) with respect to pristine Q and the corresponding substituent in brackets. Furthermore, the range of the redox potential is given for each substituent.
|
Structure/Variation/ Substituent |
[mV], BQ der. |
[mV], NQ der. |
[mV], AQ der. |
|---|---|---|---|
|
pristine |
693 |
456 |
131 |
|
max |
+424 (NO2) |
+544 (NO2) |
+390 (SO3 −) |
|
min |
−481 (OH) |
−632 (OH) |
−539 (OH) |
|
−OH |
231 |
600 |
522 |
|
−OMe |
70 |
418 |
359 |
|
−Me |
115 |
282 |
206 |
|
−F |
32 |
110 |
179 |
|
−SO3 − |
237 |
456 |
504 |
|
−CN |
240 |
303 |
299 |
|
−NO2 |
176 |
458 |
450 |
Figure 3.
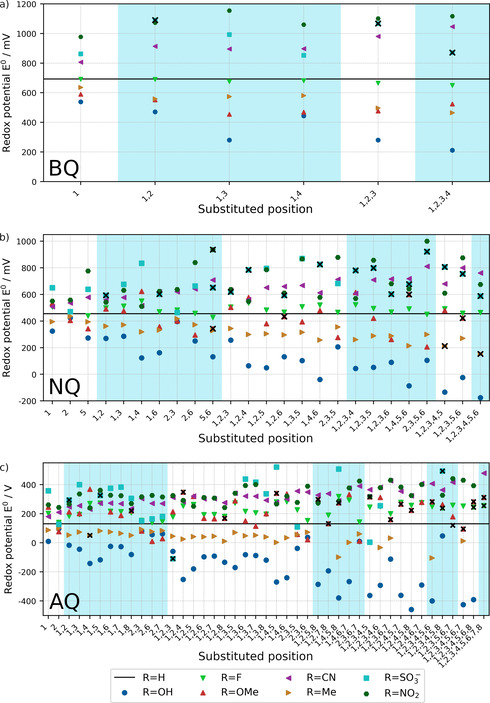
Calculated redox potentials of the a) BQ, b) NQ and c) AQ derivatives at PBE−D3/aug‐cc‐pVDZ(PCM) level of theory (all values vs. SHE). The positions of the substituents (compare Figure 1) are given on the x‐axis. The black line indicates the redox potential of pristine BQ, NQ or AQ, the blue and white areas help to differentiate between the various numbers of substituents. The crossed‐out data points represent molecules with a dihedral distortion within the ring system of more than 15° for BQ, 17° for NQ, and 22° for AQ, which are considered to have a low stability. The values of the redox potentials are given in the Supporting Information (Tables S3‐S5).
However, BQ derivatives with −OMe, −NO2 and −SO3 − substituents do not show the highest or lowest redox potential for a fully substituted molecule. The increase/decrease of the redox potential strongly depends on the kind of substituent (see Table 1 and Figure 3). It appears at first glance that for substituents with major resonance effects larger cumulative effects appear than for substituents with dominant inductive effects. In any case, substituents revealing resonance effects are those for which the formation of intramolecular hydrogen bonds becomes dominant. To demonstrate the influence of the intramolecular hydrogen bonding on the redox potential, the calculated redox potentials of BQOH(1) with differently oriented hydroxyl groups are shown in Figure 4. The difference in the relative energies of the conformers leads to redox potential variations of about 120 mV. Thus, the resonance effect and/or the hydrogen bond formation might lead to the strongest increase or decrease of the redox potential. Furthermore, the position of the substituents also has a strong impact on the redox potential. In this context, we like to note that BQ derivatives with two substituents next to the carbonyl/hydroxyl group yield nearly the same range of redox potential among the chosen substituents as the fully substituted BQ derivatives.
Figure 4.
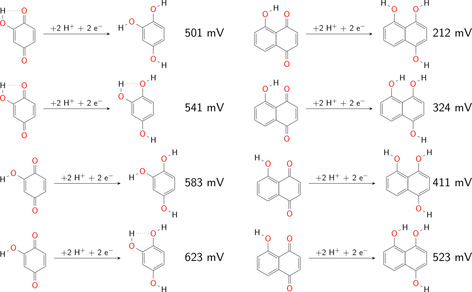
Influence of the intramolecular hydrogen bonds on the redox potential (all values vs. SHE) of BQOH(1) (left) and NQOH(1) (right).
Analysis of substituent effects for NQ derivatives
The pristine NQ exhibits a redox potential of about 250 mV smaller than BQ due to the larger aromatic ring system. The NQ derivatives reveal as expected a slightly larger maximum increase (0.5 V) and decrease (−0.6 V) due to the substituent effects and a larger number of substituents (see Table 1 and Figure 3). For NQ derivatives as for the BQ derivatives, the −NO2 and −OH groups show the strongest tuning potential. The expected potential shifts based on the substituent's electronic affinity are obtained. An exception represents, as in the case for BQ, the −F substituent with a hardly varied redox potential. The −OMe groups yield in single cases an increase of the reduction potential compared to pristine NQ. The order of the redox potentials for each substituent considering different positions or numbers of substituents slightly varies. The changes primarily exist for −SO3 − and the −NO2 in the range of high redox potentials and for the −Me and −OMe groups in the range of low redox potentials.
Considering the maximum range of redox potential for each substituent, these are by a factor of about two to three larger than for the BQ derivatives. Exceptions are the −CN substituent with nearly no enhancement compared to BQ derivatives and −OMe with a larger variation. An average cumulative effect is typically obtained. For the −CN, −Me and −OH substituents, this cumulative trend to larger or smaller redox potentials can be nicely seen in Figure 3b. Stronger variations of redox potentials are obtained for NQ derivatives with −NO2, −SO3 − or −OMe substituents.
The substitution position at the NQ derivatives strongly matters. Subsequent, for −NO2‐substituted NQ derivatives, a single substituted NQ derivative with the nitro‐group directly adjacent to the carbonyl/hydroxyl group reveals a larger redox potential than the fully substituted NQ. Between the single and fully substitution strong variations of the redox potential depending on the substitution position occur. The smallest increase or decrease of redox potentials due to substituent effects are obtained for positions 2 and 3. These are the positions, which are further away from the carbonyl/hydroxyl groups. The variation of the redox potentials is particularly pronounced for −OH, −NO2 and −SO3 − groups. In this context, NQ derivatives with −NO2 group's exhibit largest redox potentials when positions 5 and 6 are substituted and in addition positions 1 or 4 are not. NQ derivatives with −OH substituents lower the potential most when position 1 and 4 are substituted. From the aforementioned trends, we derive that intramolecular hydrogen bonds govern the properties of the molecules with −OH groups attached. The impact of the hydrogen bond of NQ with one −OH group at position 1 is represented in Figure 4; it results in a variation of the reduction potential by about 310 mV. For the NQ derivatives with, for example, −NO2 groups different substitution pattern than for the −OH groups deliver the strongest variation in redox potential. This trend might be related to the larger size of the substituent and additional steric effects. Steric effects also influence the redox potentials of NQ derivatives with −OMe and −SO3 − substituents.
Analysis of substituent effects for AQ derivatives
The redox potential for pristine AQ is the smallest if compared to BQ and NQ because AQ possesses a larger ring framework in its structure. The range of the redox potentials for each substituent indicate a similar tuning range as for NQ derivatives (see Table 1 and Figure 3) with the exception of obtaining a higher redox potential for the −F substituent compared to BQ and NQ. The AQ derivatives with −OMe groups exhibit an increase as well as a decrease of the redox potentials compared to pristine AQ, which is the consequence of strong steric effects of the intramolecular −OMe group interaction. The strongest variation of the redox potential is received for the −OH group with the corresponding lowering (−0.5 V) and the −CN group with the related increase (+0.4 V) of the redox potential. The substituent order of the redox potentials for different positions or numbers of substituents varies stronger than for NQ derivatives. An average cumulative effect is obtained for several substituents. Due to strong geometrical changes of several structures and convergence issues, not all substituted AQ derivatives have been calculated. Furthermore, for few AQ derivatives (especially with sulfonate acid substituents) very large redox potentials have been obtained that have been excluded for the analysis (see the Supporting Information, Figure S1).
The influence of the intramolecular hydrogen‐bonding network on the redox potential is obtained for AQ derivatives with −OH groups. The redox potentials for −OH groups not in adjacent position to the AQ carbonyl/hydroxyl groups only exhibit small variations of the redox potential up to 200 mV compared to pristine AQ. Whereas AQ derivatives with −OH groups at neighboring positions to AQ carbonyl /hydroxyl groups show redox potential decreases by up to 500 mV. For the larger substituents, for example, −NO2 and −SO3 − the highest redox potentials are not obtained for the above‐mentioned favored pattern for −OH groups. In these cases especially high redox potentials are achieved when only one or none of the neighboring positions to a carbonyl/hydroxyl group is functionalized and other groups are located at the outer carbon positions. For such pattern, the hydrogen bond formation energy is expected to play not the major role because the functional group is too far away. This presumption indicates for the larger substituents that steric hindrance will strongly affect the redox potential. Furthermore, different conformers or structural distortion of reduced and oxidized species shifts the redox potential. For example, a highly distorted ring framework of the oxidized structure and a small ring distortion for the reduced species together with a hydrogen bond network may result in a higher redox potential for e. g. AQOMe(1,2,7,8) (see Figure 5). However, sterically demanding structures can lead to large ring plane distortions which might reduce the stability of derivatives which carry a large number of substituents (see discussion next paragraph).
Figure 5.
Distorted ring framework of the methoxy‐substituted AQOMe(1,2,7,8) in its oxidized form (top) and reduced (bottom) species. Further examples for BQSO3(1,2) and NQOMe(1,2,3,4,5,6) can be found in Figure S2.
Estimation of structure stability of Qs
Although this is not the main focus of the herein presented work, we would like to conclude by a general discussion of the stability of the Q derivatives. Various Q derivatives show a strong distortion of the aromatic ring systems. Zhigalko et al. showed by MP2 and population calculations that non‐planar geometries for benzene, naphthalene and anthracene are possible up to dihedral angles of the ring system by ±15° for benzene, ±17° for naphthalene and ±22° for anthracene at room temperature.19 The estimated dihedral angle for the distortion of the ring framework of naphthalene derivatives has been supported by an analysis of corresponding structures in the Cambridge Crystal Structure Database. Here only naphthalene derivatives with dihedral angles smaller than ±17° were found. In line with these findings, we assume Q derivatives with larger dihedral angles than the one found in the study of Zhigalko et al. as unstable due to the strongly distorted and strained ring structures. The ring framework shows in these cases a higher relative energy than the planar one. The distortion of the aromatic systems leads to a reduced overlap of the πCC‐orbitals of the carbon atoms and consequently to a reduced aromaticity and a reduced stability. In the case of BQ, NQ and AQ even smaller dihedral angles might be obtained, considering the energetic differences compared to the benzene, naphthalene and anthracene ones. Also, the distortion leads to a significant increase of the relative energy of these molecules compared to its isomers.
By using this simple geometric descriptor for an estimate of general stability of the Q derivatives, we marked the Q derivatives with strongly distorted ring frameworks in Figure 3. For the BQ derivatives three structures (all with −SO3 − substituents) show a strongly distorted benzene framework including the full and nearly full‐substituted derivatives. Strongly distorted molecules with ring framework dihedral angles larger than 17° have been marked in Figure 3b for NQ derivatives. Here, a greater number of distorted molecules has been found than for the BQ derivatives. Mainly, NQ derivatives with −SO3 − substituents have been identified with large ring system distortions. However, selected NQ derivatives with −OMe and −Me groups and a high degree of substitution also show large ring system distortions. Distorted AQ based molecules with changes of dihedral angles of the ring system by more than 22° have been crossed out in Figure 3c. These are molecules with −OMe, −F or −SO3 − substituents and especially with a larger number of substituents. For several AQ derivatives, large values for redox potentials have been obtained which we refer to the formation of partly unphysical structures. These structures have been excluded in the Figure 3c and are shown in the Supporting Information.
Thus, we used a simple geometric descriptor to identify redox active molecules with low stability based on chemical understanding of molecular structures. However, the Michael addition and the gem‐diol formation can lower the cycling stability and reactivity of Q derivatives as it was shown by Tabor et al. in addition.12 This leads for example to a low stability of BQ derivatives.3 While the geometric descriptor (considering dihedral angles) only excludes molecules with an unfavorable structure, the calculation of reaction energies, for example, against the Michael addition would exclude Q derivatives as unsuitable due to the high reactivity. With the main focus of this work on substitution pattern effects on the redox potential, we have not considered the reactivity of BQ, NQ and AQ derivatives.
Conclusions
Due to recent requirements for the stationary storage of energy, a large‐scale, low‐cost energy‐storage technology is needed. One promising technology is the aqueous redox flow battery, especially with quinone‐based molecules as redox‐active material. For the optimization and design of these materials, screening calculations were performed to determine the influence of substitution and substitution pattern effects of 1,4‐benzoquinone (BQ), 1,4‐naphtoquinone (NQ) and 9,10‐anthraquinone (AQ) derivatives functionalized with seven substituents (−Me, −OMe, −OH, −F, −CN, −SO3 − and −NO2) on the redox potential.
In line with the study by Er et al.,7 who considered single and fully substituted BQ, NQ, and AQ derivatives, the typical order of substituent influence is obtained: −OH>−Me/−OMe for decreasing the redox potential and −F<−SO3 −<−CN, −NO2 for increasing the redox potential. Based on this result, it seems that large negative resonance effects – as for example for −CN and −NO2 – have a stronger impact on the redox potential than the inductive effect of fluorine‐substituted Q derivatives. Fluorine substituents show only minor influence on the redox potential – in particular for the derivatives of BQ and NQ.
However, our results of substitution pattern effects on the redox potential indicate an influence of the position of the substituents at the derivatives, which goes along with the possibility to form intramolecular hydrogen bonds with the Q carbonyl/hydroxyl group or for larger substituents with avoiding steric hindrance. Furthermore, structural and energetic differences of conformers or structural distortion of reduced and oxidized species can lead to unexpected shifts in the redox potentials. Sterically demanding molecules can suffer from large ring‐plane distortions. Overall, large distortions reduce the stability of quinone derivatives whereas the stability has been estimated by a simple geometric descriptor considering dihedral angels. The simple geometric descriptor represents an easy‐to‐use improvement for screening procedures without additional computing effort to exclude molecules with low stability from an intuitive chemical point of view.
In summary, the overall variation or the redox potential spans a total range of about 905 mV for BQ derivatives, 1176 mV for NQ derivatives, and 886 mV for AQ derivatives with the considered substituents. Largest increase for the redox potential has been obtained for BQNO2(1,3) by 424 mV compared to BQ, for NQNO2(2,3,4,6) by 544 mV compared to NQ and AQSO3−(1,4,5) by 390 mV compared to AQ. The interaction of the substituents with the AQ hydroxyl groups and the avoiding of sterical hindrance compared to full substitution allow higher values of the redox potentials than for the fully substituted Q derivatives. The largest decrease for the redox potential has been obtained for BQOH(1,2,3,4) by 481 mV compared to BQ, for NQOH(1,2,3,4,5,6) by 632 mV compared to NQ and AQOH(1,2,4,5,8) by 539 mV compared to AQ. The formation of intramolecular hydrogen bonds allows for high values of the redox potentials. The results show that next to the resonance and inductive effects of the substituents, the hydrogen bond formation to quinone carbonyl/hydroxyl groups, the steric hindrance, structural and energetic differences in conformers, and structural differences for oxidized and reduced species can have a strong impact on the redox potential. Thus, the application of widely used chemical concepts such as resonance and inductive effects only allow a rough judgment. The formation of hydrogen bonds, steric hindrance, and structural and energetic differences of conformers for oxidized and reduced species should be included in the design and synthesis strategies for optimizing and discovering novel redox‐active materials for aqueous electrolytes. However, this can hardly be realized without quantum chemical calculations. Due to the complexity of these overlapping effects, theoretical screening studies are essential tools to guide the molecule design in close cooperation with the expertise of synthetic accessibility.
Furthermore, we like to add that a multitude of factors has to be considered to derive suitable target molecules for aqueous redox flow batteries: Next to the redox potential, the diffusion coefficient of the molecule in the electrolyte, the kinetic rate constant for the electron‐transfer reaction at the electrode as well as the solubility of the active material have to be considered.20 Besides, the degradation rate (role of unwanted side reactions) of the molecule during the battery lifetime must be minimal to meet the requirements for long‐term and efficient energy storage with organic molecules. Herein, we merely provide the view on the impact of substituents and their pattern on the redox potential as one factor but believe that the presented trends stimulate further research on the other key properties and parameters for compatible and high‐performing organic molecules for aqueous redox flow batteries.
Computational Details
All DFT calculations of BQ, NQ and AQ derivatives have been performed using the Gaussian09 and Gaussian16 software packages.21 For the structure optimization and energy calculations we utilized the generalized gradient approximated density functional PBE in an unrestricted manner in combination with the Grimme dispersion correction D3 with a Becke‐Johnson damping.22, 23, 24, 25 The Gibbs free energies at 298 K have been determined by considering next to the electronic energy, the zero‐point energy, the thermal correction and entropy contributions. An all electron correlation consistent valence double zeta basis set with augmented diffuse functions (aug‐cc‐pVDZ) serves for the description of the different elements.26 We performed also test calculations with the basis sets aug‐cc‐pVTZ and cc‐pVD/TZ. In order to take into account solvent effects we added a polarized continuum model (PCM) with the ϵ r value of water.27
In order to consider the role of different conformers, we have systematically calculated conformers for the quinone structures with different substitution pattern with fluoro‐, methoxy and hydroxyl groups. We have analyzed whether the substituents are oriented towards or away from the substituents. Comparing in this context for example the NQOH(1) conformer with the maximal number of intramolecular hydrogen bonds and the minimal number of hydrogen bonds (by rotating hydroxyl group in such a way that they are unable to form intramolecular hydrogen bonds), the difference in Gibbs energies between the conformers is about 270 meV. As a result and to minimize the computational effort, we considered in this study the lowest energy conformers with the maximal number of intramolecular hydrogen bonds possible.
The functional groups that cannot form hydrogen bonds or are too far away to form intramolecular hydrogen bonds prefer an orientation with the smallest steric hindrance. On the basis of the knowledge gained, the quinone structures were constructed according to several criteria: 1. The maximum number of hydrogen bonds was formed in the molecule. 2. The lowest amount of steric interaction of functional groups was considered for the molecules. 3. For molecules where hydrogen bonding to the substituent was not possible, the hydroxyl groups of the reduced molecules were oriented towards the substituents if this did not lead to steric hindrance. 4. For NQ derivatives, the hydrogen atoms of the hydroxyl‐groups point away from the second benzene ring, if no hydrogen bond can be formed. The sulfonic acid (pK a<0) is not protonated in our calculations. In our systematic screening procedure of substituent effects on the redox potential, a large variety of BQ, NQ and AQ derivatives with the substituents −Me, −OMe, −OH, −F, −CN, −SO3 − and −NO2 is included.
The reduction of quinone to hydroquinone and its derivatives has shown to be a two‐electron and two‐proton process at low pH‐values.1 Thus, we assumed in our calculations every reduction reaction to be a two‐electron two‐proton process in a single step reaction for a low pH‐value:
| (1) |
that leads to the formation of a reduced and protonated form of the quinones. The Gibbs free energy of reduction has been calculated in solution according to Equation (1) at 298 K. Therefore, the Gibbs free energy of the electron has been included by a value of 37 meV based on Fermi‐Dirac statistics and the solvation free energy of protons by a value of 11.531 eV.28 With the Gibbs free energy of reduction and a value of 4.28 V for E SHE (standard hydrogen reference electrode, SHE) the redox potential has been calculated using Equation (2):
| (2) |
The term redox potential instead of reduction potential is used because the value of the Gibbs free energy of reduction and oxidation are the same. Also, other values for the solvation free energy of the proton, the reference electrode or the Gibbs free energy of the electron have been reported in literature. However, the variation of these values just leads to a shift of the absolute redox potentials but does not influence the qualitative trends. The applied density functional can have in turn influence on the calculated redox potential. In order to estimate the accuracy of the PBE−D3 approach, we have performed selected calculations with the B3LYP functional in combination with dispersion correction D3 as well as with Møller–Plesset perturbation theory of second order (MP2).29 Furthermore, in cases for which experimental data are available, we compared our results with these, as seen in Figure 2.
Conflict of interest
The authors declare no conflict of interest.
Supporting information
As a service to our authors and readers, this journal provides supporting information supplied by the authors. Such materials are peer reviewed and may be re‐organized for online delivery, but are not copy‐edited or typeset. Technical support issues arising from supporting information (other than missing files) should be addressed to the authors.
Supplementary
Acknowledgements
The authors gratefully acknowledge the computing time granted by the high‐performance center of the Justus Liebig University in Giessen and Fuchs cluster at the Center for Scientific Computing of the Goethe University Frankfurt. Open access funding enabled and organized by Projekt DEAL.
S. Schwan, D. Schröder, H. A. Wegner, J. Janek, D. Mollenhauer, ChemSusChem 2020, 13, 5480.
References
- 1. Huskinson B., Marshak M. P., Suh C., Er S., Gerhardt M. R., Galvin C. J., Chen X., Aspuru-Guzik A., Gordon R. G., Aziz M. J., Nature 2014, 505, 195–198. [DOI] [PubMed] [Google Scholar]
- 2.
- 2a. Wei X., Pan W., Duan W., Hollas A., Yang Z., Li B., Nie Z., Liu J., Reed D., Wang W., Sprenkl V., ACS Energy Lett. 2017, 2, 2187–2204; [Google Scholar]
- 2b. Liu T., Wei X., Nie Z., Sprenkle V., Wang W., Adv. Energy Mater. 2016, 6; [Google Scholar]
- 2c. Schmidt D., Häupler B., Friebe C., Hager M. D., Schubert U. S., Polymer 2015, 68, 321–327; [Google Scholar]
- 2d. Duan W., Huang J., Kowalski J. A., Shkrob I. A., Vijayakumar M., Walter E., Pan B., Yang Z., Milshtein J. D., Li B., Liao C., Zhang Z., Wang W., Liu J., Moore J. S., Brushett F. R., Zhang L., Wei X., ACS Energy Lett. 2017, 2, 1156–1161; see the Supporting Information. [Google Scholar]
- 3. Lin K., Chen Q., Gerhardt M. R., Tong L., Kim S. B., Eisenach L., Valle A. W., Hardee D., Gordon R. G., Aziz M. J., Marshak M. P., Science 2015, 349, 1529; see the Supporting Information. [DOI] [PubMed] [Google Scholar]
- 4. Yang B., Hoober-Burkhardt L., Krishnamoorthy S., Murali A., Prakash G. K. S., Narayanan S. R., J. Electrochem. Soc. 2016, 163, A1442–A1449. [Google Scholar]
- 5. Bachman J. E., Curtiss L. A., Assary R. S., J. Phys. Chem. A. 2014, 118, 8852–8860. [DOI] [PubMed] [Google Scholar]
- 6. Assary R. S., Brushett F. R., Curtiss L. A., RSC Adv. 2014, 4, 57442–57451. [Google Scholar]
- 7. Er S., Suh C., Marshak M. P., Aspuru-Guzik A., Chem. Sci. 2015, 6, 885–893. [DOI] [PMC free article] [PubMed] [Google Scholar]
- 8. Cheng L., Assary R. S., Qu X., Jain A., Ong S. P., Rajput N. N., Persson K., Curtis L. A., J. Phys. Chem. Lett. 2015, 6, 283–291. [DOI] [PubMed] [Google Scholar]
- 9. Ding Y., Li Y., Yu G., Chem 2016, 1, 790–801. [Google Scholar]
- 10. Huynh M. T., Anson C. W., Cavell A. C., Stahl S. S., Hammes-Schiffer S., J. Am. Chem. Soc. 2016, 138, 15903–15910. [DOI] [PMC free article] [PubMed] [Google Scholar]
- 11. Guo C., Wang W., Feng W., Li P., RSC Adv. 2017, 7, 12775. [Google Scholar]
- 12. Tabor D. P., Gomez-Bombarelli R., Tong L., Gordon R. G., Aziz M. J., Aspuru Guzik A., J. Mater. Chem. A 2019, 7, 12833–12841. [Google Scholar]
- 13. Wedege K., Drazevic E., Konya D., Bentien A., Sci. Rep. 2016, 6, 39101. [DOI] [PMC free article] [PubMed] [Google Scholar]
- 14. Hofmann J. D., Pfannschilling F. L., Krawczyk N., Geigle P., Hong L., Schmalisch S., Wegner H. A., Mollenhauer D., Janek J., Schröder D., Chem. Mater, 2018, 30, 3, 762–774. [Google Scholar]
- 15. Hofmann J. D., Schmalisch S., Schwan S., Hong L., Wegner H. A., Mollenhauer D., Janek J., Schröder D., Chem. Mater. 2020, 32, 3427–3438. [Google Scholar]
- 16. Conant J. B., Fieser L. F., J. Am. Chem. Soc. 1924, 46, 1858–1881. [Google Scholar]
- 17. Revenga J., Rodríguez F., Tijero J., J. Electrochem. Soc. 1994,141, 330–333. [Google Scholar]
- 18. Kim H., Goodson T., Zimmermann P. M., J. Phys. Chem. C 2016, 120, 22235–22247. [Google Scholar]
- 19. Zhigalko M. V., Shishkin O. V., Grob L., Leszczynski J., J. Mol. Struct., 2004, 693, 153–159. [Google Scholar]
- 20. Hofmann J. D., Schröder D., Chem. Ing. Tech., 2019, 91, 786–794. [Google Scholar]
- 21.
- 21a.Gaussian 09, Revision A.02, M. J. Frisch, G. W. Trucks, H. B. Schlegel, G. E. Scuseria, M. A. Robb, J. R. Cheeseman, G. Scalmani, V. Barone, G. A. Petersson, H. Nakatsuji, X. Li, M. Caricato, A. Marenich, J. Bloino, B. G. Janesko, R. Gomperts, B. Mennucci, H. P. Hratchian, J. V. Ortiz, A. F. Izmaylov, J. L. Sonnenberg, D. Williams-Young, F. Ding, F. Lipparini, F. Egidi, J. Goings, B. Peng, A. Petrone, T. Henderson, D. Ranasinghe, V. G. Zakrzewski, J. Gao, N. Rega, G. Zheng, W. Liang, M. Hada, M. Ehara, K. Toyota, R. Fukuda, J. Hasegawa, M. Ishida, T. Nakajima, Y. Honda, O. Kitao, H. Nakai, T. Vreven, K. Throssell, J. A. Montgomery, Jr., J. E. Peralta, F. Ogliaro, M. Bearpark, J. J. Heyd, E. Brothers, K. N. Kudin, V. N. Staroverov, T. Keith, R. Kobayashi, J. Normand, K. Raghavachari, A. Rendell, J. C. Burant, S. S. Iyengar, J. Tomasi, M. Cossi, J. M. Millam, M. Klene, C. Adamo, R. Cammi, J. W. Ochterski, R. L. Martin, K. Morokuma, O. Farkas, J. B. Foresman, D. J. Fox, Gaussian, Inc., Wallingford CT, 2016;
- 21b.Gaussian 16, Revision C.01, M. J. Frisch, G. W. Trucks, H. B. Schlegel, G. E. Scuseria, M. A. Robb, J. R. Cheeseman, G. Scalmani, V. Barone, G. A. Petersson, H. Nakatsuji, X. Li, M. Caricato, A. V. Marenich, J. Bloino, B. G. Janesko, R. Gomperts, B. Mennucci, H. P. Hratchian, J. V. Ortiz, A. F. Izmaylov, J. L. Sonnenberg, D. Williams-Young, F. Ding, F. Lipparini, F. Egidi, J. Goings, B. Peng, A. Petrone, T. Henderson, D. Ranasinghe, V. G. Zakrzewski, J. Gao, N. Rega, G. Zheng, W. Liang, M. Hada, M. Ehara, K. Toyota, R. Fukuda, J. Hasegawa, M. Ishida, T. Nakajima, Y. Honda, O. Kitao, H. Nakai, T. Vreven, K. Throssell, J. A. Montgomery, Jr., J. E. Peralta, F. Ogliaro, M. J. Bearpark, J. J. Heyd, E. N. Brothers, K. N. Kudin, V. N. Staroverov, T. A. Keith, R. Kobayashi, J. Normand, K. Raghavachari, A. P. Rendell, J. C. Burant, S. S. Iyengar, J. Tomasi, M. Cossi, J. M. Millam, M. Klene, C. Adamo, R. Cammi, J. W. Ochterski, R. L. Martin, K. Morokuma, O. Farkas, J. B. Foresman, D. J. Fox, Gaussian, Inc., Wallingford CT, 2016.
- 22. Becke A. D., Phys. Rev. A 1988, 38, 3098–3100. [DOI] [PubMed] [Google Scholar]
- 23. Perdew J. P., Yue W., Phys. Rev. B 1986, 33, 8800–8802. [DOI] [PubMed] [Google Scholar]
- 24. Grimme S., Antony J., Ehrlich S., Krieg H., J. Chem. Phys. 2010, 132. [DOI] [PubMed] [Google Scholar]
- 25. Grimme S., Ehrlich S., Goerigk L., J. Comp. Chem. 2011, 32. [DOI] [PubMed] [Google Scholar]
- 26. Kendall R. A., Dunning T. H., Harrison R. J., J. Chem. Phys. 1992, 96, 6796–6806. [Google Scholar]
- 27. Tomasi J., Mennucci B., Cammi R., Chem. Rev. 2005, 105, 2999–3093. [DOI] [PubMed] [Google Scholar]
- 28.J. Ho, M. L. Coote, C. J. Cramer, D. G. Truhlar in Organic Electrochemistry, 5. Ed. (Eds.: O. Hammerich, B. Speiser), CRC Press, Boca Raton, 2012, pp. 229–259.
- 29.
- 29a. Lee C., Yang W., Parr R. G., Physical Review B 1988, 37, 785–789; [DOI] [PubMed] [Google Scholar]
- 29b. Stephens P. J., Devlin F. J., Chabalowski C. F., Frisch M. J., J. Phys. Chem. 1994, 98, 11623–11627. [Google Scholar]
Associated Data
This section collects any data citations, data availability statements, or supplementary materials included in this article.
Supplementary Materials
As a service to our authors and readers, this journal provides supporting information supplied by the authors. Such materials are peer reviewed and may be re‐organized for online delivery, but are not copy‐edited or typeset. Technical support issues arising from supporting information (other than missing files) should be addressed to the authors.
Supplementary