

Abstract
Background and Aims
Glycogen storage disease (GSD) type 1a is an inborn error of metabolism caused by defective glucose‐6‐phosphatase catalytic subunit (G6PC) activity. Patients with GSD 1a exhibit severe hepatomegaly due to glycogen and triglyceride (TG) accumulation in the liver. We have shown that the activity of carbohydrate response element binding protein (ChREBP), a key regulator of glycolysis and de novo lipogenesis, is increased in GSD 1a. In the current study, we assessed the contribution of ChREBP to nonalcoholic fatty liver disease (NAFLD) development in a mouse model for hepatic GSD 1a.
Approach and Results
Liver‐specific G6pc–knockout (L‐G6pc −/−) mice were treated with adeno‐associated viruses (AAVs) 2 or 8 directed against short hairpin ChREBP to normalize hepatic ChREBP activity to levels observed in wild‐type mice receiving AAV8–scrambled short hairpin RNA (shSCR). Hepatic ChREBP knockdown markedly increased liver weight and hepatocyte size in L‐G6pc −/− mice. This was associated with hepatic accumulation of G6P, glycogen, and lipids, whereas the expression of glycolytic and lipogenic genes was reduced. Enzyme activities, flux measurements, hepatic metabolite analysis and very low density lipoprotein (VLDL)‐TG secretion assays revealed that hepatic ChREBP knockdown reduced downstream glycolysis and de novo lipogenesis but also strongly suppressed hepatic VLDL lipidation, hence promoting the storage of “old fat.” Interestingly, enhanced VLDL‐TG secretion in shSCR‐treated L‐G6pc −/− mice associated with a ChREBP‐dependent induction of the VLDL lipidation proteins microsomal TG transfer protein and transmembrane 6 superfamily member 2 (TM6SF2), the latter being confirmed by ChIP‐qPCR.
Conclusions
Attenuation of hepatic ChREBP induction in GSD 1a liver aggravates hepatomegaly because of further accumulation of glycogen and lipids as a result of reduced glycolysis and suppressed VLDL‐TG secretion. TM6SF2, critical for VLDL formation, was identified as a ChREBP target in mouse liver. Altogether, our data show that enhanced ChREBP activity limits NAFLD development in GSD 1a by balancing hepatic TG production and secretion.
Abbreviations
- AAV
adeno‐associated virus
- acetyl‐CoA
acetyl‐coenzyme A
- ALDO
aldolase
- APOB
apolipoprotein B
- ChIP
chromatin immunoprecipitation
- ChREBP
carbohydrate response element binding protein
- ENO
enolase
- ER
endoplasmic reticulum
- G6P
glucose‐6‐phosphate
- G6PC
glucose‐6‐phosphatase catalytic subunit
- GSD
glycogen storage disease
- H&E
hematoxylin and eosin
- HNF‐4α
hepatocyte nuclear factor 4 alpha
- L‐G6pc−/−
liver‐specific G6pc knockout
- L‐G6pc+/+
liver‐specificG6pc–sufficient
- MLX
Max‐like protein X
- MTTP
microsomal TG transfer protein
- NAFLD
nonalcoholic fatty liver disease
- NEFA
nonesterified fatty acid
- ORO
Oil Red O
- PPP
pentose phosphate pathway
- qPCR
real‐time quantitative PCR
- shChREBP
short hairpin ChREBP
- shRNA
short hairpin RNA
- shSCR
scrambled shRNA
- SLC37A4
G6P transporter gene
- TG
triglyceride
- TM6SF2
transmembrane 6 superfamily member 2
- VLDL
very low density lipoprotein
Glycogen storage disease (GSD) types 1a and 1b are rare, monogenetic disorders of carbohydrate metabolism. GSD 1a is caused by mutations in the glucose‐6‐phoshatase catalytic subunit gene (G6PC), whereas the glucose‐6‐phosphate (G6P) transporter gene (SLC37A4) is affected in GSD 1b.( 1 ) Impaired G6PC activity in hepatocytes, kidney cells, and enterocytes of patients with GSD 1a reduces endogenous glucose production, primarily contributing to fasting hypoglycemia. The intracellular accumulation of G6P, in turn, promotes glycogen synthesis, glycolysis, and de novo lipogenesis. As a consequence, patients with GSD 1a suffer from severe hepatomegaly and nonalcoholic fatty liver disease (NAFLD) and, strikingly, more than two‐thirds of the patients develop liver tumors as young adults.( 2 )
Carbohydrate response element binding protein (ChREBP; also known as MONDOB, MLXIPL, or WBSCR14) is the main glucose‐sensitive transcription factor in hepatocytes.( 3 , 4 , 5 ) ChREBP is activated in response to increased intracellular glucose metabolism, partly through glucose‐dependent O‐linked glycosylation and/or acetylation.( 6 , 7 , 8 ) In addition, nuclear localization of ChREBP is regulated by phosphorylation( 6 , 9 ) and its interaction with 14‐3‐3 proteins and importins.( 10 , 11 ) The glucose‐mediated activation of the canonical ChREBP isoform (ChREBPα) induces the expression of ChREBPβ, a transcriptionally highly active isoform, hence generating a potent feed‐forward loop.( 12 ) In hepatocytes, ChREBP targets genes encoding enzymes involved in glycolysis, the pentose phosphate pathway (PPP), and de novo lipogenesis, as well as very low density lipoprotein (VLDL) assembly.( 3 , 4 , 13 ) Thus, hepatic ChREBP allows for proper accommodation of glucose availability to its intracellular fates in metabolism, storage, and redistribution in the form of lipids.
Previous work from our groups and others has shown that G6P accumulation in the liver of GSD 1a and GSD 1b mouse models strongly promotes hepatic ChREBP activity.( 14 , 15 , 16 ) Moreover, we have shown that the induction of glycolytic and lipogenic genes in acute GSD 1b critically depends on hepatic ChREBP expression.( 14 ) It has been reported that hepatic ChREBP is also activated in mice with type 2 diabetes and that hepatic ChREBP knockdown in these animals protects against NAFLD.( 17 , 18 ) In light of the association between hepatic ChREBP activity and NAFLD and the link between NAFLD and advanced liver disease risk, in the current study, we evaluated the metabolic consequences of enhanced hepatic ChREBP activity in GSD 1a. For this purpose, we aimed to normalize hepatic ChREBP activity in a hepatocyte‐specific model for GSD 1a. Surprisingly, our data show that attenuation of hepatic ChREBP induction in GSD 1a liver aggravated hepatomegaly as a result of reduced downstream glycolysis and lower VLDL‐triglyceride (TG) secretion, indicating that enhanced ChREBP activity limits hepatomegaly and NAFLD development in GSD 1a.
Materials and Methods
Animals
All experimental procedures were approved by the Institutional Animal Care and Use Committee of the University of Groningen and are in line with the Guide for the Care and Use of Laboratory Animals. Male adult (13‐18 weeks) G6pc‐floxed Alb‐Cre–negative (B6.G6pc lox/lox) and G6pc‐floxed Alb‐Cre–positive (B6.G6pc lox/lox.SAcreERT2/w) mice( 19 ) on a C57BL/6J background were housed in a light‐controlled and temperature‐controlled facility (lights on from 7:00 am to 7:00 pm) and fed a standard laboratory chow diet (RMH‐B; Abdiets, Woerden, the Netherlands). They were infected with adeno‐associated virus (AAV) short hairpin RNAs (shRNAs) directed against ChREBP (AAV‐ChREBP) or a shRNA–scrambled (shSCR) control (AAV‐shSCR). AAV‐shSCR viruses (1 × 10¹² particles per mouse) administered by intravenous injection into the retro‐orbital plexus under isoflurane anesthesia. For a detailed description of the production, purification, and titration of the AAV2/8 viruses, see the Supporting Information. Twelve days after AAV‐shRNA administration, all mice received intraperitoneal injections of tamoxifen for 5 consecutive days to excise G6pc exon 3,( 19 ) hence generating liver‐specific G6pc–knockout (L‐G6pc −/−) mice and liver‐specific G6pc–sufficient (L‐G6pc +/+) wild‐type littermates. Nonfasted animals were either sacrificed for tissue collection or subjected to VLDL‐TG secretion experiments, starting at 8:00 am 10 days after the last tamoxifen injection. Animals were sacrificed by cardiac puncture under isoflurane anesthesia, and tissues were rapidly excised and stored.
Ex Vivo Lipolysis
Epididymal white adipose tissue was removed and stored on ice in Krebs buffer [12 mM 4‐(2‐hydroxyethyl)‐1‐piperazine ethanesulfonic acid, 4.9 mM KCl, 121 mM NaCl, 1.2 mM MgSO4, 0.33 mM CaCl2, 0.1% glucose, and 3.5% fatty acid free bovine serum albumin, pH 7.4] until further processing. Tissue samples were incubated in Krebs buffer (10% wt/vol) at 37°C. After 1, 2, 3, and 4 hours of incubation, independent samples were centrifuged at maximum speed, and supernatants were collected for glycerol analysis using a commercially available kit (Cayman Chemical, Ann Arbor, MI).
Histological and Pathological Analysis of the Liver
For microscopic examination, tissues were fixed in 4% (wt/vol) formaldehyde in phosphate‐buffered saline (PBS), embedded in paraffin, sectioned at 4 μm, and stained with hematoxylin and eosin (H&E) and periodic acid–Schiff. Liver steatosis was visualized by Oil Red O (ORO) staining of liver cryosections. Photomicrographs of five areas per section of liver were made at 200× magnification using the Olympus DP26 camera with Olympus cellSens Standard software (version 1.18; Olympus Life Science, Waltham, MA). To perform digital image analysis, an ImageJ (version 1.50; National Institutes of Health, Bethesda, MD) macro script was created to assess the extent of lipid staining (total area and lipid droplet size). Hepatic steatosis was assessed blindly and graded in H&E‐stained liver sections using an adapted version of the NAFLD activity scoring (NAS) system developed by Kleiner et al.( 20 )
Biochemical Assays
Blood glucose was measured using a One Touch Ultra glucose meter (LifeScan Inc., Milpitas, CA). Plasma insulin, glucagon, lactate, ketone bodies, free fatty acids, TGs, and cholesterol were analyzed using commercially available enzyme‐linked immunosorbent assay kits (Chrystal Chem, Elk Grove Village, IL; ALPCO Diagnostics, Salem, NH; Instruchemie, Delfzijl, the Netherlands; FUJIFILM Wako Chemicals, Richmond, VA; DiaSys, Waterbury, CT; and Roche, Basel, Switzerland, respectively). Hepatic glycogen and G6P content were determined as described.( 14 )
Hepatic Lipid, Acylcarnitine, and Metabolome Analysis
The procedures for quantification of lipid, acylcarnitine, and metabolome profiles in liver homogenates are described in the Supporting Information.
Glycolytic Enzyme Capacities
The maximum velocities (V max) of glyceraldehyde 3‐phosphate dehydrogenase, phosphoglucose isomerase, aldolases (ALDOs; in liver, mainly ALDO A and ALDO B), enolases (ENOs; in liver, mainly ENO 1 and ENO 3), and pyruvate kinase were determined ex vivo in liver homogenates as described in the Supporting Information.
Quantification of Acetyl‐Coenzyme a Precursor Pool Enrichments, De Novo Lipogenesis, Fatty Acid Elongation, and Cholesterol Synthesis
These procedures are described in the Supporting Information.
Gene Expression Analysis
These procedures are described in the Supporting Information.
Targeted Proteomics
These procedures are described in the Supporting Information.
In Silico Predictions
These procedures are described in the Supporting Information.
Chromatin Immunoprecipitation–Real‐Time Quantitative PCR on the Mouse Transmembrane 6 Superfamily Member 2 Promoter
To acutely induce hepatic GSD 1b, male C57BL/6J mice were equipped with a permanent catheter in the right jugular vein for infusions and were allowed a recovery period of at least 4 days. Animals were kept in experimental cages during the experiment and the preceding fasting period, allowing frequent collection of tail blood samples. After overnight fasting, mice were infused for 6 hours with S4048 (a generous gift from Sanofi‐Aventis, Frankfurt, Germany; 5.5 mg/mL PBS with 6% dimethyl sulfoxide at 0.135 mL/hour) or vehicle. After 6 hours, mice were sacrificed by cardiac puncture. For fasting/feeding studies, male C57BL/6J mice were sacrificed by cardiac puncture (8:00 am) in either a fed or a 9‐hour‐fasted (11:00 pm‐8:00 am) state. Livers from S4048 or vehicle‐treated mice, as well as fasted/fed mice, were harvested for chromatin immunoprecipitation (ChIP)–real‐time quantitative PCR (qPCR) analysis that was performed as described in the Supporting Information.
VLDL‐TG Secretion Rates and Nascent VLDL Analysis
Mice were injected intraperitoneally with Poloxamer 407 (1 g/kg body weight). Blood samples (50 μL) were drawn under isoflurane anesthesia by retro‐orbital bleeding into heparinized tubes at 0, 30, 60, 120, and 240 minutes after injection. After sampling, the bleeding was immediately stopped on slight compression with sterile gauze to minimize additional blood loss. Plasma was isolated by centrifugation, after which TG levels and TG secretion rates were determined as described.( 4 ) For isolation and analysis of nascent VLDL, see the Supporting Information.
Cell Reporter Assays
These procedures are described in the Supporting Information.
Statistics
Data in figures are presented as box‐and‐whisker plots indicating the sample minimum, lower quartile, median, upper quartile, and sample maximum, or in some cases, data are presented as the mean ± standard error of the mean. Data in heat maps represent z score–normalized values. Statistical analysis was performed using BrightStat software (www.Brightstat.com). Differences between two or multiple groups were tested by Mann‐Whitney U test or Kruskal‐Wallis H test followed by post hoc Conover pairwise comparisons, respectively. P values <0.001, 0.001‐0.01, and 0.01‐0.05 were considered significant.
Results
Hepatic ChREBP Knockdown Reduces Downstream Glycolysis and Increases Hepatic G6P and Glycogen Storage in L‐G6pc −/− Mice
To evaluate the consequences of normalized hepatic ChREBP activity in L‐G6pc −/− mice, we administered an shRNA against ChREBPα/β or an shSCR to L‐G6pc +/+ and L‐G6pc −/− mice by means of AAV delivery. Hepatic Chrebpα mRNA levels remained unaffected on shRNA administration in L‐G6pc +/+ mice but were reduced by ~40% in L‐G6pc −/− mice (Fig. 1A). The hepatic mRNA expression levels of Chrebpβ, the key marker of ChREBP activity,( 12 , 21 ) were similarly (~40%) reduced in in L‐G6pc +/+ and L‐G6pc −/− mice, hence normalizing its expression in L‐G6pc −/− mice to the levels observed in L‐G6pc +/+ controls receiving shSCR (Fig. 1A). Hepatic G6PC protein abundance was strongly reduced in L‐G6pc −/− mice receiving either of the two shRNAs (Fig. 1A). ChREBPα/β protein abundance was reduced by about 50% in short hairpin ChREBP (shChREBP) as compared with shSCR‐treated mice of either genotype (Fig. 1A). Consistent with reduced hepatic ChREBP activity, the mRNA expression (Fig. 1B; upper panel) and enzymatic activities (Fig. 1C) of the established glycolytic ChREBP targets,( 3 , 4 , 5 , 22 ) G6P isomerase (Gpi), aldolase B (Aldob) and liver‐type pyruvate kinase (Pklr), were normalized by shChREBP in L‐G6pc −/− mice. These reductions in glycolytic enzyme activities were paralleled by a more pronounced accumulation of the glycolytic intermediates G6P, fructose‐6/1‐phosphate, and fructose‐1,6‐bisphosphate in the liver of shChREBP versus shSCR‐treated L‐G6pc −/− mice, whereas there was no significant accumulation of hepatic triose phosphates (dihydroxyacetone phosphate/glyceraldehyde 3‐phosphate), phosphoenolpyruvate, pyruvate, or lactate between these groups (Fig. 1D; upper panel). On the contrary, hepatic ChREBP knockdown did further increase hepatic 6‐phosphogluconolactone, gluconate‐6P, xylulose‐5‐phosphate, and sedoheptulose‐7P content in L‐G6pc −/− mice, showing that shChREBP also resulted in more pronounced accumulation of oxidative PPP intermediates as compared with shSCR‐treated mice, whereas ribose‐5‐phosphate/ribulose‐5‐phosphate, ribose‐1,5‐disphosphate, and 2‐dehydrogluconate‐6‐phosphate were not affected (Fig. 1D; lower panel). Moreover, we observed that ChREBP knockdown increased relative and total hepatic glycogen contents in L‐G6pc −/− versus L‐G6pc +/+ mice (Fig. 1E). Body weight and food intake were similar in all groups (Table 1). Liver weight was significantly increased in shChREBP‐treated versus shSCR‐treated L‐G6pc +/+ and L‐G6pc −/− mice, although hepatic water content was reduced on ChREBP knockdown in both genotypes, and hepatic protein content was specifically reduced in shChREBP‐treated L‐G6pc −/− mice as compared with shSCR‐treated mice with the same genotype (Table 1). Plasma alanine aminotransferase and aspartate aminotransferase levels were elevated in shSCR‐treated L‐G6pc −/− mice as compared with L‐G6pc +/+ mice and further increased on hepatic ChREBP knockdown in L‐G6pc −/− mice (Table 1). Blood glucose and plasma insulin concentrations were reduced in shChREBP‐treated L‐G6pc −/− mice, whereas plasma lactate concentrations were not affected by hepatic G6pc deficiency and/or ChREBP knockdown (Table 1).
FIG. 1.
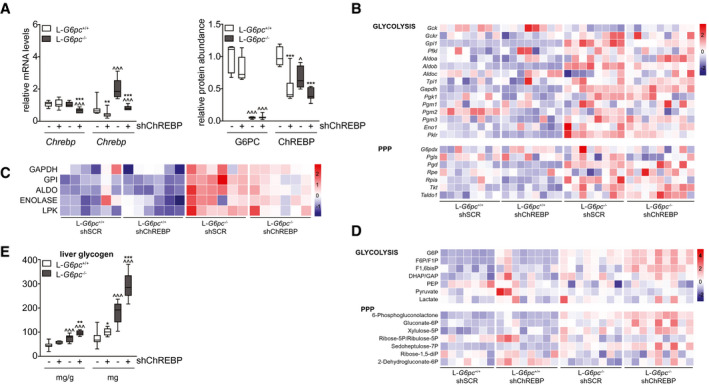
Hepatic ChREBP knockdown reduces downstream enzymes of glycolysis and increases hepatic G6P and glycogen storage in L‐G6pc −/− mice. (A) Box‐and‐whisker plots presenting relative hepatic mRNA levels of Chrebpα and Chrebpβ and relative protein abundance of G6PC and ChREBP in L‐G6pc +/+ and L‐G6pc −/− mice treated with either shChREBP or shSCR (n = 7‐9). (B) Heat maps presenting z score–normalized mRNA expression levels of hepatic glycolysis and PPP enzymes in L‐G6pc +/+ and L‐G6pc −/− mice treated with shChREBP or shSCR (n = 8‐9). (C) Heat maps presenting z score–normalized hepatic activities of glycolytic enzymes in L‐G6pc +/+ and L‐G6pc −/− mice treated with shChREBP or shSCR (n = 6). (D) Heat maps presenting z score–normalized hepatic levels of glycolytic and PPP intermediates in L‐G6pc +/+ and L‐G6pc −/− mice treated with shChREBP or shSCR (n = 7‐9). (E) Box‐and‐whisker plots presenting relative and absolute hepatic glycogen content in L‐G6pc +/+ and L‐G6pc −/− mice treated with shChREBP or shSCR (n = 7‐9). *P < 0.05, **P < 0.01, ***P < 0.001 indicates significance compared with shSCR. ^P < 0.05, ^^^P < 0.001 indicates significance compared with L‐G6pc +/+ mice. Supporting Table S2A‐C contains raw values and statistics for data presented in heat maps. Abbreviations: Aldoa, aldolase, fructose‐bisphosphate A gene; Aldob, aldolase, fructose‐bisphosphate B gene; ChREBP, carbohydrate response element binding protein; Eno1, enolase 1 gene; G6P, glucose‐6‐phosphate; G6pdx, G6P dehydrogenase X gene; Gapdh, glyceraldehyde‐3‐phosphate dehydrogenase gene; Gck, glucokinase gene; Gckr, glucokinase regulator gene; Gpi1, G6P isomerase 1 gene; L‐G6pc −/−, liver‐specific glucose‐6‐phosphatase catalytic subunit knockout; L‐G6pc +/+, liver‐specific glucose‐6‐phosphatase catalytic subunit–sufficient; Pfkl, phosphofructokinase, liver type gene; Pgd, phosphogluconate dehydrogenase gene; Pgk1, phosphoglycerate kinase 1 gene; Pgls, 6‐phosphogluconolactonase gene; Pgm1, phosphoglucomutase 1 gene; Pgm2, phosphoglucomutase 2 gene; Pgm3, phosphoglucomutase 3 gene; Pklr, pyruvate kinase L/R gene; PPP, pentose phosphate pathway; Rpe, ribulose‐5‐phosphate‐3‐epimerase gene; Rpia, ribose 5‐phosphate isomerase A gene; shChREBP, short hairpin ChREBP; shRNA, short hairpin RNA; shSCR, scrambled shRNA; Taldo1, transaldolase 1 gene; Tkt, transketolase gene; Tpi1, triosephosphate isomerase 1 gene.
TABLE 1.
General Characteristics and Plasma Metabolic Parameters in L‐G6pc +/+ and L ‐G6pc −/− Mice Treated With Either shChREBP or shSCR
| L‐G6pc +/+ | L‐G6pc +/+ | L‐G6pc −/− | L‐G6pc −/− | |
|---|---|---|---|---|
| shSCR | shChREBP | shSCR | shChREBP | |
| Body weight (g) | 30.0 (28.7‐35.2) | 29.6 (28.5‐31.4) | 30.9 (28.2‐34.0) | 31.3 (28.5‐34.9) |
| Food intake (g/day) | 3.8 (2.8‐4.8) | 4.3 (3.1‐5.2) | 4.3 (3.2‐6.0) | 4.6 (3.7‐5.6) |
| Liver weight (g) | 1.6 (1.4‐2.0) | 1.7 (1.6‐1.9)* | 2.4 (1.5‐2.5) † | 2.9 (2.7‐3.5)*, † |
| Hepatic protein (mg/g) | 138 (113‐172) | 136 (130‐142) | 127 (120‐141) | 112.9 (105.5‐125.7)*, † |
| Hepatic water (%) | 68.7 (67.3‐71.6) | 67.5 (65.8‐69.8) || | 67.2 (65.4‐69.1) † | 64.9 (62.5‐65.2)*, ‡ |
| Blood glucose (mmol/L) | 9.2 (7.6‐10.0) | 9.4 (8.1‐10.5) | 8.4 (5.2‐10.7) | 6.0 (5.6‐8.7) § |
| Plasma insulin (ng/mL) | 0.4 (0.2‐1.1) | 0.3 (0.2‐0.5) | 0.4 (0.2‐1.1) | 0.2 (0.1‐0.3) || |
| Plasma lactate (mmol/L) | 4.4 (4.2‐5.2) | 4.8 (3.3‐5.6) | 6.0 (4.6‐7.2) † | 6.2 (5.3‐7.5) † |
| Plasma ketones (mmol/L) | 0.2 (0.1‐0.2) | 0.1 (0.1‐0.2) | 0.2 (0.1‐0.3) | 0.2 (0.1‐0.3) |
| Plasma NEFA (μmol/L) | 150 (106‐168) | 145 (101‐190) | 247 (141‐457) † | 306 (205‐359) † |
| Plasma TG (mmol/L) | 1.2 (1.0‐1.5) | 0.7 (0.5‐0.9) § | 4.3 (1.7‐5.3) † | 1.9 (0.2‐3.3)*, † |
| Plasma ALT (U/L) | 6 (1‐10) | 3 (1‐20) | 14 (7‐25) ¶ | 58 (20‐161) † , § |
| Plasma AST (U/L) | 25 (19‐34) | 24.(15‐37) | 29 (23‐48) | 46 (28‐89) † , || |
Data represent median values (range).
P < 0.001, indicates significance compared with shSCR.
P < 0.001, indicates significance compared with L‐G6pc +/+ littermates.
P < 0.05, indicates significance compared with L‐G6pc +/+ littermates.
P < 0.01, indicates significance compared with shSCR.
P < 0.05, indicates significance compared with shSCR.
P < 0.01, indicates significance compared with L‐G6pc +/+ littermates.
Abbreviations: ALT, alanine aminotransferase; AST, aspartate aminotransferase; L‐G6pc −/−, liver‐specific glucose‐6‐phosphatase catalytic subunit gene knockout; L‐G6pc +/+, glucose‐6‐phosphatase catalytic subunit gene–sufficient; NEFA, nonesterified fatty acid; shChREBP, short hairpin carbohydrate response element binding protein; shSCR, scrambled short hairpin RNA; TG, triglyceride.
Hepatic ChREBP Knockdown Promotes Hepatic Lipid Storage But Reduces Fractional De Novo Lipogenesis in L‐G6pc −/− Mice
H&E staining of the livers showed that hepatic ChREBP knockdown resulted in marked hepatocyte vacuolation in both L‐G6pc −/− and L‐G6pc +/+ mice (Fig. 2A). Besides glycogen accumulation, cytoplasmic vacuolation can result from excess lipid storage. ORO staining for neutral lipids indeed showed increased deposition of neutral lipids in shChREBP‐treated versus shSCR‐treated groups of both genotypes (Fig. 2A). Quantification of the lipid droplet size showed that the droplets in shChREBP‐treated groups were enlarged (Fig. 2A). Accordingly, the NAS system( 20 ) indicated that hepatic ChREBP knockdown induced fatty liver disease in L‐G6pc +/+ mice, whereas it aggravated the existing fatty liver in L‐G6pc −/− mice (Fig. 2B). Biochemical analysis of the hepatic lipids revealed that hepatic ChREBP knockdown resulted in substantial increases in the contents and total amounts of hepatic TGs and cholesteryl esters (Fig. 2B), whereas total hepatic free cholesterol and phospholipid content were similarly increased in shSCR‐treated and shChREBP‐treated L‐G6pc −/− mice as compared with their wild‐type controls (Supporting Fig. S1A). As expected, hepatic ChREBP knockdown reduced the mRNA expression of hepatic fatty acid synthesis genes as well as that of acylCoA:diacylglycerol acetyltransferase genes 1 and 2 (Fig. 2C), hence normalizing their expression levels in L‐G6pc −/− mice to values observed in shSCR‐treated L‐G6pc +/+ mice. On the other hand, neither hepatic G6PC deficiency nor ChREBP knockdown consistently altered the mRNA levels of the other TG synthesis enzymes (Fig. 2C). 13C‐labeled acetate was administered to quantify de novo lipogenesis and fatty acid elongation.( 23 ) Fractional acetyl‐coenzyme A (acetyl‐CoA) pool enrichments, determined from 13C‐incorporation in hepatic palmitate (C16:0) and palmitoleate (C16:1), were reduced in both groups of L‐G6pc −/− mice as well as in shChREBP‐treated L‐G6pc +/+ mice (Fig. 2D), indicating changes in acetyl‐CoA pool turnover under these conditions. Moreover, subsequent quantification of lipogenic fluxes revealed that hepatic ChREBP knockdown reduced fractional de novo lipogenesis in both L‐G6pc +/+ and L‐G6pc −/− mice, with the largest effects seen on de novo oleate (C18:1) synthesis (Fig. 2E). On the other hand, elongation of preexisting palmitate was exclusively reduced by shChREBP treatment of L‐G6pc +/+ mice (Fig. 2E). Interestingly, despite these reductions in fractional lipogenesis, absolute rates of de novo lipogenesis and chain elongation were slightly increased in shChREBP‐treated L‐G6pc −/− mice as compared with shSCR‐treated controls (Fig. 2F). However, in quantitative terms, these increases were marginal as compared with the storage of preexisting fatty acids, referred to as “old fat,” which was markedly increased on hepatic ChREBP knockdown in both genotypes (Fig. 2F, Table 2).
FIG. 2.
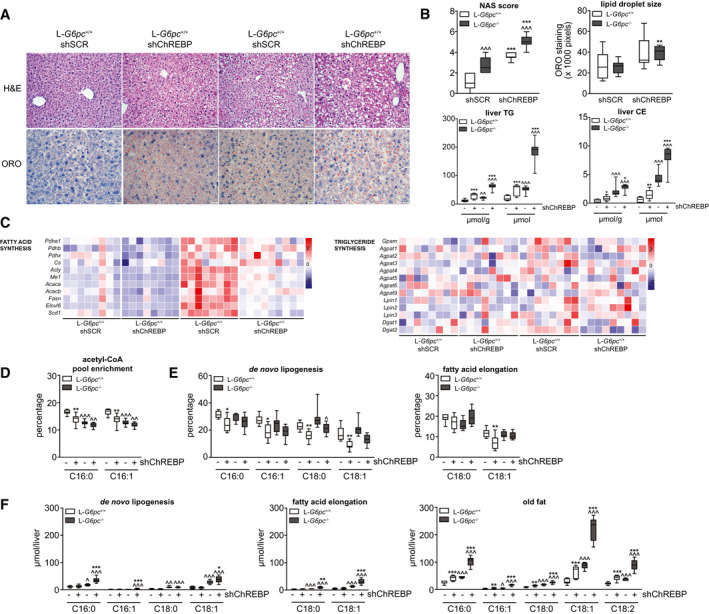
Hepatic ChREBP knockdown promotes hepatic lipid storage but reduces fractional de novo lipogenesis in L‐G6pc −/− mice. (A) Representative photos of H&E and ORO staining in L‐G6pc +/+ and L‐G6pc −/− mice treated with either shChREBP or shSCR. (B) Box‐and‐whisker plots presenting hepatic NASs, hepatic lipid droplet sizes, and relative and absolute hepatic TG and CE contents in L‐G6pc +/+ and L‐G6pc −/− mice treated with shChREBP or shSCR (n = 6‐9). (C) Heat maps presenting z score–normalized mRNA expression levels of hepatic fatty acid synthesis and TG synthesis enzymes in L‐G6pc +/+ and L‐G6pc −/− mice treated with shChREBP or shSCR (n = 8‐9). (D) Box‐and‐whisker plots presenting fractional acetyl‐CoA pool 13C‐enrichments in L‐G6pc +/+ and L‐G6pc −/− mice treated with shChREBP or shSCR (n = 7‐9). (E) Box‐and‐whisker plots presenting fractional hepatic de novo lipogenesis and fatty acid elongation of preexisting palmitate in L‐G6pc +/+ and L‐G6pc −/− mice treated with shChREBP or shSCR (n = 7‐9). (F) Box‐and‐whisker plots presenting absolute fatty acid synthesis from de novo lipogenesis, chain elongation, and the content of old fat in L‐G6pc +/+ and L‐G6pc −/− mice treated with shChREBP or shSCR (n = 7‐9). *P < 0.05, **P < 0.01, ***P < 0.001 indicates significance compared with shSCR. ^P < 0.05, ^^P < 0.01, ^^^P < 0.001 indicates significance compared with L‐G6pc +/+ mice. Supporting Table S2A contains raw values and statistics for data presented in heat maps. Abbreviations: acetyl‐CoA, acetyl‐coenzyme A; CE, cholesteryl ester; ChREBP, carbohydrate response element binding protein; H&E, hematoxylin and eosin; L‐G6pc −/−, liver‐specific glucose‐6‐phosphatase catalytic subunit knockout; L‐G6pc +/+, liver‐specific glucose‐6‐phosphatase catalytic subunit–sufficient; NAS, nonalcoholic fatty liver disease activity scoring; ORO, Oil Red O; shChREBP, short hairpin ChREBP; shRNA, short hairpin RNA; shSCR, scrambled shRNA; TG, triglyceride.
TABLE 2.
Hepatic Fatty Acid Profile in L‐G6pc +/+ and L ‐G6pc −/− Mice Treated With Either shChREBP or shSCR
| Liver (nmol/g) | L‐G6pc +/+ | L‐G6pc +/+ | L‐G6pc −/− | L‐G6pc −/− |
|---|---|---|---|---|
| shSCR | shChREBP | shSCR | shChREBP | |
| C14:0 | 0.4 (0.2‐0.5) | 0.7 (0.4‐0.8)* | 0.6 (0.5‐0.7) † | 1.3 (1.0‐1.4)*, † |
| C16:1 | 2.5 (1.5‐4.7) | 4.0 (1.5‐5.7) | 2.8 (2.3‐3.6) | 6.7 (4.9‐8.1)*, † |
| C16:0 | 23.3 (15.4‐29.8) | 34.1 (23.8‐38.0)* | 25.8 (19.4‐29.2) | 47.0 (36.4‐53.0)*, † |
| C18:3ω6 | 0.1 (0.1‐0.2) | 0.3 (0.2‐0.4)* | 0.2 (0.1‐0.2) | 0.4 (0.3‐1.0)* |
| C18:2ω6 | 14.7 (10.1‐16.1) | 25.3 (15.3‐29.8)* | 16.4 (12.5‐18.5) | 30.7 (21.6‐38.3)* |
| C18:3ω3 | 0.4 (0.3‐0.5) | 0.9 (0.5‐1.2)* | 0.5 (0.3‐0.7) | 1.3 (0.9‐1.6)*, ‡ |
| C18:1ω9 | 24.7 (11.6‐33.8) | 45.2 (21.8‐49.4)* | 46.4 (35.9‐63.0) † | 89.8 (64.2‐111.0)*, † |
| C18:1ω7 | 4.1 (2.2‐6.6) | 5.5 (2.8‐7.2) | 5.7 (4.6‐6.2) § | 9.3 (7.8‐11.6)*, † |
| C18:0 | 10.2 (6.5‐12.5) | 13.1 (9.5‐13.9) || | 13.7 (12.2‐15.0) † | 14.6 (11.8‐16.4) † |
| C20:4ω6 | 9.8 (5.7‐10.3) | 10.6 (8.8‐12.0) | 9.3 (8.4‐11.1) | 9.2 (7.9‐10.7) |
| C20:5ω3 | 0.3 (0.2‐0.3) | 0.4 (0.3‐0.5) || | 0.2 (0.2‐0.4) | 0.4 (0.3‐0.6)* |
| C20:3ω9 | 0.3 (0.1‐0.5) | 0.4 (0.2‐0.6) | 0.9 (0.5 ‐1.1) † | 0.9 (0.7‐1.1) † |
| C20:3ω6 | 1.1 (0.6‐1.5) | 1.4 (1.0‐1.7) | 1.6 (1.3‐2.0) † | 2.2 (1.7‐2.5) † , ¶ |
| C20:2ω6 | 0.2 (0.2‐0.3) | 0.5 (0.3‐0.5)* | 0.3 (0.2‐0.5) ‡ | 0.7 (0.4‐0.9)*, ‡ |
| C20:1ω9 | 0.4 (0.2‐0.6) | 0.9 (0.5‐1.2)* | 0.9 (0.7‐1.5) † | 1.9 (1.4‐2.7)*, † |
| C20:0 | 0.1 (0.1‐0.2) | 0.2 (0.1‐0.4)* | 0.1 (0.1‐0.1) | 0.2 90.1‐0.4)* |
| C22:5ω6 | 0.2 (0.1‐0.2) | 0.4 (0.2‐0.5)* | 0.4 (0.2‐0.8) † | 0.6 (0.3‐0.8) § , || |
| C22:6ω3 | 4.3 (2.3‐5.1) | 6.2 (3.9‐7.0)* | 5.3 (3.8‐5.9) | 5.9 (4.3‐7.6) |
| C22:4ω6 | 0.2 (0.1‐0.3) | 0.5 (0.3‐0.6)* | 0.3 (0.2‐0.5) § | 0.7 (0.5‐0.9)*, † |
| C22:5ω3 | 0.3 (0.1‐0.4) | 0.6 (0.4‐1.0)* | 0.3 (0.2‐0.4) | 1.1 (0.7‐1.3)*, † |
| C22:0 | 0.3 (0.2‐0.3) | 0.3 (0.2‐0.4) | 0.3 (0.2‐0.3) | 0.3 (0.2‐0.6) |
| C24:1ω9 | 0.4 (0.2‐0.4) | 0.4 (0.4‐0.5) ¶ | 0.4 (0.4‐0.5) ‡ | 0.4 (0.3‐0.5) § , ¶ |
| C24:0 | 0.3 (0.2‐0.3) | 0.3 (0.3‐0.4) ¶ | 0.2 (0.2‐0.3) § | 0.3 (0.3‐0.3) ‡ , ¶ |
Data represent median values (range).
P < 0.001, indicates significance compared with shSCR.
P < 0.001, indicates significance compared with L‐G6pc +/+ littermates.
P < 0.01, indicates significance compared with L‐G6pc +/+ littermates.
P < 0.05, indicates significance compared with L‐G6pc +/+ littermates.
P < 0.05, indicates significance compared with shSCR.
P < 0.01, indicates significance compared with shSCR.
Abbreviations: L‐G6pc −/−, liver‐specific glucose‐6‐phosphatase catalytic subunit gene knockout; L‐G6pc +/+, liver‐specific glucose‐6‐phosphatase catalytic subunit gene–sufficient; shChREBP, short hairpin carbohydrate response element binding protein; shSCR, scrambled short hairpin RNA.
Hepatic ChREBP Knockdown Strongly Suppresses Hepatic VLDL‐TG Secretion by Reducing VLDL‐TG Lipidation
To establish the origin of the old fat accumulating on hepatic ChREBP knockdown, we analyzed fatty acid oxidation, adipose tissue lipolysis, and hepatic VLDL‐TG secretion pathways. We observed that hepatic C2‐acylcarnitine content was increased, whereas lauroleate (C12:1)–acylcarnitine, palmitoleate (C16:1)–acylcarnitine and oleate (C18:1)–acylcarnitine were reduced in the livers of shChREBP‐treated versus shSCR‐treated L‐G6pc −/− mice, suggesting increased fatty acid oxidation on hepatic ChREBP knockdown in L‐G6pc −/− mice (Table 3). Plasma ketone body concentrations were, however, not affected by hepatic G6PC deficiency and/or ChREBP knockdown (Table 1). Quantification of adipose tissue lipolysis ex vivo revealed no differences as a consequence of hepatic G6pc deficiency and/or ChREBP knockdown (Supporting Fig. S2A), whereas circulating nonesterified fatty acid (NEFA) levels were increased in shSCR‐treated and shChREBP‐treated L‐G6pc −/− mice versus their wild‐type controls (Table 1). Interestingly, total plasma TG levels (Table 1) and VLDL‐TG levels (Fig. 3A) were elevated in shSCR‐treated L‐G6pc −/− mice as compared with L‐G6pc +/+ mice but were reduced on hepatic ChREBP knockdown in mice of both genotypes. In parallel, we observed a marked reduction of VLDL‐TG secretion rates (Fig. 3B) on hepatic ChREBP knockdown, both in L‐G6pc +/+ and L‐G6pc −/− mice. Moreover, the nascent VLDL particles of shChREBP‐treated mice contained fewer TGs, resulting in a marked decrease in VLDL particle volume (Fig. 3C). The smaller VLDL particle volume on hepatic ChREBP knockdown was confirmed by western blot analysis showing reductions in the TG/apolipoprotein B (APOB) ratio on shChREBP treatment, which was strongest in L‐G6pc −/− mice (Fig. 3C and Supporting Fig. S2B).
TABLE 3.
Hepatic Acylcarnitine Profile in L‐G6pc +/+ and L‐G6pc −/− Mice Treated With Either shChREBP or shSCR
| Liver (nmol/g) | L‐G6pc +/+ | L‐G6pc +/+ | L‐G6pc −/− | L‐G6pc −/− |
|---|---|---|---|---|
| shSCR | shChREBP | shSCR | shChREBP | |
| Free carnitine | 209 (163‐324) | 241 (172‐289) | 245 (175‐331) | 255 (184‐289) |
| C2 | 35 (12‐79) | 43 (24‐79) | 36 (7‐74) | 91 (29‐122)*, † |
| C3 | 1.1 (0.7‐1.9) | 1.7 (0.5‐3.3) | 0.5 (0.2‐0.8) ‡ | 0.4 (0.0‐0.9) ‡ |
| C4 | 0.07 (0.07‐0.33) | 0.07 (0.00‐0.13) | 0.37 (0.07‐1.33) ‡ | 0.20 (0.07‐0.40) ‡ |
| C5 | 0.13 (0.13‐0.20) | 0.23 (0.07 ‐0.33) | 0.23 (0.13‐0.40)* | 0.33 (0.13‐0.80) |
| C8 | 0.13 (0.07‐0.13) | 0.13 (0.07‐0.13) | 0.13 (0.07‐0.13) | 0.13 (0.07‐0.13) |
| C10 | 0.00 (0.00‐0.07) | 0.07 (0.00‐0.07) | 0.07 (0.00‐0.07) | 0.07 (0.00‐0.07) |
| C12:1 | 0.20 (0.07‐0.33) | 0.13 (0.13‐0.20) | 0.17 (0.13‐0.20) | 0.07 (0.07‐0.13) § , || |
| C16:1 | 0.07 (0.00‐0.07) | 0.07 (0.00‐0.07) | 0.07 (0.00‐0.07) | 0.00 (0.00‐0.07) † |
| C16:0 | 0.07 (0.07‐0.20) | 0.07 (0.00‐0.13) | 0.07 (0.07‐0.07) | 0.07 (0.00‐0.07) |
| C18:2 | 0.07 (0.07‐0.13) | 0.07 (0.07‐0.13) | 0.07 (0.00‐0.07) | 0.07 (0.00‐0.07) |
| C18:1 | 0.20 (0.07‐0.33) | 0.17 (0.07‐0.33) | 0.13 (0.07‐0.33) | 0.07 (0.07‐0.13) § , || |
| C18:0 | 0.07 (0.07‐0.13) | 0.07 (0.07‐0.13) | 0.07 (0.07‐0.07) | 0.07 (0.00‐0.07) |
Data represent median values (range).
P < 0.05, indicates significance compared with L‐G6pc +/+ littermates.
P < 0.05, indicates significance compared with shSCR.
P < 0.001, indicates significance compared with L‐G6pc +/+ littermates.
P < 0.01, indicates significance compared with L‐G6pc +/+ littermates.
P < 0.01, indicates significance compared with shSCR.
Abbreviations: L‐G6pc −/−, liver‐specific glucose‐6‐phosphatase catalytic subunit gene knockout; L‐G6pc +/+, liver‐specific glucose‐6‐phosphatase catalytic subunit gene–sufficient; shChREBP, short hairpin carbohydrate response element binding protein; shSCR, scrambled short hairpin RNA.
FIG. 3.
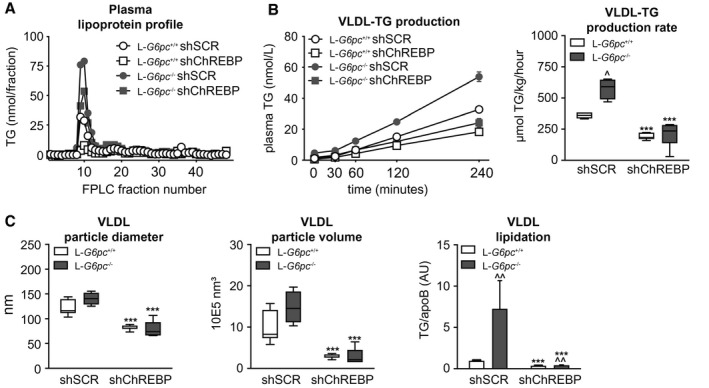
Hepatic ChREBP knockdown strongly suppresses hepatic VLDL‐TG secretion by reducing VLDL‐TG lipidation. (A) Plasma lipoprotein profiles in L‐G6pc +/+ and L‐G6pc −/− mice treated with either shChREBP or shSCR. (B) Plasma TG concentrations after P407 injection and box‐and‐whisker plots presenting VLDL‐TG secretion rates in L‐G6pc +/+ and L‐G6pc −/− mice treated with shChREBP or shSCR (n = 4‐7). (C) Box‐and‐whisker plots presenting VLDL particle diameter, VLDL particle volume, and VLDL particle ratio of TG/apoB48 in L‐G6pc +/+ and L‐G6pc −/− mice treated with shChREBP or shSCR (n = 3‐8). ***P < 0.001 indicates significance compared with shSCR. ^P < 0.05, ^^P < 0.01 indicates significance compared with L‐G6pc +/+ mice. Abbreviations: apoB48, apolipoprotein B 48; ChREBP, carbohydrate response element binding protein; L‐G6pc −/−, liver‐specific glucose‐6‐phosphatase catalytic subunit knockout; L‐G6pc +/+, liver‐specific glucose‐6‐phosphatase catalytic subunit–sufficient; P407, poloxamer 407; shChREBP, short hairpin ChREBP; shRNA, short hairpin RNA; shSCR, scrambled shRNA; TG, triglyceride; VLDL, very low density lipoprotein.
ChREBP Regulates Hepatic Microsomal TG Transfer Protein and Transmembrane 6 Superfamily Member 2 Expression
VLDL particles are assembled by lipidation of APOB in the endoplasmic reticulum (ER) and Golgi, mediated by microsomal TG transfer protein (MTTP) and transmembrane 6 superfamily member 2 (TM6SF2). As expected,( 3 , 13 ) we observed that hepatic ChREBP knockdown reduced hepatic Mttp mRNA (Fig. 4A) and protein abundance (Fig. 4B) in L‐G6pc +/+ and L‐G6pc −/− mice. Interestingly, we also observed that Tm6sf2 mRNA levels and protein abundance were induced in shSCR‐treated L‐G6pc −/− mice as compared with wild‐type controls and normalized in shChREBP‐treated L‐G6pc −/− mice (Fig. 4A,B). We confirmed that Tm6sf2 mRNA levels were also ChREBP‐dependently induced in mice treated with the G6P transporter SLC37A4 inhibitor S4048 (Fig. 4C), an acute model for hepatic GSD 1b.( 14 ) Publicly available liver ChREBP ChIP‐sequencing data( 4 ) indicated potential regulation of Tm6sf2 by ChREBP, and computational analysis revealed four putative ChREBP binding sites in the mouse Tm6sf2 promoter (Fig. 4D). ChIP‐qPCR analysis showed specific recruitment of ChREBP to these binding sites on S4048 treatment, indicating that hepatic ChREBP directly controls murine Tm6sf2 transcription (Fig. 4D). Moreover, analysis of publicly available gene expression data (Gene Expression Omnibus Series GSE61576)( 24 ) revealed that hepatic ChREBP overexpression induced Tm6sf2 expression in mouse liver (Supporting Fig. S3A). Cell reporter assays indicated that ChREBPα/Max‐like protein X (MLX) and ChREBPβ/MLX further enhanced the transactivation of the mouse Tm6sf2 gene reporter by hepatocyte nuclear factor 4 alpha (HNF‐4α), whereas they did not transactivate the reporter in the absence of HNF‐4α (Fig. 4E). Finally, ChIP‐qPCR analysis of mouse liver indicated that both ChREBP and HNF‐4α are associated with the Tm6sf2 promoter and that these interactions are significantly higher in fed versus fasted mice (Fig. 4F).
FIG. 4.
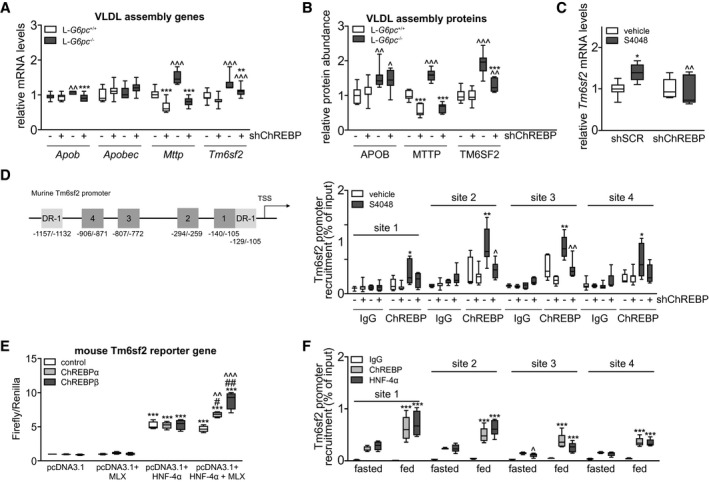
Hepatic ChREBP regulates hepatic Mttp and Tm6sf2 expression. (A) Box‐and‐whisker plots presenting hepatic relative levels of VLDL assembly genes in L‐G6pc +/+ and L‐G6pc −/− mice treated with either shChREBP or shSCR (n = 7‐9). (B) Box‐and‐whisker plots presenting hepatic relative abundance of VLDL assembly proteins in L‐G6pc +/+ and L‐G6pc −/− mice treated with shChREBP or shSCR (n = 6‐9). (C) Box‐and‐whisker plots presenting hepatic relative mRNA levels of Tm6sf2 in L‐G6pc +/+ and S4048 mice treated with shChREBP or shSCR (n = 6‐7). (D) Schematic presentation of putative ChREBP (Nos. 1‐4, dark grey) and HNF‐4α (DR‐1, light grey) response elements within the murine Tm6sf2 promoter. Box‐and‐whisker plots presenting in vivo ChIP analysis of the putative ChREBP response elements in the hepatic Tm6sf2 promoter in mice treated with shChREBP or shSCR and infused with S4048 or vehicle (n = 5‐7). (E) Box‐and‐whisker plots presenting firefly‐to‐renilla luciferase activities for the murine Tm6sf2 gene reporter after transfection with HNF‐4α, MLX, ChREBPα, and ChREBPβ plasmids (n = 3‐4 independent experiments, each experiment performed in triplicate). (F) Box‐and‐whisker plots presenting in vivo ChIP analysis of the putative ChREBP response elements in the hepatic Tm6sf2 promoter in overnight fasted or fed C57BL/6J mice (n = 5). *P < 0.05, **P < 0.01, ***P < 0.001 indicates significance compared with shSCR for panels A‐D, compared with pcDNA3.1 for panel E and compared with fasted for panel F. ^P < 0.05, ^^P < 0.01, ^^^P < 0.001 indicates significance compared with L‐G6pc +/+ mice for panels A‐D, compared with control for panel E and compared with ChREBP for panel F. #P < 0.05, ##P < 0.01 indicates significance compared with pcDNA3.1 + HNF‐4α for panel E and compared with fasted for panel F. Abbreviations: Apob, apolipoprotein B gene; Apobec, apolipoprotein B mRNA editing enzyme catalytic subunit gene; ChIP, chromatin immunoprecipitation; ChREBP, carbohydrate response element binding protein; DR‐1, down‐regulator of transcription 1 gene; HNF‐4α, hepatocyte nuclear factor 4 alpha; IgG, immunoglobulin G; L‐G6pc −/−, liver‐specific glucose‐6‐phosphatase catalytic subunit knockout; L‐G6pc +/+, liver‐specific glucose‐6‐phosphatase catalytic subunit–sufficient; MLX, Max‐like protein X; Mttp, microsomal triglyceride transfer protein gene; shChREBP, short hairpin ChREBP; shRNA, short hairpin RNA; shSCR, scrambled shRNA; Tm6sf2, transmembrane 6 superfamily member 2 gene; VLDL, very low density lipoprotein.
Discussion
Patients with GSD 1a experience severe hepatomegaly and develop NAFLD. We have shown that hepatic activity of the glucose‐sensitive transcription factor ChREBP is increased in mouse models for GSD 1a and GSD 1b and that ChREBP mediates the induction of glycolytic and lipogenic genes in acute GSD 1b.( 14 , 15 ) As enhanced glycolysis and lipogenesis promote hepatic lipid storage, these findings prompted us to evaluate the contribution of enhanced ChREBP activity to the development of NAFLD in GSD 1a mice. We found that normalization of hepatic ChREBP activity in L‐G6pc −/− mice by shRNA‐mediated knockdown, as validated by the expression of the key marker gene Chrebpβ,( 12 , 21 ) further promoted hepatomegaly, hepatocyte vacuolation, and NAFLD development because of additional accumulation of glycogen and lipids in the liver. Notably, aggravation of NAFLD in shChREBP‐treated L‐G6pc −/− mice occurred despite a reduction in fractional de novo lipogenesis and was associated with a marked suppression of hepatic VLDL‐TG secretion. These changes were paralleled by a ChREBP‐dependent reduction in hepatic expression of MTTP and TM6SF2, proteins that are both involved in VLDL lipidation.( 25 ) Interestingly, we also observed that ChREBP was recruited to the murine Tm6sf2 promoter in response to hepatic G6P accumulation, thereby identifying TM6SF2 as a transcriptional target of ChREBP in mouse liver under conditions of increased intracellular glucose signaling. Altogether, our data indicate that enhanced hepatic ChREBP activity limits hepatomegaly, hepatocyte vacuolation, and NAFLD development in GSD 1a and should therefore be considered as a “protective” response under these conditions of excessive intrahepatic glucose metabolism.
NAFLD results from an imbalance between hepatic TG input and output, and “snapshot” hepatic TG content is therefore determined by hepatic free fatty acid influx rates, the activities of de novo lipogenesis and fatty acid oxidation pathways, and VLDL‐TG secretion.( 26 ) The activities and relative contributions of these processes may change under different physiological (e.g., feeding and fasting conditions) and disease states (e.g., obesity and diabetes). As ChREBP exerts transcriptional control on the expression of key genes involved in de novo lipogenesis, fatty acid oxidation, and VLDL‐TG secretion,( 3 , 4 , 5 , 13 , 27 ) the consequence of altered hepatic ChREBP activity for NAFLD development is likely dependent on the prevailing (patho)physiological condition. Previous research has shown that partial or complete ablation of ChREBP reduces hepatic lipid content in mice with type 2 diabetes,( 17 , 18 ) as well as in some,( 28 , 29 ) but not all,( 30 , 31 ) studies in which rodents were fed carbohydrate‐rich or fructose‐rich diets. On the other hand, ChREBP inactivation did not lower hepatic lipid content under conditions of chow or high‐fat feeding.( 13 , 28 , 32 ) In the current study, we demonstrated that normalization of ChREBP activity in GSD 1a hepatocytes suppresses fractional de novo lipogenesis, whereas elevated hepatic C2‐acylcarnitine levels under these conditions are indicative of enhanced hepatic fatty acid oxidation. Yet hepatic accumulation of old fat was increased in shChREBP‐treated mice, due to a strong suppression of VLDL‐TG secretion. Thus, the reduction in de novo fatty acid synthesis and the increase in fatty acid catabolism were insufficient to compensate for reduced VLDL lipidation and secretion in “our disease context” (i.e., nonfasted normoglycemic L‐G6pc −/− mice). The fractional contribution of hepatic de novo fatty oleate synthesis in L‐G6pc −/− mice was limited and reduced from ~20% to ~10% on hepatic ChREBP knockdown (Fig. 2E). As a consequence, total hepatic de novo oleate synthesis was reduced by 5 μmol in shChREBP‐treated versus shSCR‐treated L‐G6pc −/− mice within the 48 hours of 13C‐acetate administration. On the other hand, VLDL‐TG secretion was reduced by about 350 μmol/kg per hour on hepatic ChREBP knockdown (Fig. 3B), corresponding to a reduction in hepatic oleate export of about 10 μmol per hour. Thus, indeed, the amount of excess fatty acids stored in liver because of impaired VLDL‐TG secretion massively exceeded the shChREBP‐mediated reduction in de novo fatty acid synthesis. In contrast to L‐G6pc −/− mice, which showed a ~60% increase in VLDL‐TG secretion rate as compared with wild‐type controls (Fig. 3B), our laboratory has shown that VLDL‐TG secretion is unchanged in mice with type 2 diabetes compared with controls.( 33 ) As a result, the excess storage of old fat due to suppression of VLDL‐TG secretion in response to hepatic ChREBP knockdown is likely of less quantitative importance in mice with type 2 diabetes as compared with L‐G6pc −/− mice. Moreover, fractional palmitate synthesis accounts for ~50% in chow‐fed mice with type 2 diabetes ( 33 ) versus 30% in L‐G6pc −/− mice (Fig. 2E), whereas the contribution of hepatic NEFA influx may be larger in insulin‐resistant mice with obesity as compared with L‐G6pc −/− mice.( 26 , 34 ) Therefore, the differential contributions of de novo lipogenesis and VLDL‐TG secretion to hepatic lipid content likely explain most of the opposing effects of hepatic ChREBP inhibition on lipid accumulation in mice with type 2 diabetes( 17 , 18 ) versus mice with hepatocyte‐specific GSD 1a. Aside from the variable efficacies of hepatic ChREBP knockdown between studies, we propose that differences in the contribution of de novo lipogenesis, VLDL‐TG secretion, and fatty acid oxidation pathways explain the reported divergent effects of hepatic ChREBP knockdown on NAFLD.( 13 , 17 , 18 , 22 , 28 , 29 , 30 , 31 ) Along similar lines, the observed increase in hepatic cholesterol synthesis and ER stress in high‐fructose–fed whole‐body ChREBP‐knockout mice( 29 ) is likely also context‐dependent, as was proposed by Kim et al.( 30 ) In contrast to what has been reported,( 29 ) hepatic ChREBP knockdown did not alter the expression of cholesterol biosynthesis genes (Supporting Fig. S1B) or fractional cholesterol synthesis rates in the livers of L‐G6pc −/− mice in the current study (Supporting Fig. S1C). Absolute cholesterol synthesis was only slightly increased in these animals (Supporting Fig. S1C). On the other hand, consistent with Zhang et al.,( 29 ) we did observe increased mRNA levels of the ER stress markers B‐cell chronic lymphocytic leukemia/lymphoma 2 binding component 3 (Bbc3) gene and DNA damage–inducible transcript 3 (Ddit3) gene in shChREBP‐treated L‐G6pc −/− mice (Supporting Fig. S1D). Combined, published data and our current findings indicate that the relationship between hepatic ChREBP activity and NAFLD development is disease context–dependent.
Our study shows that ChREBP plays a key role in hepatic VLDL lipidation and secretion in GSD 1a and is essential for proper regulation of hepatic TG balance and, consequently, NAFLD development under conditions of high intrahepatic glucose availability. Aside from confirming the regulatory role of ChREBP in VLDL‐TG production and secretion,( 13 , 31 , 32 ) our work mechanistically supports genetic studies in humans that have linked ChREBP expression to plasma lipid levels.( 35 , 36 , 37 , 38 , 39 ) Our findings also establish the contribution of ChREBP activity to enhanced VLDL‐TG secretion and hypertriglyceridemia in GSD 1a (J.A. Hoogerland, MSc, et al., 2020, unpublished data). Importantly, our study identified G6P‐ChREBP signaling as a regulatory axis that controls TM6SF2 abundance in the liver under conditions of excessive intrahepatic glucose metabolism. Our molecular in vivo and in vitro studies indicate that HNF‐4α contributes to regulation of basal Tm6sf2 transcription in mouse liver, whereas ChREBP mediates a glucose/G6P‐induced induction of Tm6sf2. This potential mechanism is supported by strongly reduced hepatic Tm6sf2 levels in hepatocyte‐specific Hnf‐4α–knockout mice and slightly lower in Tm6sf2 expression in ChREBP null mice as compared with their wild‐type littermates (Supporting Fig. S3E). TM6SF2 function was originally linked to human NAFLD in an exome‐wide association study.( 40 ) Subsequent research has shown that its activity is essential for VLDL lipidation and maintenance of hepatic TG balance.( 40 , 41 , 42 , 43 , 44 ) Our study reports a HNF‐4α/ChREBP–dependent induction of TM6SF2 abundance in response to G6P accumulation in mouse liver. Thus, aside from regulating MTTP abundance,( 13 ) hepatic ChREBP also appears to regulate VLDL lipidation through TM6SF2. The impaired hepatic VLDL lipidation and suppression of hepatic TG secretion with concomitant increases in hepatic TG content and lipid droplet size in shChREBP‐treated L‐G6pc +/+ and L‐G6pc −/− mice in the current study actually phenocopies what has been observed on hepatic Tm6sf2 knockdown and in Tm6sf2‐knockout mice.( 40 , 41 , 42 ) In contrast to the synergistic effect of ChREBP and HNF‐4α on murine Tm6sf2 reporter activation, ChREBPα and ChREBPβ did not promote HNF‐4α–induced transactivation of the human TM6SF2 gene reporter (Supporting Fig. S3D). However, the reporter gene used does not cover all predicted ChREBP and HNF‐4α binding sites in the human TM6SF2 gene (Supporting Fig. S3B). Whether or not ChREBP and HNF‐4α also cooperatively regulate hepatic TM6SF2 expression in human hepatocytes can therefore not be concluded from our studies. Yet, in view of the similarities in liver pathophysiology between GSD 1a and type 2 diabetes,( 45 , 46 ) it is tempting to speculate that a ChREBP‐dependent induction of hepatic TM6SF2 potentially also contributes to hypertriglyceridemia in those with type 2 diabetes.( 47 , 48 ) Follow‐up research will be essential to assess the translational value of the regulatory mechanism we have identified.
In conclusion, our study shows that hepatic ChREBP maintains TG balance in GSD 1a liver by concomitantly regulating hepatic lipogenesis; fatty acid oxidation; and, particularly, VLDL‐TG secretion,( 3 , 4 , 5 , 13 , 27 ) thereby limiting NAFLD development. Our work identifies hepatic G6P‐ChREBP signaling as a regulatory axis that controls murine TM6SF2 expression, hence controlling VLDL lipidation and secretion. Enhanced ChREBP activity also likely protects against NAFLD progression to advanced liver disease under conditions of excessive hepatic glucose metabolism, such as GSD 1a and type 2 diabetes.
Author Contributions
Substantial contributions to conception and design, acquisition of data, or analysis and interpretation of data: Y.L., J.A.H., V.W.B., T.B., A.B., H.W., J.C.W., B.S.H., T.H.v.D., R.T., M.v.W., G.M., R.H.H., A.d.B., F.R., F.K. and M.H.O. Drafting the article or revising it critically for important intellectual content: Y.L., J.A.H., V.W.B., T.B., A.B., H.W., J.C.W., B.S.H., T.H.v.D., R.T., M.v.W., G.M., R.H.H., A.d.B., F.R., F.K. and M.H.O.; final approval of the version to be published, Y.L., J.A.H., V.W.B., T.B., A.B., H.W., J.C.W., B.S.H., T.H.v.D., R.T., M.v.W., G.M., R.H.H., A.d.B., F.R., F.K. and M.H.O.
Supporting information
Supplementary Material
Table S2
Acknowledgment
We thank W. Liu, N.L. Mulder, W. Bin Obaid, I.A. Martini, M.H. Koster, K. van Eunen, A. Gerding, A. Jurdinski, and R. Havinga for excellent technical assistance and thank D.‐J. Reijngoud for scientific discussion. We thank A. Herling and D. Schmoll (Sanofi) for providing S4048, L. Chan for sharing the ChREBP ChIP‐sequencing data set, and Johan W. Jonker and Mark Herman for sharing HNF‐4α and ChREBPα/β/Mlx expression plasmids.
Supported by the Abel Tasman Talent Program of the University of Groningen to Y.L. M.H.O. is the recipient of a VIDI grant from the Dutch Scientific Organization and holds a Rosalind Franklin Fellowship from the University of Groningen. F.K. is supported by CardioVasculair Onderzoek Nederland (IN‐CONTROL II, CVON2018‐27). J.C.W. is supported by Transcard (FP7‐603091). F.R. and G.M. are supported by the French National Research Agency (ANR‐11‐BSV1‐009).
Potential conflict of interest: Nothing to report.
REFERENCES
Author names in bold designate shared co‐first authorship.
- 1. Chou JY, Jun HS, Mansfield BC. Type I glycogen storage diseases: disorders of the glucose‐6‐phosphatase/glucose‐6‐phosphate transporter complexes. J Inherit Metab Dis 2015;38:511‐519. [DOI] [PubMed] [Google Scholar]
- 2. Rake JP, Visser G, Labrune P, Leonard JV, Ullrich K, Smit GP. Glycogen storage disease type I: diagnosis, management, clinical course and outcome. Results of the European Study on Glycogen Storage Disease Type I (ESGSD I). Eur J Pediatr 2002;161(Suppl. 1):S20‐S34. [DOI] [PubMed] [Google Scholar]
- 3. Ma L, Robinson LN, Towle HC. ChREBP*Mlx is the principal mediator of glucose‐induced gene expression in the liver. J Biol Chem 2006;281:28721‐28730. [DOI] [PubMed] [Google Scholar]
- 4. Poungvarin N, Chang B, Imamura M, Chen J, Moolsuwan K, Sae‐Lee C, et al. Genome‐wide analysis of ChREBP binding sites on male mouse liver and white adipose chromatin. Endocrinology 2015;156:1982‐1994. [DOI] [PMC free article] [PubMed] [Google Scholar]
- 5. Dentin R, Pégorier JP, Benhamed F, Foufelle F, Ferré P, Fauveau V, et al. Hepatic glucokinase is required for the synergistic action of ChREBP and SREBP‐1c on glycolytic and lipogenic gene expression. J Biol Chem 2004;279:20314‐20326. [DOI] [PubMed] [Google Scholar]
- 6. Dentin R, Tomas‐Cobos L, Foufelle F, Leopold J, Girard J, Postic C, et al. Glucose 6‐phosphate, rather than xylulose 5‐phosphate, is required for the activation of ChREBP in response to glucose in the liver. J Hepatol 2012;56:199‐209. [DOI] [PubMed] [Google Scholar]
- 7. Guinez C, Filhoulaud G, Rayah‐Benhamed F, Marmier S, Dubuquoy C, Dentin R, et al. O‐GlcNAcylation increases ChREBP protein content and transcriptional activity in the liver. Diabetes 2011;60:1399‐1413. [DOI] [PMC free article] [PubMed] [Google Scholar]
- 8. Bricambert J, Miranda J, Benhamed F, Girard J, Postic C, Dentin R. Salt‐inducible kinase 2 links transcriptional coactivator p300 phosphorylation to the prevention of ChREBP‐dependent hepatic steatosis in mice. J Clin Invest 2010;120:4316‐4331. [DOI] [PMC free article] [PubMed] [Google Scholar]
- 9. Kawaguchi T, Takenoshita M, Kabashima T, Uyeda K. Glucose and cAMP regulate the L‐type pyruvate kinase gene by phosphorylation/dephosphorylation of the carbohydrate response element binding protein. Proc Natl Acad Sci U S A 2001;98:13710‐13715. [DOI] [PMC free article] [PubMed] [Google Scholar]
- 10. Sato S, Jung H, Nakagawa T, Pawlosky R, Takeshima T, Lee WR, et al. Metabolite regulation of nuclear localization of carbohydrate‐response element‐binding protein (ChREBP): role of AMP as an allosteric inhibitor. J Biol Chem 2016;291:10515‐10527. [DOI] [PMC free article] [PubMed] [Google Scholar]
- 11. Nakagawa T, Ge Q, Pawlosky R, Wynn RM, Veech RL, Uyeda K. Metabolite regulation of nucleo‐cytosolic trafficking of carbohydrate response element‐binding protein (ChREBP): role of ketone bodies. J Biol Chem 2013;288:28358‐28367. [DOI] [PMC free article] [PubMed] [Google Scholar]
- 12. Herman MA, Peroni OD, Villoria J, Schön MR, Abumrad NA, Blüher M, et al. A novel ChREBP isoform in adipose tissue regulates systemic glucose metabolism. Nature 2012;484:333‐338. [DOI] [PMC free article] [PubMed] [Google Scholar]
- 13. Wu W, Tsuchida H, Kato T, Niwa H, Horikawa Y, Takeda J, et al. Fat and carbohydrate in western diet contribute differently to hepatic lipid accumulation. Biochem Biophys Res Commun 2015;461:681‐686. [DOI] [PubMed] [Google Scholar]
- 14. Grefhorst A, Schreurs M, Oosterveer MH, Cortés VA, Havinga R, Herling AW, et al. Carbohydrate‐response‐element‐binding protein (ChREBP) and not the liver X receptor α (LXRα) mediates elevated hepatic lipogenic gene expression in a mouse model of glycogen storage disease type 1. Biochem J 2010;432:249‐254. [DOI] [PubMed] [Google Scholar]
- 15. Abdul‐Wahed A, Gautier‐Stein A, Casteras S, Soty M, Roussel D, Romestaing C, et al. A link between hepatic glucose production and peripheral energy metabolism via hepatokines. Mol Metab 2014;3:531‐543. [DOI] [PMC free article] [PubMed] [Google Scholar]
- 16. Cho JH, Kim GY, Pan CJ, Anduaga J, Choi EJ, Mansfield BC, et al. Downregulation of SIRT1 signaling underlies hepatic autophagy impairment in glycogen storage disease type Ia. PLoS Genet 2017;13:e1006819 10.1371/journal.pgen.1006819. [DOI] [PMC free article] [PubMed] [Google Scholar]
- 17. Iizuka K, Miller B, Uyeda K. Deficiency of carbohydrate‐activated transcription factor ChREBP prevents obesity and improves plasma glucose control in leptin‐deficient (ob/ob) mice. Am J Physiol Endocrinol Metab 2006;291:E358‐E364. [DOI] [PubMed] [Google Scholar]
- 18. Dentin R, Benhamed F, Hainault I, Fauveau V, Foufelle F, Dyck JR, et al. Liver‐specific inhibition of ChREBP improves hepatic steatosis and insulin resistance in ob/ob mice. Diabetes 2006;55:2159‐2170. [DOI] [PubMed] [Google Scholar]
- 19. Mutel E, Abdul‐Wahed A, Ramamonjisoa N, Stefanutti A, Houberdon I, Cavassila S, et al. Targeted deletion of liver glucose‐6 phosphatase mimics glycogen storage disease type 1a including development of multiple adenomas. J Hepatol 2011;54:529‐537. [DOI] [PubMed] [Google Scholar]
- 20. Kleiner DE, Brunt EM, Van Natta M, Behling C, Contos MJ, Cummings OW, et al.;Nonalcoholic Steatohepatitis Clinical Research Network . Design and validation of a histological scoring system for nonalcoholic fatty liver disease. Hepatology 2005;41:1313‐1321. [DOI] [PubMed] [Google Scholar]
- 21. Kim MS, Krawczyk SA, Doridot L, Fowler AJ, Wang JX, Trauger SA, et al. ChREBP regulates fructose‐induced glucose production independently of insulin signaling. J Clin Invest 2016;126:4372‐4386. [DOI] [PMC free article] [PubMed] [Google Scholar]
- 22. Iizuka K, Bruick RK, Liang G, Horton JD, Uyeda K. Deficiency of carbohydrate response element‐binding protein (ChREBP) reduces lipogenesis as well as glycolysis. Proc Natl Acad Sci U S A 2004;101:7281‐7286. [DOI] [PMC free article] [PubMed] [Google Scholar]
- 23. Oosterveer MH, van Dijk TH, Tietge UJ, Boer T, Havinga R, Stellaard F, et al. High fat feeding induces hepatic fatty acid elongation in mice. PLoS One 2009;4:e6066 10.1371/journal.pone.0006066. [DOI] [PMC free article] [PubMed] [Google Scholar]
- 24. Benhamed F, Denechaud PD, Lemoine M, Robichon C, Moldes M, Bertrand‐Michel J, et al. The lipogenic transcription factor ChREBP dissociates hepatic steatosis from insulin resistance in mice and humans. J Clin Invest 2012;122:2176‐2194. [DOI] [PMC free article] [PubMed] [Google Scholar]
- 25. Alves‐Bezerra M, Cohen DE. Triglyceride metabolism in the liver. Compr Physiol 2017;8:1‐8. [DOI] [PMC free article] [PubMed] [Google Scholar]
- 26. Donnelly KL, Smith CI, Schwarzenberg SJ, Jessurun J, Boldt MD, Parks EJ. Sources of fatty acids stored in liver and secreted via lipoproteins in patients with nonalcoholic fatty liver disease. J Clin Invest 2005;115:1343‐1351. [DOI] [PMC free article] [PubMed] [Google Scholar]
- 27. Pashkov V, Huang J, Parameswara VK, Kedzierski W, Kurrasch DM, Tall GG, et al. Regulator of G protein signaling (RGS16) inhibits hepatic fatty acid oxidation in a carbohydrate response element‐binding protein (ChREBP)‐dependent manner. J Biol Chem 2011;286:15116‐15125. [DOI] [PMC free article] [PubMed] [Google Scholar]
- 28. Jois T, Chen W, Howard V, Harvey R, Youngs K, Thalmann C, et al. Deletion of hepatic carbohydrate response element binding protein (ChREBP) impairs glucose homeostasis and hepatic insulin sensitivity in mice. Mol Metab 2017;6:1381‐1394. [DOI] [PMC free article] [PubMed] [Google Scholar]
- 29. Zhang D, Tong X, VanDommelen K, Gupta N, Stamper K, Brady GF, et al. Lipogenic transcription factor ChREBP mediates fructose‐induced metabolic adaptations to prevent hepatotoxicity. J Clin Invest 2017;127:2855‐2867. [DOI] [PMC free article] [PubMed] [Google Scholar]
- 30. Kim M, Astapova II, Flier SN, Hannou SA, Doridot L, Sargsyan A, et al. Intestinal, but not hepatic, ChREBP is required for fructose tolerance. JCI Insight 2017;2:96703 10.1172/jci.insight.96703. [DOI] [PMC free article] [PubMed] [Google Scholar]
- 31. Erion DM, Popov V, Hsiao JJ, Vatner D, Mitchell K, Yonemitsu S, et al. The role of the carbohydrate response element‐binding protein in male fructose‐fed rats. Endocrinology 2013;154:36‐44. [DOI] [PMC free article] [PubMed] [Google Scholar]
- 32. Niwa H, Iizuka K, Kato T, Wu W, Tsuchida H, Takao K, et al. ChREBP rather than SHP regulates hepatic VLDL secretion. Nutrients 2018;10:E321 10.3390/nu10030321. [DOI] [PMC free article] [PubMed] [Google Scholar]
- 33. Wiegman CH, Bandsma RH, Ouwens M, van der Sluijs FH, Havinga R, Boer T, et al. Hepatic VLDL production in ob/ob mice is not stimulated by massive de novo lipogenesis but is less sensitive to the suppressive effects of insulin. Diabetes 2003;52:1081‐1089. [DOI] [PubMed] [Google Scholar]
- 34. Bosy‐Westphal A, Braun W, Albrecht V, Müller MJ. Determinants of ectopic liver fat in metabolic disease. Eur J Clin Nutr 2019;73:209‐214. [DOI] [PubMed] [Google Scholar]
- 35. Kooner JS, Chambers JC, Aguilar‐Salinas CA, Hinds DA, Hyde CL, Warnes GR, et al. Genome‐wide scan identifies variation in MLXIPL associated with plasma triglycerides. Nat Genet 2008;40:149‐151. [DOI] [PubMed] [Google Scholar]
- 36. Willer CJ, Sanna S, Jackson AU, Scuteri A, Bonnycastle LL, Clarke R, et al. Newly identified loci that influence lipid concentrations and risk of coronary artery disease. Nat Genet 2008;40:161‐169. [DOI] [PMC free article] [PubMed] [Google Scholar]
- 37. Shaikh S, Waxler JL, Lee H, Grinke K, Garry J, Pober BR, et al. Glucose and lipid metabolism, bone density, and body composition in individuals with Williams syndrome. Clin Endocrinol (Oxf) 2018;89:596‐604. [DOI] [PMC free article] [PubMed] [Google Scholar]
- 38. Palacios‐Verdú MG, Segura‐Puimedon M, Borralleras C, Flores R, Del Campo M, Campuzano V, et al. Metabolic abnormalities in Williams‐Beuren syndrome. J Med Genet 2015;52:248‐255. [DOI] [PubMed] [Google Scholar]
- 39. Ortega‐Azorín C, Sorlí JV, Estruch R, Asensio EM, Coltell O, González JI, et al. Amino acid change in the carbohydrate response element binding protein is associated with lower triglycerides and myocardial infarction incidence depending on level of adherence to the Mediterranean diet in the PREDIMED trial. Circ Cardiovasc Genet 2014;7:49‐58. [DOI] [PubMed] [Google Scholar]
- 40. Kozlitina J, Smagris E, Stender S, Nordestgaard BG, Zhou HH, Tybjærg‐Hansen A, et al. Exome‐wide association study identifies a TM6SF2 variant that confers susceptibility to nonalcoholic fatty liver disease. Nat Genet 2014;46:352‐356. [DOI] [PMC free article] [PubMed] [Google Scholar]
- 41. Smagris E, Gilyard S, BasuRay S, Cohen JC, Hobbs HH. Inactivation of Tm6sf2, a gene defective in fatty liver disease, impairs lipidation but not secretion of very low density lipoproteins. J Biol Chem 2016;291:10659‐10676. [DOI] [PMC free article] [PubMed] [Google Scholar]
- 42. Ehrhardt N, Doche ME, Chen S, Mao HZ, Walsh MT, Bedoya C, et al. Hepatic Tm6sf2 overexpression affects cellular ApoB‐trafficking, plasma lipid levels, hepatic steatosis and atherosclerosis. Hum Mol Genet 2017;26:2719‐2731. [DOI] [PMC free article] [PubMed] [Google Scholar]
- 43. O'Hare EA, Yang R, Yerges‐Armstrong LM, Sreenivasan U, McFarland R, Leitch CC, et al. TM6SF2 rs58542926 impacts lipid processing in liver and small intestine. Hepatology 2017;65:1526‐1542. [DOI] [PMC free article] [PubMed] [Google Scholar]
- 44. Mahdessian H, Taxiarchis A, Popov S, Silveira A, Franco‐Cereceda A, Hamsten A, et al. TM6SF2 is a regulator of liver fat metabolism influencing triglyceride secretion and hepatic lipid droplet content. Proc Natl Acad Sci U S A 2014;111:8913‐8918. [DOI] [PMC free article] [PubMed] [Google Scholar]
- 45. Rajas F, Labrune P, Mithieux G. Glycogen storage disease type 1 and diabetes: learning by comparing and contrasting the two disorders. Diabetes Metab 2013;39:377‐387. [DOI] [PubMed] [Google Scholar]
- 46. Oosterveer MH, Schoonjans K. Hepatic glucose sensing and integrative pathways in the liver. Cell Mol Life Sci 2014;71:1453‐1467. [DOI] [PMC free article] [PubMed] [Google Scholar]
- 47. Kursawe R, Caprio S, Giannini C, Narayan D, Lin A, D'Adamo E, et al. Decreased transcription of ChREBP‐alpha/beta isoforms in abdominal subcutaneous adipose tissue of obese adolescents with prediabetes or early type 2 diabetes: associations with insulin resistance and hyperglycemia. Diabetes 2013;62:837‐844. [DOI] [PMC free article] [PubMed] [Google Scholar]
- 48. Eissing L, Scherer T, Todter K, Knippschild U, Greve JW, Buurman WA, et al. De novo lipogenesis in human fat and liver is linked to ChREBP‐beta and metabolic health. Nat Commun 2013;4:1528 10.1038/ncomms2537. [DOI] [PMC free article] [PubMed] [Google Scholar]
- 49. Holloway MG, Miles GD, Dombkowski AA, Waxman DJ. Liver‐specific hepatocyte nuclear factor‐4alpha deficiency: greater impact on gene expression in male than in female mouse liver. Mol Endocrinol 2008;22:1274‐1286. [DOI] [PMC free article] [PubMed] [Google Scholar]
- 50. Oosterveer MH, Grefhorst A, van Dijk TH, Havinga R, Staels B, Kuipers F, et al. Fenofibrate simultaneously induces hepatic fatty acid oxidation, synthesis, and elongation in mice. J Biol Chem 2009;284:34036‐34044. [DOI] [PMC free article] [PubMed] [Google Scholar]
Associated Data
This section collects any data citations, data availability statements, or supplementary materials included in this article.
Supplementary Materials
Supplementary Material
Table S2