

ABSTRACT
Cortical bone porosity is intimately linked with remodeling, is of growing clinical interest, and is increasingly accessible by imaging. Thus, the potential of animal models of osteoporosis (OP) to provide a platform for studying how porosity develops and responds to interventions is tremendous. To date, rabbit models of OP have largely focused on trabecular microarchitecture or bone density; some such as ovariectomy (OVX) have uncertain efficacy and cortical porosity has not been extensively reported. Our primary objective was to characterize tibial cortical porosity in rabbit‐based models of OP, including OVX, glucocorticoids (GC), and OVX + GC relative to controls (SHAM). We sought to: (i) test the hypothesis that intracortical remodeling is elevated in these models; (ii) contrast cortical remodeling and porosity in these models with that induced by parathyroid hormone (1–34; PTH); and (iii) contrast trabecular morphology in the proximal tibia across all groups. Evidence that an increase in cortical porosity occurred in all groups was observed, although this was the least robust for GC. Histomorphometric measures supported the hypothesis that remodeling rate was elevated in all groups and also revealed evidence of uncoupling of bone resorption and formation in the GC and OVX + GC groups. For trabecular bone, a pattern of loss was observed for OVX, GC, and OVX + GC groups, whereas the opposite was observed for PTH. Change in trabecular number best explained these patterns. Taken together, the findings indicated rabbit models provide a viable and varied platform for the study of OP and associated changes in cortical remodeling and porosity. Intriguingly, the evidence revealed differing effects on the cortical and trabecular envelopes for the PTH model. © 2020 The Authors. Journal of Bone and Mineral Research published by Wiley Periodicals LLC on behalf of American Society for Bone and Mineral Research (ASBMR)..
Keywords: CORTICAL POROSITY, RABBIT, OSTEOPOROSIS, PARATHYROID HORMONE, GLUCOCORTICOID
Introduction
Globally, 200 million people live with osteoporosis (OP), (1 ) which places significant burdens on health care systems worldwide. Assessment of osteoporotic bone loss has classically focused on bone mass and density at common fracture sites such as the hip, wrist, and lumbar vertebrae; however, there is growing recognition of the role of microarchitecture in bone deterioration and fragility.( 2 ) This trend has been driven by advances in imaging, which have enabled assessment of microarchitecture—particularly for trabecular bone. More recently, imaging approaches to assess cortical bone microarchitecture (porosity) have emerged for both preclinical (animal model) and clinical assessment,( 3 , 4 ) creating the potential to move beyond what has been termed a “trabeculocentric” view of bone loss.( 5 ) Indeed, the majority of the appendicular skeleton is composed of cortical bone, which suffers from significant losses associated with age.( 5 , 6 , 7 ) Moreover, 80% of all fractures occur at sites of weakened, thinned cortical bone.( 8 , 9 ) As recently reviewed, cortical bone porosity is associated with the mechanical strength of bone and is negatively related to material stiffness, toughness, and the capacity of bone to absorb impact.( 4 )
An increase in cortical porosity, at the scale of vascular pores (eg, osteonal/Haversian canals and associated resorption spaces), is a physical manifestation of bone loss that arises as a result of an imbalance in cortical remodeling with bone resorption outweighing bone formation. Remodeling, in the strict sense that Frost defined, refers only to the creation of secondary tissue (turnover) in either cortical or trabecular bone. The cells responsible for an individual remodeling event are referred to as a basic multicellular unit (BMU).( 10 ) BMUs are activated on bone surfaces, leading to the replacement of cylindrical packets (secondary osteons) in the cortex and trench‐like packets (hemi‐osteons) in trabecular bone.( 11 ) Within cortical bone, BMUs are classically depicted as consisting of an osteoclastic cutting cone that creates a tunnel‐like resorption space followed by an osteoblastic closing cone. A reversal zone separates them, but the two processes are spatially and temporally “coupled”( 12 , 13 ) and continued resorption has been demonstrated in this “reversal‐resorption” phase of the BMU.( 14 ) Imbalance with resorption outweighing formation within individual remodeling events is the underlying mechanism by which cortical porosity increases with age and/or disease. Increases in cortical porosity may be either a product of increased rate of remodeling, where formation lags behind resorption, (15 ) also referred to as transient remodeling spaces,( 16 ) or through “uncoupling,” where there is an arrest during the reversal phase of the BMU.( 17 , 18 , 19 ) Strategies for the prevention and/or reversal of OP ultimately must seek to augment the balance between resorption and formation within individual BMUs and not simply the cessation of remodeling as reflected by the growing body of literature on the side effects (eg, osteonecrosis of the jaw, atypical fractures) of some antiresorptive therapies for OP—mainly bisphosphonates but also recently reported for denosumab.( 20 , 21 , 22 , 23 , 24 ) High‐resolution preclinical imaging of the resorptive phase of individual BMUs holds great promise for novel spatial–temporal assessment of BMU regulation, both ex vivo( 25 ) and even in vivo.( 3 , 26 )
Given that cortical bone porosity is intimately linked with the remodeling process, is of clinical relevance, and presents an increasingly accessible target for imaging, there is a growing need for suitable animal models of OP to advance our understanding of how cortical porosity develops and how it is impacted by countermeasures. Interspecies variation in cortical microarchitecture can, however, limit the utility of common animal models. The cortical bone of larger vertebrates, including humans, tends to be dominated by secondary bone that is generated by remodeling, while smaller species (mammals less than 2 kg( 27 )), including mice and rats, exhibit little, if any, cortical turnover and thus retain primary vascular canals throughout their lives.( 28 , 29 , 30 , 31 , 32 ) Because of this, the American Food and Drug Administration (FDA) recommends the use of larger animals, which remodel their cortices in addition to the common ovariectomy (OVX) rat model for OP studies.( 33 ) Notably, larger species including rabbits, sheep, goats, dogs, and swine have all been employed in OP research.( 28 , 29 , 31 , 32 ) Here we focus on the rabbit, the smallest commonly employed laboratory animal with well‐defined spontaneous cortical remodeling similar to humans.( 34 , 35 , 36 ) Rabbits also have the advantage of a remodeling period that is shorter than larger animal models, a relatively rapid skeletal maturation (by 6 to 9 months),( 37 , 38 ) and they are known to respond to parathyroid hormone (PTH) treatment with elevated remodeling and cortical porosity.( 39 , 40 , 41 , 42 ) Taken together, these characteristics make the rabbit a promising platform for OP studies, which is well suited for potential in vivo imaging( 43 ) in future studies.
Animal models of OP generally focus on OVX to simulate postmenopausal decline in estrogen. In rabbits, however, the efficacy of this model is uncertain. OVX alone has been reported by several groups as ineffective at inducing OP in the rabbit,( 44 , 45 , 46 ) whereas others, conversely, have reported significant reductions in bone mineral density (BMD).( 47 , 48 , 49 , 50 ) The efficacy of the rabbit OVX model for induction of cortical porosity, in particular, is uncertain because existing studies have primarily focused on trabecular bone. The administration of glucocorticoids (GC) either alone or, more commonly, in combination with OVX (OVX + GC) is a proven approach for inducing trabecular( 44 , 45 , 46 , 51 , 52 , 53 , 54 ) and cortical geometry/density changes( 45 , 53 ) in the rabbit. That said, the impact of GC alone on cortical bone porosity in the rabbit has not yet been assessed and cortical porosity outcomes for OVX + GC have only recently been explored.( 55 ) Rabbit OP models hold great potential as platforms for advancing our understanding of cortical remodeling and associated porosity; however, this potential can only be realized by filling these gaps in the literature.
Our primary objective was to characterize three‐dimensional (3D) cortical bone porosity changes in rabbit models of OP (OVX, GC, and OVX + GC) at the distal tibia using ex vivo micro‐computed tomography (micro‐CT). Via correlative histomorphometry, we sought to test the hypothesis that cortical remodeling is elevated by these treatments relative to sham OVX controls (SHAM). Our secondary objective was to compare these changes with those caused by PTH, a known inducer of elevated intracortical remodeling and porosity in the rabbit. Finally, we sought to characterize 3D trabecular bone changes in the proximal tibia across these groups to enable assessment of changes in different bony compartments and to facilitate comparison with the more extensive literature pertaining to trabecular bone.
Materials and Methods
Animals
All animal work was approved by the University of Saskatchewan's University Animal Care Committee and adhered to the Canadian Council on Animal Care (CCAC) guidelines for humane animal use. Thirty‐five skeletally mature, 6‐month‐old (3.7 to 3.9 kg), female New Zealand White rabbits were acquired from a commercial supplier, Charles River Laboratories (Quebec, Canada). Animals were housed individually in stainless steel rabbit racks in the University of Saskatchewan's Health Sciences Laboratory Animal Services Unit, a CCAC‐accredited facility. Room temperature and humidity were controlled by a computerized system and the light cycle was maintained at 12:12 (12 hours of dark and 12 hours of light). Standard rabbit chow (Hi‐Pro Feeds, Trouw Nutrition Canada Inc., Sherwood Park, Canada) and reverse osmosis water through an automated watering system were provided ad libitum. Animals were acclimatized for a minimum of 7 days before any experimental procedures commenced.
The rabbits were randomly divided into 5 groups of 7 animals each: SHAM, OVX, GC, OVX + GC, and PTH. The OVX and OVX + GC group underwent bilateral ovariectomy, whereas the SHAM, GC, and PTH groups underwent bilateral sham OVX surgery. Fifty‐six days (8 weeks) post OVX/SHAM surgery (pre‐dosing period), the GC groups (GC and OVX + GC) received methylprednisolone sodium succinate (Pfizer, Kirkland, Canada) by daily subcutaneous injection of 1.5 mg/kg for 4 weeks, and the PTH group was dosed by daily subcutaneous injection for 4 weeks with human PTH (1‐34) (Alfa Aesar, Ward Hill, MA, USA) at a concentration of 30 μg/kg (dosing period). The PTH dose used was intermediate to what has been utilized in recent studies analyzing the effects of PTH dosing regimens (10 μg/kg/d versus 40 μg/kg/d) on rabbit cortical bone.( 39 , 42 ) The GC dose used was an intermediate‐to‐high dose (0.5 mg/kg/d versus 1.0 mg/kg/d versus 2.0 mg/kg/d) based on a previous study analyzing OVX and OVX + GC OP models in the rabbit.( 44 ) SHAM and OVX received daily subcutaneous injections of 1 mL saline for the corresponding 4‐week dosing period. Dose initiation at 8 weeks post‐surgery was selected based upon previous studies that found conflicting BMD results in relation to time (4, 6, or 8 weeks) post OVX.( 44 , 46 , 54 ) Each animal was monitored daily at the time of injection, as well as weekly to assess weight. The bone labeling fluorochrome calcein (Sigma‐Aldrich, St. Louis, MO, USA) was administered by subcutaneous injection at a dose of 10 mg/kg on days 13 and 14 (label 1) and days 27 and 28 (label 2; end point) of the treatment period to facilitate dynamic histomorphometry. Animals were euthanized by intravenous injection of pentobarbital sodium (Euthanyl; Bimeda‐MTC, Animal Health Inc, Cambridge, Canada) at a dose of 0.4 mL/kg. Post‐euthanasia, the right tibiae were removed and fixed in 10% formalin.
Micro‐CT analysis
The proximal epiphysis and distal diaphysis (Fig. 1A & C) were imaged with a SkyScan 1172 desktop micro‐CT scanner (Bruker, Kontich, Belgium) to assess cortical porosity and trabecular morphology, respectively. CTVolume (CTVol, version 2.3.2.0; Bruker) was used to generate 3D volumetric renderings of cortical porosity and trabecular bone morphology. For cortical porosity analysis, a volume of interest (VOI) along 1 cm of the diaphysis, beginning 3 cm proximal the distal end of the tibia, was scanned (Fig. 1C ) at 75 kVp, 133 μA with 460 ms exposure, 0.2° rotation step, 4‐frame averaging, and a 0.5 mm aluminum filter. Resolution dependency of micro‐CT analysis has long been recognized for both trabecular bone morphology( 56 ) and cortical bone porosity.( 57 ) Here we chose a nominal resolution (voxel size) of 10 μm to specifically target cortical porosity on the scale of remodeling‐related resorption spaces/osteons (~100 μm in rabbits( 58 )) with smaller spaces (including primary canals, mature secondary osteonal canals, osteocyte lacunae, and canaliculi) falling below the spatial resolution (Supplemental Fig. S1). It should be noted that our resolution was higher (smaller voxel size) than that of micro‐CT protocols previously applied to rabbit cortical bone (14 to 19 μm).( 39 , 42 , 46 , 55 ) Important considerations for future study included that the 10‐μm voxel size is similar in scale to that potentially available in vivo( 3 , 26 ) and the distal hind limb of the rabbit is well suited for live imaging with the animal in an upright position.( 43 ) We validated our 3D micro‐CT outcomes through comparison with two‐dimensional (2D) histological measures of osteon size, confirming correlation between the approaches and similar distributions of values from each (Supplemental Fig. S2 and Supplemental Table S1). Finally, the distal tibia represents a region of elevated porosity relative to the mid‐diaphysis (Supplemental Fig. S3) consistent with observations of elevated remodeling distally in lower limb elements.( 59 )
Fig 1.
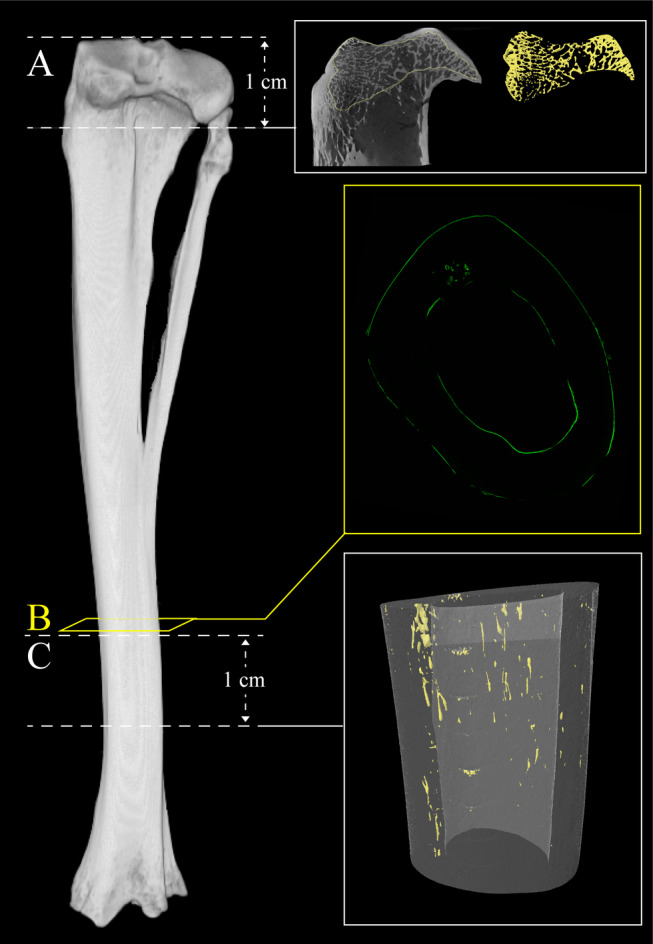
Micro‐computed tomography (micro‐CT) image of rabbit tibia depicting regions of analyses. (A) Location of trabecular bone micro‐CT analysis. Scan field height is 1 cm. Reconstructed micro‐CT image of proximal tibia scan and corresponding three‐dimensional reconstructed image of isolated trabecular bone highlighted in yellow (right). (B) Location of histomorphometric analysis. Section is 300 μm thick. Fluorescent confocal microscopy image of transverse section of cortical bone (right). (C) Location of cortical bone micro‐CT analysis. Scan field height is 1 cm. Three‐dimensional reconstructed image of cortical bone with cortical porosity highlighted in yellow (right).
For trabecular analysis, the proximal epiphysis of each tibia was scanned (Fig. 1A ) at 75 kVp, 133 μA with 1080 ms exposure, 0.2° rotation step, 4‐frame averaging, and a 0.5 mm aluminum filter at a voxel size of 13‐μm. The trabecular envelope within the entire epiphysis proximal to the growth plate was segmented as the VOI (Fig. 1A ). The epiphyseal subchondral trabecular bone was targeted for both consistency with the existing literature( 44 , 53 ) and the fact that little trabecular bone was present in the metaphyses of the rabbits (Fig. 1A ).
Micro‐CT data were reconstructed using the NRecon software package (Bruker), and quantitative 3D analysis was conducted with CTAnalyser (CTAn; version 1.16.4.1; Bruker). To assess changes in cortical bone microarchitecture, cortical porosity (Ct.Po, %) and mean canal diameter (Ca.Dm, μm) were measured after application of a standardized global threshold. Histograms representing the distribution of canal diameter sizes were produced to contrast patterns across the groups. For analysis of the trabecular VOIs, a standardized global threshold was again applied followed by 3D measurement of bone volume fraction (bone volume/tissue volume [BV/TV, %]), trabecular thickness (Tb.Th, mm), trabecular number (Tb.N, mm−1), and trabecular separation (Tb.Sp, mm).
Dynamic histomorphometry and cortical geometry
Confocal microscopy images were acquired from a cortical cross‐section placed immediately proximal to the micro‐CT VOI (Fig. 1B ). The sections were cut using a low‐speed sectioning saw (Buehler, Isomet) with a diamond wafer blade and ground and polished to a thickness of 300 μm.( 60 ) Mounted sections were subsequently imaged with a Leica (Leica Microsystems, Wetzlar, Germany) DMi8 confocal fluorescent microscope equipped with differential interference contrast microscopy (DIC) to capture fluorescent signals and cortical microstructure. 2D mosaics of the DIC and fluorescent images were produced and analyzed using basic ImageJ (https://imagej.nih.gov/ij/) functions (unless otherwise described).
Cross‐sectional cortical geometry parameters, cortical area (Ct.Ar, mm2), marrow area (Ma.Ar, mm2), and total area (Tt.Ar, mm2) were assessed and percent cortical and percent marrow area (%Ct.Ar, %Ma.Ar) were calculated relative to Tt.Ar. Cortical thickness (Ct.Th, μm) was measured using the BoneJ( 61 ) plugin for ImageJ. To complement the cortical geometry measures, estimates of maximal and minimal bending (second moments of area, Imax, Imin, mm4) as well as torsional stiffness (torsional section modulus, Zpol, mm3) were measured from the most proximal micro‐CT cross‐sectional image. These measures were performed on the micro‐CT data as this modality enabled the impact of internal porosity/surface geometry to be better integrated into the measures.
To evaluate the extent of active mineralization on bone surfaces, single‐ and double‐labeled bone surfaces (sLS, dLS, respectively) and total bone surface (BS) were measured on the endosteal (Es) and periosteal (Ps) surfaces. Mineralizing surface per bone surface (MS/BS) was calculated as (dLS + sLS/2)/BS on the endosteal (Es.MS/BS, %) and periosteal (Ps.MS/BS, %) surfaces.
Intracortical remodeling activity was then counted manually as single‐labeled osteons (sL.On), double‐labeled osteons (dL.On), and resorption cavities (Rs.N), defined as non‐mineralizing pores characterized by eroded surfaces, no lamellar bone formation, and no calcein labeling. These parameters were normalized to Ct.Ar (sL.On/Ct.Ar, dL.On/Ct.Ar, and Rs.N/Ct.Ar, mm−2) and used to calculate a ratio of labeled osteons versus resorption cavities ((sL.On+dL.On)/Rs.N). In cross‐sections where Rs.N was zero, a denominator of 1 was used to maximize the inclusion of data. Activation frequency (Ac.f) was calculated as Ac.f = ((sL.On+dL.On)/Ct.Ar)/σf (#/mm2/year), where σf, the osteon formation time, was calculated as W.Th/On.MAR.( 10 ) W.Th (μm) reflects osteon wall thickness, the distance between osteon canal and cement line. This was measured from 50 randomly selected osteons for each animal within each transverse section using transmitted light microscopy at ×20 magnification. In sections with fewer than 50 osteons, all osteons present were measured. Osteonal mineral apposition rate (On.MAR, μm/d) was calculated as the inter‐label distance, measured as the distance between two consecutive osteonal calcein labels, divided by the labeling period (14 days). On.MAR was measured in 20 randomly selected dL.On within each transverse section. In sections with fewer than 20 dL.On, all osteons present were measured. Ac.f was calculated from mean W.Th and On.MAR values for each animal and, therefore, only rabbits with On.MAR values were included in the mean calculation of Ac.f. Finally, to provide a measure of overall remodeling activity that did not rely upon normalization to σf, we calculated active remodeling centers (a.Rm.Cr, mm−2) as the sum of resorption spaces and labeled osteons normalized to Ct.Ar: (sL.On+dL.On+Rs.N)/Ct.Ar.
Statistical analysis
All statistical analyses were performed with SPSS version 26.0 (IBM, Armonk, NY, USA). The normality of all parameters was assessed by Shapiro–Wilk tests. Independent samples t tests were employed to evaluate animal weight percent change (testing difference from 0) across the entire experimental period (weeks 0 to 12) and also within the pre‐dosing period (weeks 0 to 8) and the dosing period (weeks 8 to 12). When normally distributed for all groups, bone parameter data were assessed with one‐way ANOVA (α = 0.05) and, when significant, post hoc Bonferroni tests were used to compare all groups versus SHAM. If non‐normal distributions were detected for one or more groups, nonparametric Kruskal–Wallis H tests (α = 0.05) with, when significant, post hoc pairwise comparisons versus SHAM using Dunn's procedure( 62 ) were carried out. To account for repeated pairwise post hoc tests, p value (mean difference, group/SHAM) or α (confidence interval [CI] of the mean/median differences versus SHAM) were adjusted using Bonferroni's method.( 63 ) For most measures, the p value and CI were adjusted to account for the four pairwise comparisons versus SHAM resulting in adjusted p = p * 4 and %CI = 98.75% (1‐α; where α = 0.05/4). For comparisons lacking the two GC‐dosed groups, the two pairwise comparisons employed resulted in adjusted p = p * 2 and %CI = 97.5% (1‐α; where α = 0.05/2). To calculate the CIs, additional independent t tests for the normal data and Hodges‐Lehmann tests for the non‐normal data were employed. Finally, fold changes relative to SHAM (group/SHAM) were calculated for all parameters.
Results
Animal weight
Statistics for weight and % weight change are summarized in Table 1 and depicted in Fig. 2. For the 8‐week pre‐dosing period, CI of the percent change in weight excluded zero for SHAM (p = 0.008), OVX (p = 0.001), and OVX + GC (p = 0.049), and was strongly offset from zero for PTH (p = 0.053) indicating weight gain in these groups. Conversely, the data for GC (p = 0.894) indicated no change in weight reflected by a CI evenly distributed about zero. CIs revealed that during the 4‐week dosing period SHAM (p < 0.001) and OVX (p = 0.006) again gained weight, while GC (p = 0.008), OVX + GC (p = 0.011), and PTH (p = 0.012) all lost weight. Considering the entire 12‐week experimental period, SHAM (p = 0.002) and OVX (p < 0.001) exhibited overall weight gain, GC (p = 0.037) exhibited overall weight loss, while OVX + GC (p = 0.430) and PTH (p = 0.674) exhibited no change with CIs well distributed about zero.
Table 1.
Rabbit Weight Analyses
| Parameter | SHAM | OVX | GC | OVX + GC | PTH | ||||||||||
|---|---|---|---|---|---|---|---|---|---|---|---|---|---|---|---|
| Mean ± SD | versus 0 p | 95% CI | Mean ± SD | versus 0 p | 95% CI | Mean ± SD | versus 0 p | 95% CI | Mean ± SD | versus 0 p | 95% CI | Mean ± SD | versus 0 p | 95% CI | |
| % Weight change pre‐dosing period | 10.37 ± 7.04 | 0.008 | 3.86, 16.87 | 12.80 ± 5.02 | 0.001 | 8.16, 17.45 | −0.27 ± 5.19 | 0.894 | −5.07, 4.53 | 6.63 ± 7.11 | 0.049 | 0.05, 13.20 | 7.80 ± 8.58 | 0.053 | −0.13, 15.74 |
| % Weight change dosing period | 3.60 ± 1.23 | <0.001 | 2.46, 4.74 | 4.86 ± 3.15 | 0.006 | 1.95, 7.77 | −9.44 ± 6.33 | 0.008 | −15.29, −3.58 | −10.23 ± 7.45 | 0.011 | −17.13, −3.34 | −5.69 ± 4.22 | 0.012 | −9.59, −1.78 |
| % Weight change experimental period | 14.33 ± 7.24 | 0.002 | 7.64, 21.02 | 18.18 ± 3.21 | <0.001 | 15.21, 21.15 | −9.56 ± 9.49 | 0.037 | −18.34, −0.78 | −4.04 ± 12.62 | 0.430 | −15.71, 7.64 | 1.75 ± 10.46 | 0.674 | −7.92, 11.42 |
SHAM = control; OVX = ovariectomy; GC = glucocorticoid; OVX + GC = ovariectomy and glucocorticoid; PTH = parathyroid hormone. Values are reported as mean ± standard deviation. n = 7. Independent sample t tests were employed. The reported p values are unadjusted. 95% confidence intervals (CI) of the mean are reported.
Fig 2.

Analyses of mean changes in body weight in rabbit groups over experimental time period (0 to 3 months). Data are presented by box plots with individual rabbits plotted as solid circles and outliers plotted as open circles. n = 7. Independent sample t tests (α = 0.05) were employed for comparison to 0 with p values (unadjusted) shown in graph. SHAM = control; OVX = ovariectomy; GC = glucocorticoid; OVX + GC = ovariectomy and glucocorticoid; PTH = parathyroid hormone.
Cortical porosity
Representative micro‐CT 2D cross‐sectional images and 3D renders of the VOIs are provided in Fig. 3A . Cortical pores appeared to be non‐uniform and clustered within portions of the mid‐cortex. Measurements of Ct.Po and Ca.Dm are summarized in Table 2 and Fig. 3B,C . CIs of the mean/median differences versus SHAM excluded zero for all groups with fold changes from SHAM ranging from 4.6 to 28.8, indicating increased porosity in all groups. Evidence supporting an increase in Ct.Po was the least robust for GC (adj. p = 0.256), which had the smallest fold increase (4.6) despite inclusion of a strongly positive outlier. For Ca.Dm, similar fold change increases from SHAM, ranging from 1.4 to 1.9, were observed in all groups and CIs excluding (OVX + GC, adj. p < 0.001 and PTH, adj. p = 0.049) or strongly offset (OVX, adj. p = 0.202; and GC, adj. p = 0.061) from zero were observed across all groups (Table 2). The distributions of Ca.Dm values (Fig. 3D ) reflected the relatively low proportion of large resorption space‐sized pores in SHAM, although this group did exhibit a peak in distribution of values around the expected (100 μm) osteon/resorption space diameter for rabbits. A similar peak dominated the distributions for OVX and PTH. The two GC dosed groups (GC and OVX + GC) exhibited a different pattern with higher proportions of much larger pores.
Fig 3.

Micro‐CT‐based analyses of cortical bone in rabbit tibiae. (A) Representative two‐dimensional micro‐CT cross‐sectional images of cortical bone in distal rabbit tibiae in various treatment groups with corresponding three‐dimensional renders of volume of interest (below). Regions of cortical porosity at the level of vascular canals are highlighted in yellow. Scale bar = 1 mm. (B) Cortical porosity (Ct.Po) analysis in rabbit tibiae. Data are presented by box plot with individual rabbits plotted as solid circles and outliers plotted as open circles. n = 7. Kruskal–Wallis H test with post hoc Dunn's test was used to compare groups versus SHAM. Adjusted p values (Bonferroni method; adj. p = p * 4 for four‐pairwise comparisons) are shown in graph. (C) Canal diameter (Ca.Dm) analysis in rabbit tibiae. Data are presented by box plot with individual rabbits plotted as solid circles and outliers plotted as open circles. n = 7. One‐way ANOVA with post hoc Bonferroni test was used to compare groups versus SHAM. Adjusted p values (Bonferroni method; adj. p = p * 4 for four‐pairwise comparisons) are shown in graph. (D) Histograms depicting distributions of canal diameters in rabbit tibiae for each group. SHAM = control; OVX = ovariectomy; GC = glucocorticoid; OVX + GC = ovariectomy and glucocorticoid; PTH = parathyroid hormone.
Table 2.
Micro‐CT Cortical Bone Parameters
| Parameter | Overall test p | SHAM | OVX | GC | OVX + GC | PTH | ||||||||||||
|---|---|---|---|---|---|---|---|---|---|---|---|---|---|---|---|---|---|---|
| Mean ± SD (median) | Mean ± SD (median) | versus SHAM adj. p | Mean/median difference (CI) | Fold Change | Mean ± SD (median) | versus SHAM adj. p | Mean/median difference (CI) | Fold Change | Mean ± SD (median) | versus SHAM adj. p | Mean/median difference (CI) | Fold change | Mean ± SD (median) | versus SHAM adj. p | Mean/median difference (CI) | Fold change | ||
| Ct.Po (%) | <0.001 |
0.13 ± 0.04 (0.13) |
0.75 ± 0.37 (0.69) | 0.028 | 0.56 (0.20, 1.04) | 5.8 | 0.60 ± 0.73 (0.39) | 0.256 | 0.24 (0.06, 2.09) | 4.6 | 1.38 ± 1.12 (0.82) | 0.004 | 0.69 (0.57, 3.49) | 10.6 | 3.75 ± 2.24 (3.42) | <0.001 | 3.29 (0.92, 6.78) | 28.8 |
| Ca.Dm (μm) | 0.003 | 70.00 ± 27.40 | 99.00 ± 12.80 | 0.202 | 28.84 (−4.69, 62.37) | 1.4 | 107.00 ± 24.10 | 0.061 | 36.41 (−4.09, 76.90) | 1.5 | 133.00 ± 42.30 | <0.001 | 62.59 (6.71, 118.47) | 1.9 | 108.00 ± 14.80 | 0.049 | 37.68 (3.12, 72.23) | 1.5 |
Ct.Po = cortical porosity; Ca.Dm = canal diameter; SHAM = control; OVX = ovariectomy; GC = glucocorticoid; OVX + GC = ovariectomy and glucocorticoid; PTH = parathyroid hormone. Values are reported as mean ± standard deviation. Median values are also reported for those parameters where at least one group was not normally distributed. n = 7. One‐way ANOVA with post hoc Bonferroni tests were employed for normal data. Kruskal–Wallis H tests with post hoc Dunn's tests were employed for non‐normal data. The p values were adjusted for multiple comparisons versus SHAM using Bonferroni method (adj. p = p * 4). Mean/median differences (Group‐SHAM) and confidence intervals (CI) of the mean/median differences are reported from independent t tests for normal data and Hodges–Lehmann tests for non‐normal data. CIs were adjusted for multiple comparisons versus SHAM = 98.75% (1‐α; where α = 0.05/4). Fold changes are reported relative to SHAM (Group/SHAM).
Cortical bone geometry
Representative DIC images are provided in Fig. 4 and all cross‐sectional geometry measures are summarized in Fig. 5. It was evident from these images, as well as the 2D histological and 3D micro‐CT images (Figs. 4G and 3A , respectively), that net resorption occurred at the endosteal surfaces of the two GC‐dosed groups (GC and OVX + GC) with large trench‐like packets of bone being removed (Fig. 4G ). Quantitatively (Table 3), the geometric parameters exhibited individual variability reflected by many outliers but subtle overall fold changes relative to SHAM ranging from 0.8 to 1.2. CIs for GC excluded zero for Tt.Ar (no post hoc), Ct.Ar (adj. p = 0.004), Imin (adj. p = 0.029), Imax (adj. p = 0.068), and Zpol (adj. p = 0.013), all findings indicative of smaller, weaker bones in this group. This pattern was not observed in OVX + GC with the caveat that Ct.Ar (adj. p = 0.065) was reduced relative to SHAM with a CI excluding zero.
Fig 4.
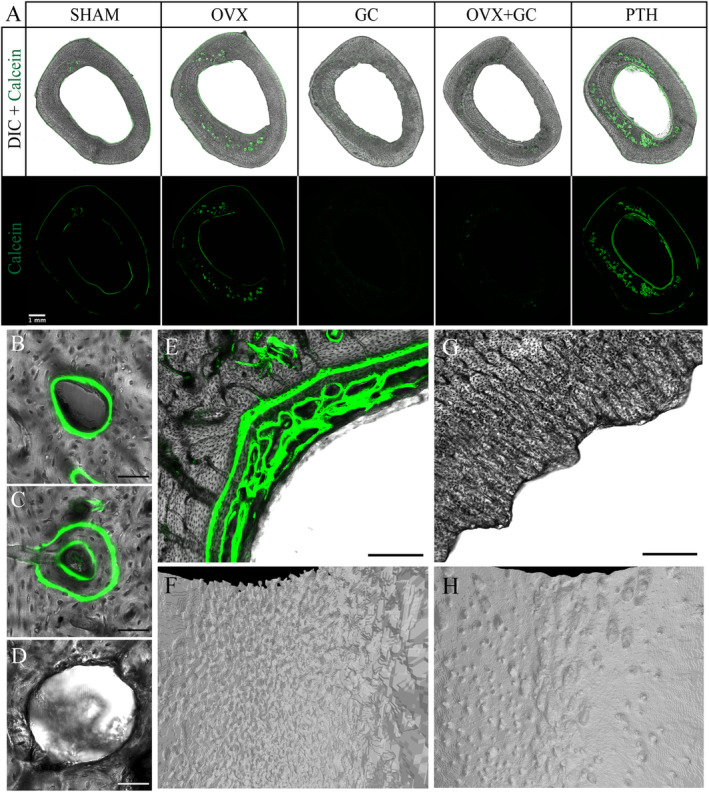
(A) Differential interference contrast (DIC) and fluorescent confocal microscopy images of transverse sections of rabbit tibiae in various treatment groups. Green fluorescent signal from calcein depicts areas of active bone formation. Absent signals from GC‐treated rabbits are due to inhibition of osteoblastic‐mediated bone formation by GC treatment. Scale bar = 1 mm. SHAM = control; OVX = ovariectomy; GC = glucocorticoid; OVX + GC = ovariectomy and glucocorticoid; PTH = parathyroid hormone. (B–D) Representative confocal microscopy images of (B) single‐labeled osteon, (C) double‐labeled osteon, and (D) resorption cavity. Scale bar = 50 μm. (E) Confocal microscopy image of PTH endosteal surface in transverse section. Note the trabecularized appearance of bone formed on the endosteal surface, a feature typical of woven bone. Scale bar = 150 μm. (F) Corresponding three‐dimensional reconstructed micro‐CT image of PTH endosteal surface. (G) Confocal microscopy image of GC endosteal surface in transverse section. Note scalloped appearance of endosteal bone. Scale bar = 150 μm. (H) Corresponding three‐dimensional reconstructed micro‐CT image of GC endosteal surface.
Fig 5.

(A–I) Cortical bone geometry analyses in rabbit tibiae. Data are presented by box plots with individual rabbits plotted as solid circles and outliers plotted as open circles. n = 7. One‐way ANOVA was employed and if p < 0.05, post hoc Bonferroni test was used to compare groups versus SHAM. Adjusted p values (Bonferroni method; adj. p = p * 4 for four‐pairwise comparisons) are shown in graphs. Tt.Ar = total area; Ct.Ar = cortical area; Ma.Ar = marrow area; Ct.Th = cortical thickness; Imin = minimum second moment of area; Imax = maximum second moment of area; Zpol = torsional section modulus; SHAM = control; OVX = ovariectomy; GC = glucocorticoid; OVX + GC = ovariectomy and glucocorticoid; PTH = parathyroid hormone.
Table 3.
Cortical Bone Geometry Parameters
| Parameter | Overall test p | SHAM | OVX | GC | OVX + GC | PTH | ||||||||||||
|---|---|---|---|---|---|---|---|---|---|---|---|---|---|---|---|---|---|---|
| Mean ± SD | Mean ± SD | versus SHAM adj. p | Mean difference (CI) | Fold change | Mean ± SD | versus SHAM adj. p | Mean difference (CI) | Fold change | Mean ± SD | versus SHAM adj. p | Mean difference (CI) | Fold change | Mean ± SD | versus SHAM adj. p | Mean difference (CI) | Fold change | ||
| Tt.Ar (mm2) | 0.059 | 35.20 ± 1.86 | 35.10 ± 3.91 | — | −0.13 (−4.93, 4.67) | 1.0 | 31.30 ± 1.28 | — | −3.85 (−6.36, −1.34) | 0.9 | 34.60 ± 3.33 | — | −0.62 (−4.85, 3.62) | 1.0 | 33.80 ± 1.62 | — | −1.38 (−4.12, 1.36) | 1.0 |
| Ct.Ar (mm2) | 0.001 | 24.40 ± 1.23 | 23.10 ± 2.93 | 0.400 | −1.40 (−4.92, 2.13) | 0.9 | 20.90 ± 1.52 | 0.004 | −3.52 (−5.69, −1.35) | 0.9 | 22.00 ± 1.59 | 0.065 | −2.42 (−4.65, −0.19) | 0.9 | 25.10 ± 0.91 | 0.400 | 6.65 (−1.05, 2.34) | 1.0 |
| Ma.Ar (mm2) | 0.007 | 10.70 ± 1.72 | 12.00 ± 1.83 | 0.400 | 1.26 (−1.53, 4.05) | 1.1 | 10.40 ± 1.42 | 0.400 | −0.33 (−2.80, 2.14) | 1.0 | 12.50 ± 2.46 | 0.342 | 1.80 (−1.53, 5.13) | 1.2 | 8.72 ± 1.90 | 0.221 | −2.02 (−4.87, 0.82) | 0.8 |
| % Ct.Ar (%) | <0.001 | 69.50 ± 3.83 | 65.70 ± 3.49 | 0.363 | −3.82 (−9.57, 1.93) | 0.9 | 66.80 ± 4.19 | 0.400 | −2.78 (−9.08, 3.51) | 1.0 | 63.90 ± 4.25 | 0.061 | −5.63 (−11.97, 0.72) | 0.9 | 74.40 ± 4.59 | 0.144 | 4.80 (−1.83, 11.42) | 1.1 |
| % Ma.Ar (%) | <0.001 | 30.40 ± 3.83 | 34.30 ± 3.49 | 0.363 | 3.82 (−1.93, 9.57) | 1.1 | 33.20 ± 4.19 | 0.400 | 2.78 (−3.51, 9.08) | 1.1 | 36.10 ± 4.25 | 0.061 | 5.63 (−0.72, 11.97) | 1.2 | 25.60 ± 4.59 | 0.144 | −4.80 (−11.42, 1.83) | 0.8 |
| Ct.Th (μm) | 0.019 | 1448.63 ± 88.94 | 1338.49 ± 144.44 | 0.400 | −110.14 (−298.27, 78.00) | 0.9 | 1295.81 ± 161.98 | 0.280 | −152.82 (−357.01, 51.38) | 0.9 | 1247.01 ± 176.85 | 0.076 | −201.61 (−421.16, 17.94) | 0.9 | 1504.26 ± 172.80 | 0.400 | 55.63 (−159.61, 270.88) | 1.0 |
| Imin (mm4) | 0.030 | 59.79 ± 5.82 | 59.88 ± 15.62 | 0.400 | 0.09 (−18.40, 18.58) | 1.0 | 44.92 ± 5.40 | 0.029 | −14.88 (−23.69, −6.06) | 0.8 | 50.10 ± 10.54 | 0.280 | −9.69 (−23.05, 3.67) | 0.8 | 54.22 ± 6.91 | 0.400 | −5.57 (−15.60, 4.46) | 0.9 |
| Imax (mm4) | 0.039 | 125.35 ± 15.98 | 132.22 ± 36.29 | 0.400 | 6.87 (−37.12, 50.85) | 1.1 | 97.16 ± 6.08 | 0.068 | −28.19 (−47.15, −9.22) | 0.8 | 112.65 ± 21.08 | 0.400 | −12.70 (−42.04, 16.64) | 0.9 | 119.14 ± 11.13 | 0.400 | −6.21 (−27.81, 15.39) | 1.0 |
| Zpol (mm3) | 0.019 | 43.40 ± 3.08 | 42.42 ± 8.07 | 0.400 | −0.98 (−10.56, 8.59) | 1.0 | 35.45 ± 2.26 | 0.013 | −7.95 (−12.18, −3.71) | 0.8 | 37.86 ± 4.29 | 0.135 | −5.53 (−11.39, 0.32) | 0.9 | 40.65 ± 3.20 | 0.400 | −2.75 (−7.67, 2.17) | 0.9 |
Tt.Ar = total area; Ct.Ar = cortical area; Ma.Ar = marrow area; Ct.Th = cortical thickness; Imin = minimum second moment of area; Imax = maximum second moment of area; Zpol = torsional section modulus; SHAM = control; OVX = ovariectomy; GC = glucocorticoid; OVX + GC = ovariectomy and glucocorticoid; PTH = parathyroid hormone. Values are reported as mean ± standard deviation. n = 7, except for On.MAR and Ac.f measures for OVX (n = 5) and SHAM (n = 3). One‐way ANOVA with post hoc Bonferroni tests were employed for normal data. The p values were adjusted for multiple comparisons versus SHAM using Bonferroni method (adj. p = p * 4). Mean differences (Group‐SHAM) and confidence intervals (CI) of the mean differences are reported from independent t tests. CIs were adjusted for multiple comparisons versus SHAM = 98.75% (1‐α; where α = 0.05/4). Fold changes are reported relative to SHAM (Group/SHAM).
Cortical bone histomorphometry
The calcein labels revealed active bone formation on the periosteal and endosteal surfaces as well as intracortical bone formation within actively forming osteons (Figs. 4 and 6, Table 4). Formation was most pronounced in the PTH group, particularly at the endosteal surface and intracortically (reflected qualitatively in many geometry parameters in Fig. 5). Conversely, the GC and OVX + GC groups exhibited reduced evidence of labeled bone formation on all surfaces (Fig. 4A ). Because of the lack of formation, measures relying upon calcein labels were not assessable for GC and OVX + GC and were reported as no data (ND) in Table 4. Bone formation at both surfaces, Es.MS/BS and Ps.MS/BS, was increased in the PTH group (CIs excluding zero; adj. p < 0.001 and 0.040, respectively). Endosteal bone formation in PTH had a distinct pattern that included well‐organized lamellar bone in places but also disorganized plates with a crude trabecular‐like pattern reminiscent of woven bone in others (Fig. 4E, F ). Ps.MS/BS was highly variable with large outliers detected for SHAM and OVX.
Fig 6.

(A–J) Histomorphometric analyses of transverse cortical bone sections in rabbit tibiae. Data are presented by box plots with individual rabbits plotted as solid circles and outliers plotted as open circles. n = 7 except for On.MAR and Ac.f measures for OVX (n = 5) and SHAM (n = 3). For sL.On/Ct.Ar, dL.On/Ct.Ar, Rs.N/Ct.Ar, a.Rm.Cr/Ct.Ar, (sL.On + dL.On)/Rs.N, W.Th, and Es.MS/BS, Kruskal–Wallis H tests were employed and if p < 0.05, post hoc Dunn's test was used to compare groups versus SHAM. For On.MAR, Ac.f, and Ps.MS/BS, one‐way ANOVA with post hoc Bonferroni tests were used to compare groups versus SHAM. Adjusted p values using Bonferroni method (adj. p = p * 4 for four‐pairwise comparisons except for Es.MS/BS, Ps.MS/BS, On.MAR, and Ac.f, where adj. p = p * 2 to account for two‐pairwise comparisons) are shown in graphs. sL.On = single‐labeled osteon; dL.On = double‐labeled osteon; Rs.N = resorption cavities; a.Rm.Cr = active remodeling centers; Ct.Ar = cortical area; W.Th = wall thickness; On.MAR = osteonal mineral apposition rate; Ac.f = activation frequency; Es = endosteal; Ps = periosteal; MS/BS = mineralizing surface per bone surface; SHAM = control; OVX = ovariectomy; GC = glucocorticoid; OVX + GC = ovariectomy and glucocorticoid; PTH = parathyroid hormone.
Table 4.
Cortical Bone Histomorphometric Parameters
| Parameter | Overall test p | SHAM | OVX | GC | OVX + GC | PTH | ||||||||||||
|---|---|---|---|---|---|---|---|---|---|---|---|---|---|---|---|---|---|---|
| Mean ± SD (median) | Mean ± SD (median) | versus SHAM adj. p | Mean/median difference (CI) | Fold change | Mean ± SD (median) | versus SHAM adj. p | Mean/median difference (CI) | Fold change | Mean ± SD (median) | versus SHAM adj. p | Mean/median difference (CI) | Fold change | Mean ± SD (median) | versus SHAMadj. p | Mean/median difference (CI) | Fold change | ||
| sL.On/Ct.Ar (mm−2) | 0.001 |
0.21 ± 0.16 (0.16) |
0.99 ± 0.49 (0.99) |
0.080 |
0.80 (0.13, 1.42) |
4.1 |
0.44 ± 0.57 (0.05) |
1.000 |
–0.03 (−0.31, 1.12) |
2.1 |
0.26 ± 0.22 (0.32) |
1.000 |
0.02 (−0.28, 0.42) |
1.2 |
1.80 ± 0.91 (1.73) |
0.004 |
1.59 (0.34, 2.92) |
8.4 |
| dL.On/Ct.Ar (mm−2) | <0.001 |
0.04 ± 0.05 (0.00) |
0.62 ± 0.41 (0.81) |
0.124 |
0.78 (0.00, 0.95) |
15.4 |
0.01 ± 0.02 (0.00) |
1.000 |
0.00 (−0.08, 0.00) |
0.2 |
0.01 ± 0.02 (0.00) |
1.000 |
0.00 (−0.08, 0.00) |
0.2 |
1.05 ± 0.55 (0.91) |
0.008 |
0.91 (0.42, 1.81) |
26.3 |
| Rs.N/Ct.Ar (mm−2) | <0.001 |
0.05 ± 0.05 (0.04) |
0.49 ± 0.40 (0.27) |
0.060 |
0.23 (0.07, 1.00) |
10.7 |
0.47 ± 0.41 (0.27) |
0.064 |
0.23 (0.11, 1.22) |
10.1 |
0.80 ± 0.50 (0.65) |
<0.001 |
0.61 (0.19, 1.52) |
17.5 |
1.03 ± 0.41 (1.10) |
<0.001 |
1.01 (0.37, 1.64) |
22.4 |
| a.Rm.Cr/Ct.Ar (mm−2) | <0.001 |
0.30 ± 0.17 (0.31) |
2.10 ± 1.15 (2.78) |
0.008 |
2.43 (0.23, 2.92) |
7.0 |
0.92 ± 0.81 (0.62) |
0.576 |
0.38 (−0.13, 2.16) |
3.1 |
1.07 ± 0.66 (0.91) |
0.168 |
0.60 (0.04, 1.86) |
3.6 |
3.87 ± 1.59 (4.00) |
<0.001 |
3.68 (1.51, 5.60) |
12.9 |
| (sL.On + dL.On)/Rs.N | 0.003 |
4.40 ± 3.02 (4.00) |
4.97 ± 4.39 (3.00) |
1.000 |
0.33 (−5.80, 8.33) |
1.1 |
1.66 ± 2.58 (0.09) |
0.100 |
−2.33 (−7.00, 2.50) |
0.4 |
0.37 ± 0.29 (0.37) |
0.008 |
−3.63 (−8.62, −0.63) |
0.1 |
2.93 ± 1.15 (2.90) |
1.000 |
−1.38 (−6.05, 2.22) |
0.7 |
| W.Th (μm) | 0.093 |
44.49 ± 0.59 (44.15) |
44.56 ± 1.57 (44.19) |
— |
0.04 (−2.21, 2.36) |
1.0 |
45.63 ± 2.89 (45.71) |
— |
1.42 (−4.04, 4.51) |
1.0 |
46.34 ± 1.37 (46.39) |
— |
1.34 (−0.19, 3.94) |
1.0 |
45.11 ± 1.29 (45.08) |
1.000 |
0.43 (−1.15, 2.54) |
1.0 |
| On.MAR (μm/d) | 0.013 | 1.77 ± 0.21 | 2.35 ± 0.40 | 0.031 |
0.58 (−0.18, 1.34) |
1.3 | ND | ND | ND | ND | ND | ND | ND | ND | 2.45 ± 0.19 | 0.009 |
0.68 (0.30, 1.06) |
1.4 |
| Ac.f (#/mm2/yr) | 0.012 | 4.04 ± 1.89 | 32.43 ± 16.28 | 0.203 |
28.39 (−0.53, 57.31) |
8.0 | ND | ND | ND | ND | ND | ND | ND | ND | 57. 54 ± 27.98 | 0.008 |
53.49 (7.45, 99.54) |
14.2 |
| Es.MS/BS (%) | <0.001 | 23.65 ± 13.01 | 27.39 ± 23.26 | 0.667 |
3.73 (−22.06, 29.52) |
1.2 | ND | ND | ND | ND | ND | ND | ND | ND | 84.84 ± 13.17 | <0.001 |
61.19 (43.27, 79.11) |
3.6 |
| Ps.MS/BS (%) | 0.027 |
18.44 ± 15.34 (13.75) |
21.34 ± 26.67 (7.98) |
1.000 |
2.75 (−37.69, 27.40) |
1.2 | ND | ND | ND | ND | ND | ND | ND | ND |
48.58 ± 8.77 (47.35) |
0.040 |
33.14 (9.35, 47.51) |
2.6 |
sL.On = single‐labeled osteon; dL.On = double‐labeled osteon; Rs.N = resorption cavities; a.Rm.Cr = active remodeling centers; Ct.Ar = cortical area; W.Th = wall thickness; On.MAR = osteonal mineral apposition rate; Ac.f = activation frequency; Es = endosteal; Ps = periosteal; MS/BS = mineralizing surface per bone surface; SHAM = control; OVX = ovariectomy; GC = glucocorticoid; OVX + GC = ovariectomy and glucocorticoid; PTH = parathyroid hormone; ND = no data. Values are reported as mean ± standard deviation. Median values are also reported for those parameters where at least one group was not normally distributed. n = 7. One‐way ANOVA with post hoc Bonferroni tests were employed for normal data. Kruskal–Wallis H tests with post hoc Dunn's tests were employed for non‐normal data. The p values were adjusted for multiple comparisons versus SHAM using Bonferroni method (adj. p = p * 4). GC and OVX + GC were not analyzed for On.MAR, Ac.f, Es.MS/BS, and Ps.MS/BS because of a lack of detected labels and thus the p values were adjusted accordingly (adj. p = p * 2). Mean/median differences (Group‐SHAM) and confidence intervals (CI) of the mean differences are reported from independent t tests for normal data and Hodges–Lehmann tests for non‐normal data. CIs were adjusted for multiple comparisons: 98.75% for four‐pairwise comparisons (1‐α; where α = 0.05/4) and 97.5% for two‐pairwise comparisons (1‐α; where α = 0.05/2). Fold changes are reported relative to SHAM (Group/SHAM).
Evidence of elevated remodeling was most dramatically (8.4‐ to 26.3‐fold increases) and consistently observed in PTH for sL.On/Ct.Ar (adj. p = 0.004), dL.On/Ct.Ar (adj. p = 0.008), Rs.N/Ct.Ar (adj. p < 0.001), a.Rm.Cr/Ct.Ar (adj. p < 0.001), and Ac.f (adj. p = 0.008) as reflected by CIs excluding zero. OVX exhibited a similar but less pronounced pattern (fold changes approximately half those of PTH) for these parameters with the caveat that the CI for Ac.f (adj. p = 0.203) included but was strongly offset from zero. For the glucocorticoid groups, Rs.N/Ct.Ar was elevated 10.1‐ and 17.5‐fold for GC (adj. p = 0.064) and OVX + GC (adj. p < 0.001), respectively, with CIs excluding zero. The ratio of labeled osteons to resorption cavities (sL.On + dL.On)/Rs.N was 0.1‐ and 0.4‐fold that of SHAM for OVX + GC (adj. p = 0.008) and GC (adj. p = 0.100), respectively, with the CI for the former excluding zero and the latter strongly offset from it.
Trabecular bone micro‐CT
Fig. 7A presents 3D renders of a portion of the VOI used for analysis of trabecular morphology. Overall, although fold changes (0.8 to 1.2) were more subtle than many of the cortical parameters, a pattern of loss was observed for OVX, GC, and OVX + GC groups, whereas the opposite was observed for PTH (Table 5 and Fig. 7B–E ). A similar‐sized reduction in BV/TV was observed in GC (adj. p = 0.024), OVX + GC (adj. p = 0.016), and OVX (adj. p = 0.448) with the CIs excluding (GC and OVX + GC) or strongly offset from zero (OVX). Conversely, PTH (adj. p = 0.880) exhibited the opposite pattern with the largest positive fold change (1.2) in BV/TV with a CI strongly offset from zero. Differences in Tb.N supported the overall patterns of change in BV/TV with CIs consistently excluding or being strongly offset from zero (adj. p < 0.05 for all groups). The outcomes for Tb.Sp and Tb.Th were less definitive, exhibiting the lowest fold changes (0.9 to 1.2) and CIs clustered about zero with the caveat that Tb.Sp for GC (adj. p = 0.124) and OVX + GC (adj. p = 0.155) had CIs just including zero.
Fig 7.

Micro‐CT‐based analyses of trabecular bone in rabbit tibiae. (A) Three‐dimensional reconstructed images of epiphyseal subchondral trabecular bone structure in rabbit tibiae of various treatment groups. Regions of trabecular bone are highlighted in yellow. Scale bar = 1 mm. (B–E) Three‐dimensional trabecular bone analyses in rabbit tibiae. Data are presented by box plots with individual rabbits plotted as solid circles and individual outliers plotted as open circles. n = 7. For Tb.Th and BV/TV, one‐way ANOVA was employed and if p < 0.05, post hoc Bonferroni test was used to compare groups versus SHAM. For Tb.Sp and Tb.N, Kruskal–Wallis H test with post hoc Dunn's test was used to compare groups versus SHAM. Adjusted p values (Bonferroni method; adj. p = p * 4 for four‐pairwise comparisons) are shown in graphs. BV/TV = bone volume/tissue volume; Tb.Th = trabecular thickness; Tb.N = trabecular number; Tb.Sp = trabecular separation; SHAM = control; OVX = ovariectomy; GC = glucocorticoid; OVX + GC = ovariectomy and glucocorticoid; PTH = parathyroid hormone.
Table 5.
Micro‐CT Trabecular Bone Parameters
| Parameter | Overall test p | SHAM | OVX | GC | OVX + GC | PTH | ||||||||||||
|---|---|---|---|---|---|---|---|---|---|---|---|---|---|---|---|---|---|---|
| Mean ± SD (median) | Mean ± SD (median) | versus SHAM adj. p | Mean/median difference (CI) | Fold change | Mean ± SD (median) | versus SHAM adj. p | Mean/median difference (CI) | Fold change | Mean ± SD (median) | versus SHAM adj. p | Mean/median difference (CI) | Fold change | Mean ± SD (median) | versus SHAM adj. p | Mean/median difference (CI) | Fold change | ||
| BV/TV (%) | <0.001 |
40.73 ± 3.97 (37.93) |
34.94 ± 3.57 (35.49) |
0.448 |
−4.90 (−12.00, 0.87) |
0.9 |
31.01 ± 5.33 (33.48) |
0.024 |
−8.87 (−17.42, −2.33) |
0.8 |
32.45 ± 1.54 (32.77) |
0.016 |
−7.77 (−14.13, −4.10) |
0.8 |
49.60 ± 5.62 (49.36) |
0.880 |
8.28 (−0.84, 17.68) |
1.2 |
| Tb.Th (mm) | 0.065 |
0.20 ± 0.01 (0.20) |
0.20 ± 0.01 (0.20) |
— |
0.00 (−0.02, 0.01) |
1.0 |
0.19 ± 0.02 (0.19) |
— |
−0.01 (−0.05, 0.01) |
0.9 |
0.20 ± 0.02 (0.21) |
— |
0.00 (−0.03, 0.02) |
1.0 |
0.21 ± 0.01 (0.21) |
— |
0.01 (−0.01, 0.02) |
1.0 |
| Tb.Sp (mm) | 0.018 | 0.44 ± 0.06 | 0.53 ± 0.10 | 0.060 |
0.09 (−0.04, 0.22) |
1.2 | 0.52 ± 0.05 | 0.124 |
0.08 (0.00, 0.16) |
1.2 | 0.52 ± 0.04 | 0.155 |
0.08 (0.00, 0.15) |
1.2 | 0.44 ± 0.07 | 0.400 |
−0.01 (−0.10, 0.09) |
1.0 |
| Tb.N (mm−1) | <0.001 | 2.02 ± 0.17 | 1.75 ± 0.17 | 0.048 |
−0.26 (−0.53, 0.00) |
0.9 | 1.65 ± 0.16 | 0.003 |
−0.37 (−0.63, −0.11) |
0.8 | 1.65 ± 0.12 | 0.003 |
−0.37 (−0.60, −0.14) |
0.8 | 2.36 ± 0.27 | 0.006 |
0.34 (−0.01, 0.69) |
1.2 |
BV/TV = bone volume/tissue volume; Tb.Th = trabecular thickness; Tb.N = trabecular number; Tb.Sp = trabecular separation; SHAM = control; OVX = ovariectomy; GC = glucocorticoid; OVX + GC = ovariectomy and glucocorticoid; PTH = parathyroid hormone.Values are reported as mean ± standard deviation. Median values are also reported for those parameters where at least one group was not normally distributed. n = 7. One‐way ANOVA with post hoc Bonferroni tests were employed for normal data. Kruskal–Wallis tests with post hoc Dunn's tests were employed for non‐normal data. The p values were adjusted for multiple comparisons versus SHAM using Bonferroni method (adj. p = p * 4). Mean/median differences (Group‐SHAM) and confidence intervals (CI) of the mean/median differences are reported from independent t tests for normal data and Hodges–Lehmann tests for non‐normal data. CIs were adjusted for multiple comparisons versus SHAM = 98.75% (1‐α; where α = 0.05/4). Fold changes are reported relative to SHAM (Group/SHAM).
Discussion
In general, the animals tolerated the OVX/sham surgeries well and weight gain was observed in three of the groups during the pre‐dosing period (SHAM, OVX, and OVX + GC) and suggested by offset CIs for the fourth (GC). Glucocorticoid dosing was not as well tolerated by the animals and weight loss was observed during the dosing period, an observation consistent with past studies for GC( 51 ) and OVX + GC.( 55 ) Three of the GC rabbits had a more extreme reaction to treatment, exhibiting hair textural changes, although it is unclear if this might have been linked to early (pre‐dosing) lack of weight gain observed in this group. Notably, the 1.5 mg/kg/d dose we administered is moderate to high in the context of existing literature and 2 mg/kg/d has been reported as lethal.( 44 ) Further, administering lower doses (1 mg/kg/d) over longer lengths of time (6 weeks) had also resulted in the premature death of one animal.( 55 ) As such, increasing GC dose or the length of dosing to possibly induce larger‐scale differences in cortical bone parameters may not be feasible in terms of animal welfare. PTH dosing was well tolerated by the animals. Although they exhibited weight loss over the dosing period, it was less pronounced than that observed in the GC‐dosed groups. Hirano and colleagues( 41 ) found a similar decrease in weight after dosing rabbits with 40 μg/kg/5 days a week of PTH for 20 weeks.
The characterization of cortical porosity in the OP models and PTH was our primary objective. Comparative data are limited as cortical porosity is only sparsely reported in the literature for rabbit OP models. In a recent report, Chandler and colleagues( 55 ) observed no difference in Ct.Po at the femoral mid‐diaphysis between SHAM (0.50%) and OVX (0.43%) groups at 18 weeks post‐surgery, whereas their OVX + GC group (dosed for 12 weeks commencing 6 weeks after OVX) had elevated Ct.Po (9.75%). It is unclear what underpins their lack of a difference for OVX compared with our study. It could relate to the different skeletal elements studied (femur versus tibia), relative location of the VOI (mid‐shaft versus distal shaft), the larger (15 μm) voxel size used, and/or Chandler and colleagues’ longer duration post‐surgery. Regarding the latter, their longer post‐surgery phase for OVX, at 18 weeks versus our 12 weeks, may have enabled more time for cortical remodeling to reach steady state (see discussion of Ac.f below). PTH had the most pronounced difference in Ct.Po, a result consistent with recent reports. Yamane and colleagues( 39 ) reported a Ct.Po of 3.62% in rabbit tibiae after treatment with 40 μg/kg/d of PTH for 4 weeks, assessed using micro‐CT at a 19.1‐μm voxel size, whereas Zebaze and colleagues( 42 ) reported a higher Ct.Po of 8.7% in rabbit femora using the same dosing regimen and imaging at 15‐μm voxel size.
Across all groups, qualitative inspection of the images suggested the cortical pores did not appear to be randomly distributed; rather, they were frequently clustered in the mid‐cortex. The reason underpinning this is unclear, although it may be linked to developmental features and the localized age of the tissue. In rats, central bands or “islands” of calcified cartilage have been observed, indicating remnants of developmental tissues in the mid‐cortex.( 64 , 65 ) It is unclear if this was the case in our rabbits, although the central cortex had distinctly complex microarchitecture when compared with more organized lamellar bone, which was particularly evident at the periosteal surface. Mid‐cortical porosity in PTH contrasts with observations by Zebaze and colleagues( 42 ) and Hirano and colleagues( 40 ) who reported increased porosity primarily adjacent to the marrow cavity in the proximal femur and tibial midshaft of rabbits, respectively. It is unclear if these endosteal pores reported by others may be related to the endosteal bone formation we observed.
Mean Ca.Dm values for SHAM were slightly lower (70 μm) than anticipated for remodeling‐related resorption spaces in rabbits. This 3D micro‐CT measure, however, includes all resolved pores ranging in size from the maximal diameter of cutting cones, down through the contracting diameter of the closing cones and, ultimately, approaching the normal scale of mature quiescent canals. The latter were not resolved by our micro‐CT protocol (Supplemental Fig. S1). The distribution of Ca.Dm (Fig. 3D ) for SHAM did reveal a peak in values at the expected 100μm size for secondary osteons/resorption spaces in rabbits. The distributions of Ca.Dm were very similar for OVX and PTH, and their modal values (~100 μm) corresponded closely with the peak in SHAM. This suggests that the maximal diameters of the resorption spaces created in these groups are similar and of a scale consistent with past reports of normal secondary osteon size in rabbits. Conversely, the GC‐dosed groups exhibited distributions skewed toward larger Ca.Dm, suggesting larger initial resorption spaces or the coalescence of spaces in the cortex. Two‐dimensional data (Supplemental Fig. S2) corroborate that pore sizes were increased in the GC‐dosed groups but also in PTH. Zebaze and colleagues( 42 ) have suggested PTH produces larger pores by enlarging existing canals, which then coalesce, evidenced by micro‐CT analysis.
Our secondary objective was to test the hypothesis that elevations in cortical porosity are associated with increased remodeling rates in these rabbit OP models. Activation frequency represents the most direct measure of the rate of remodeling as it is a measure of the birth rate of new BMUs. That said, this measure presented several challenges for our study. First, both GC‐dosed groups exhibited little sign of bone formation, rendering measures relying upon the labeled structures unassessable for these groups. This was consistent with the primary mechanism of GC‐induced bone loss via osteoblast suppression.( 66 ) The low numbers of double‐labeled osteons in SHAM and OVX, including their absence in some animals, further complicated the assessment of Ac.f, which requires labeled osteons in its numerator and osteon formation time (σf = W.Th/On.MAR) in its denominator. This reduced the number of animals available for the comparisons of this parameter, diminishing statistical power and, thus, the generalizability of the results should be interpreted with caution. Finally, a key basis of this estimation of BMU birth rate is the assumption of a steady state where the same number of BMUs (generally quantified as labeled osteons) are being “born” and “dying.” Given that we expected elevation in remodeling rate for the OP models and that it has been previously demonstrated for PTH, this assumption is dubious in our case. Further, equal birth and death rates for duration of the newly established σf is needed to reach a new steady state after experimental perturbation.( 10 ) Osteon formation time (σf) assessed in our study (based upon mean W.Th and On.MAR reported in Table 4) was approximately 25, 19, and 18 days for SHAM, OVX, and PTH, respectively. There simply was not enough time in our 28‐day dosing period, with calcein labels first administered at the midpoint, for a new steady state to have occurred for PTH and GC. Whether or not the OVX group had reached a new steady state is less clear, but it is more plausible since the first calcein label was administered 69 and 70 days after surgery. Despite these limitations, we have reported Ac.f here to facilitate comparison with existing studies (which may also not meet the underlying assumptions) and, in the case of OVX rabbits (8‐fold increase relative to SHAM with the caveat that adj. p = 0.203), provide novel, albeit limited, data to the literature. Our Ac.f value for PTH was 14‐fold higher than SHAM, a result that aligns well with a previous study of rabbits dosed with 40 μg/kg/d, 5 days per week for 20 weeks where Ac.f was reported to increase 20‐fold in tibiae (43.8).( 41 ) The higher Ac.f for PTH was associated with increased sL.On/Ct.Ar, dL.On/Ct.Ar, and Rs.N/Ct.Ar—findings again consistent with this previous PTH trial.( 41 ) Ac.f was also reported in rabbits receiving a lower dose of PTH, 10 μg/kg/5 days per week, for 35 days. Because of this lower dose, Mashiba and colleagues( 67 ) reported only a 2‐fold increase in Ac.f (29.3) in comparison to aged‐matched controls. Although it has become standard to include only labeled osteons in Ac.f, Frost's early description indicated the numerator of Ac.f should be “the number of bone‐forming or resorbing centers.” (10 ) Thus, to overcome some of the limitations of Ac.f, and provide a measure of overall remodeling rate/activity that included the GC‐dosed groups, we calculated a measure of active remodeling centers, a.Rm.Cr/Ct.Ar, which was not normalized to any assumption about osteon formation time and included both labeled osteons and resorption spaces. By this measure, OVX and PTH were elevated related to SHAM 7‐ and 13‐fold, respectively, and the approximately 3‐fold increases for GC and OVX + GC support the conclusion of a difference in those groups as well. This observation for the glucocorticoid groups was corroborated by the large fold changes in Rs.N/Ct.Ar. OVX and PTH also exhibited elevated radial mineral apposition rates (On.MAR) within forming osteons, providing corroborating evidence of an increase in the formative activity of BMUs. Conversely, the ratio of labeled osteons to resorption cavities ((sL.On + dL.On)/Rs.N) was reduced for OVX + GC (0.1‐fold) and GC (0.4‐fold), indicating a lack of transition from bone resorption to formation (uncoupling( 17 , 18 , 19 )) in the glucocorticoid groups. Taken together, the histomorphometric data support the hypothesis that the rate of remodeling was elevated in all of these OP models.
Measures of cortical geometry and associated bone strength were relatively stable across groups, which was not unexpected given the skeletal maturity of the animals and the short duration of the experiments. Distinct endosteal resorption was observed in the glucocorticoid groups whereby large packets of bone were being resorbed with no evidence of formation. Whether these spaces reflect uncoupled BMUs( 17 , 18 , 19 ) or a negative (resorptive) modeling drift( 10 ) is perhaps a semantic point. It did not appear that these resorptions represented trabecularization of the cortex created by coalescence of numerous individual BMUs. This pattern of endosteal bone loss did have sufficient time to produce definitive differences in cortical geometry compared with SHAM, although the results did reveal smaller, weaker bones for GC. Notably, thinning of cortices through increased endocortical bone resorption has been reported in GC‐treated rats.( 68 ) A previous report noted decreased cortical bone volume in GC‐treated rabbits.( 51 ) For OVX + GC, Liu and colleagues( 45 ) reported no significant changes in Ct.Th, whereas Chandler and colleagues( 55 ) found significantly lower Ct.Ar and Ct.Th.
Endosteal bone apposition induced by PTH administration has been well documented in animal( 39 , 40 , 41 , 67 , 69 ) and human studies, 70 , 71 ) and it has been suggested that this bone formation may be compensating for the increase in intracortical porosity to limit negative biomechanical effects.( 41 , 72 ) We observed extensive endosteal bone formation for PTH, which uniquely had a trabecular‐like appearance in 2D and 3D (Fig. 4E, F ). It has been suggested that this may be poorly developed woven bone,( 39 ) a tissue type formed in states of high turnover/growth. Previous PTH rabbit studies have demonstrated small decreases in Ma.Ar( 41 ) and increases in Ct.Ar.( 40 , 41 , 67 ) Hirano and colleagues( 41 ) also found rabbits treated with PTH increased Tt.Ar, which was associated with periosteal bone formation, whereas several other large animal studies showed that the measure remained unchanged.( 67 , 72 , 73 ) We observed increased bone formation at both the endosteal and periosteal surfaces for PTH, and although the changes to overall geometry were subtle (perhaps because of the short dosing period), the mean values do support a pattern trending toward increased %Ct.Ar and Ct.Th along with decreased %Ma.Ar for PTH.
Our final objective was to contrast trabecular bone differences in the proximal tibia to facilitate contextual comparisons within the literature and compare effects across bone morphotypes. Previous reports are conflicted with respect to the effect of OVX on trabecular bone microarchitecture with one observing changes( 74 ) and two others reporting no change relative to sham‐operated controls.( 45 , 46 ) For the former, BV/TV and Tb.N were reduced and Tb.Sp increased in OVX rabbits compared with controls( 74 ) at 27 weeks post OVX. Our OVX results are consistent with this single report of decreased BV/TV driven by loss of trabeculae (reduced Tb.N). GC has been reported to reduce BV/TV( 46 ) as well as reduce Tb.Th and Tb.N,( 51 ) while OVX + GC rabbits have also been reported to have reduced Tb.N, Tb.Th, Tb.Sp, and BV/TV.( 45 , 46 , 54 ) Again, our findings of reduced BV/TV driven by a decline in Tb.N for both glucocorticoid groups are consistent with these previous reports.
Trabecular bone formation induced by PTH administration has been extensively characterized in animal and human studies, 75 , 76 , 77 , 78 , 79 , 80 ) although increases in rabbit trabecular bone have been less consistent. In the lumbar vertebrae of rabbits, PTH at a dose of 10 μg/kg/d for 35 days increased BV/TV and Tb.Th; however, continuing PTH administration for an additional 35 days resulted in no differences in these parameters.( 67 ) Hirano and colleagues( 41 ) also reported no difference in trabecular parameters when rabbits were treated with 40 μg/kg/d for 20 weeks. We observed a pattern of increased BV/TV with associated higher Tb.N in PTH, which is consistent with the early effects reported for rabbit lumbar vertebrae.
This study has several limitations. First, although our group sizes (n = 7) match the scale utilized in previous characterizations of the rabbit for trabecular bone and cortical geometry/density,( 44 , 45 , 53 , 54 ) a great deal of variation was observed for many parameters, including outliers. Given there were no grounds to exclude them, all outliers were retained within our quantitative analyses. These factors ultimately limited our statistical power and certainly contributed to the uncertainty in a number of parameter changes despite considerable fold changes. Caution is thus warranted when determining significance of changes based upon p values alone, particularly where adjustments for multiple tests can make these comparisons occur on a very small scale. Consideration of CIs adds important contextual information, but it must also be recognized that CIs are directly related to α. The necessity of additional tests to calculate adjusted CI and discrepancies detected with the primary statistical tests further highlight the perils of relying strictly on p value for analysis and thus our discussion of results has avoided dichotomization based upon p value and embraced uncertainty. As already noted, sample size limitations were further exacerbated by the lack of labeling in the GC‐dosed groups and the low numbers of double‐labeled osteons in OVX and SHAM. Second, for our micro‐CT analysis, we employed an imaging resolution (10 μm voxels) that was effective at detecting porosity on the scale of remodeling‐related resorption spaces; however, it was insufficient to detect all vascular‐level cortical porosity in rabbit bone (Supplemental Fig. S1). Further, although this approach was effective at detecting resorption spaces, it is not exclusive to them, and larger canals that were not actively remodeling as well as some of the porosity associated with endosteal bone formation (particularly evident in the PTH group) contributed to the overall Ct.Po measure. Although the lack of bone formation observed within the GC‐dosed groups is consistent with uncoupling within the BMU associated with GC treatment reported by Andreasen and colleagues,( 17 ) the shift toward larger sizes suggests a further disruption of BMU regulation through either a coalescence of resorption spaces (initiation and/or steering) or an increase in the size of individual spaces. Third, turning to our histological measures, a limitation of our measure of Rs.N/Ct.Ar and hence also a.Rm.Cr/Ct.Ar was the fact that not all large spaces observed in the histological images could be confirmed as actively resorbing at the end of the experiment. This was particularly the case for the OVX groups (OVX and OVX + GC), which had a longer time frame during which remodeling could be initiated and potentially halted/uncoupled. That said, because of our inclusion of only those spaces with roughly eroded surfaces, no lamellar bone formation, and no calcein labeling, it is a fair assumption that these spaces overwhelmingly represented recently active events induced by OVX and/or subsequent dosing. A more refined delineation of pores (ie, eroded, mixed eroded and formative, formative and quiescent pores) has recently been described( 81 ) and presents a potential path forward for estimating the relative size/duration of the different phases of the BMU through their relative occurrences in 2D section. Such analysis paired with 3D morphological analysis of BMUs by micro‐CT holds great potential for advancing our understanding of BMU spatio‐temporal coordination. Expanding analysis beyond pores to the vasculature contained within them also holds great potential( 82 ) as factors like age and corticosteroids reduce bone perfusion while PTH has been shown to increase it.( 83 ) Finally, a detailed analysis of the biomechanical impacts of increased porosity was beyond the scale of this study. Given the non‐random distribution of cortical pores visually apparent across all the groups, a more detailed analysis of the interplay of mechanical axes and regional variation of bone microarchitecture across all envelopes (periosteal, intracortical, and endosteal) is certainly warranted. Any direct mechanical testing would have to carefully consider the sampling site because this non‐random distribution of porosity would certainly impact local bone material properties.
Our findings indicated that cortical porosity was elevated many fold for all treatments with the caveat that the data were the least robust for GC. Histomorphometric measures supported the hypothesis that remodeling rate was elevated in all groups. For trabecular bone, a pattern of loss was observed for OVX, GC, and OVX + GC groups, whereas the opposite was observed for PTH. The viability of the OVX model, in particular, adds new evidence to the conflicted literature. Overall, our results are encouraging for the further exploration of the role of cortical bone loss in OP using rabbits and highlight the need to consider both cortical and trabecular changes when looking at systemic bone loss. These rabbit models also have great potential to serve as a platform for more detailed analyses of BMU spatio‐temporal coordination and the balance between bone resorption and formation within individual remodeling events, which cumulatively determine skeletal health. In this pursuit, in vivo imaging( 3 , 26 ) will certainly prove illuminating.
Disclosures
All authors state that they have no conflicts of interest.
Peer review
The peer review history for this article is available at https://publons.com/publon/10.1002/jbmr.4124.
Supporting information
Supplemental Fig. S1. Micro‐CT Ca.Dm resolution dependency.
Supplemental Fig. S2. Validation of micro‐CT assessment of Ca.Dm.
Supplemental Fig. S3. Variation in cortical porosity within the tibial diaphysis.
Supplemental Table S1. Validation of Micro‐CT Assessment of Ca.Dm
Acknowledgments
This research was funded by the Canadian Institutes of Health Research (catalyst grant FRN:151724 to DMLC, TA, and AP), the Natural Sciences and Engineering Research Council (discovery grant RGPIN‐2014‐05563 to DMLC) of Canada as well as the Canada Research Chairs program (DMLC). The authors acknowledge the help and support of the University of Saskatchewan Laboratory Animals Service Unit (LASU), which was critical to the success of this project. We also acknowledge the assistance of Dr Ingrid Pickering and her lab personnel for assistance with the confocal microscopy imaging. Finally, the authors dedicate this work in the memory of the late John G Clement of the University of Melbourne, whose encouragement and friendship over the last decade was instrumental in setting this program of research in motion.
Authors’ roles: Study design: KDH, BDH, AP, JMA, TA, PP, and DMLC. Study conduct: KDH, BDH, AP, AMA, KJS, and DMLC. Data collection: KDH, BDH, AP, AMA, GK, KJS, and DMLC. Data analysis: KDH, BDH, AMA, GK, and DMLC. Data interpretation: KDH, BDH, GK, TA, PP, and DMLC. Drafting manuscript: KDH, BDH, and DMLC. Revising manuscript content: KDH, BDH, AP, JMA, AMA, GK, TA, KJS, PP, and DMLC. Approving final version of manuscript: KDH, BDH, AP, JMA, AMA, GK, TA, KJS, PP, and DMLC. DMLC takes responsibility for the integrity of the data analysis.
Author contributions: KDH: Conceptualization; data curation; formal analysis; investigation; methodology; visualization; writing‐original draft; writing‐review and editing. BDH: Conceptualization; data curation; formal analysis; investigation; methodology; visualization; writing‐original draft; writing‐review and editing. AP: Conceptualization; funding acquisition; investigation; methodology; visualization; writing‐review and editing. JMA: Conceptualization; methodology; writing‐review and editing. AMA: Data curation; formal analysis; investigation; methodology; visualization; writing‐review and editing. GK: Data curation; methodology; validation; visualization; writing‐review and editing. TA: Conceptualization; funding acquisition; methodology; supervision; writing‐review and editing. KJS: Investigation; methodology; writing‐review and editing. PP: Conceptualization; funding acquisition; methodology; writing‐review and editing. DMLC: Conceptualization; data curation; formal analysis; funding acquisition; investigation; methodology; project administration; supervision; writing‐original draft; writing‐review and editing.
References
- 1.International osteoporosis Foundation ”Osteoporosis” [Internet]. https://www.iofbonehealth.org/osteoporosis. Accessed September 19, 2020.
- 2. WHO . WHO Scientific Group on the assessment of osteoporosis at the primary health care level. Brussels: WHO Press; 2004. [Google Scholar]
- 3. Harrison KD, Cooper DM. Modalities for visualization of cortical bone remodeling: the past, present, and future. Front Endocrinol. 2015;6:122. [DOI] [PMC free article] [PubMed] [Google Scholar]
- 4. Cooper DM, Kawalilak CE, Harrison K, Johnston BD, Johnston JD. Cortical bone porosity: what is it, why is it important, and how can we detect it? Curr Osteoporos Rep. 2016;14(5):187–98. [DOI] [PubMed] [Google Scholar]
- 5. Bala Y, Zebaze R, Seeman E. Role of cortical bone in bone fragility. Curr Opin Rheumatol. 2015;27(4):406–13. [DOI] [PubMed] [Google Scholar]
- 6. McCalden RW, McGeough JA, Barker MB, Court‐Brown CM. Age related changes in the tensile properties of cortical bone. J Bone Joint Surg. 1993;75A(8):1193–205. [DOI] [PubMed] [Google Scholar]
- 7. Cooper DML, Thomas CDL, Clement JG, Turinsky AL, Sensen CW, Hallgrímsson B. Age‐dependent change in the 3D structure of cortical porosity at the human femoral midshaft. Bone. 2007;40(4):957–65. [DOI] [PubMed] [Google Scholar]
- 8. Zebaze R, Seeman E. Cortical bone: a challenging geography. J Bone Miner Res. 2015;30(1):24–9. [DOI] [PubMed] [Google Scholar]
- 9. Poole KE, Treece GM, Mayhew PM, et al. Cortical thickness mapping to identify focal osteoporosis in patients with hip fracture. PLoS One. 2012;7(6):e38466. [DOI] [PMC free article] [PubMed] [Google Scholar]
- 10. Frost HM. Tetracycline‐based histological analysis of bone remodeling. Calcif Tissue Res. 1969;3(3):211–37. [DOI] [PubMed] [Google Scholar]
- 11. Parfitt AM. Osteonal and hemi‐osteonal remodeling: the spatial and temporal framework for signal traffic in adult human bone. J Cell Biochem. 1994;55(3):273–86. [DOI] [PubMed] [Google Scholar]
- 12. Parfitt AM. The coupling of bone formation to bone resorption: a critical analysis of the concept and of its relevance to the pathogenesis of osteoporosis. Metab Bone Dis Relat Res. 1982;4(1):1–6. [DOI] [PubMed] [Google Scholar]
- 13. Hattner R, Epker BN, Frost HM. Suggested sequential mode of control of changes in cell behavior in adult bone remodeling. Nature. 1965;206:489–90. [DOI] [PubMed] [Google Scholar]
- 14. Lassen NE, Andersen TL, Ploen GG, et al. Coupling of bone resorption and formation in real time: new knowledge gained from human haversian BMUs. J Bone Miner Res. 2017;32(7):1395–405. [DOI] [PubMed] [Google Scholar]
- 15. Martin RB. On the significance of remodeling space and activation rate changes in bone remodeling. Bone. 1991;12(6):391–400. [DOI] [PubMed] [Google Scholar]
- 16. Heaney RP. The bone‐remodeling transient: implications for the interpretation of clinical studies of bone mass change. J Bone Miner Res. 1994;9(10):1515–23. [DOI] [PubMed] [Google Scholar]
- 17. Andreasen CM, Ding M, Overgaard S, Bollen P, Andersen TL. A reversal phase arrest uncoupling the bone formation and resorption contributes to the bone loss in glucocorticoid treated ovariectomised aged sheep. Bone. 2015;75:32–9. [DOI] [PubMed] [Google Scholar]
- 18. Hinge M, Delaisse JM, Plesner T, Clasen‐Linde E, Salomo M, Andersen TL. High‐dose therapy improves the bone remodelling compartment canopy coverage and bone formation in multiple myeloma. Br J Haematol. 2015;171(3):355–65. [DOI] [PubMed] [Google Scholar]
- 19. Jensen PR, Andersen TL, Hauge EM, Bollerslev J, Delaisse JM. A joined role of canopy and reversal cells in bone remodeling—lessons from glucocorticoid‐induced osteoporosis. Bone. 2015;73:16–23. [DOI] [PubMed] [Google Scholar]
- 20. Yoneda T, Hagino H, Sugimoto T, et al. Antiresorptive agent‐related osteonecrosis of the jaw: position paper 2017 of the Japanese Allied Committee on Osteonecrosis of the Jaw. J Bone Miner Metab. 2017;35(1):6–19. [DOI] [PubMed] [Google Scholar]
- 21. Fung P, Bedogni G, Bedogni A, et al. Time to onset of bisphosphonate‐related osteonecrosis of the jaws: a multicentre retrospective cohort study. Oral Dis. 2017;23(4):477–83. [DOI] [PubMed] [Google Scholar]
- 22. Khan AA, Morrison A, Kendler DL, et al. Case‐based review of osteonecrosis of the jaw (ONJ) and application of the international recommendations for management from the international task force on ONJ. J Clin Densitom. 2017;20(1):8–24. [DOI] [PubMed] [Google Scholar]
- 23. Khow KS, Shibu P, Yu SC, Chehade MJ, Visvanathan R. Epidemiology and postoperative outcomes of atypical femoral fractures in older adults: a systematic review. J Nutr Health Aging. 2017;21(1):83–91. [DOI] [PubMed] [Google Scholar]
- 24. Adler RA. Bisphosphonates and atypical femoral fractures. Curr Opin Endocrinol Diabetes Obes. 2016;23(6):430–4. [DOI] [PubMed] [Google Scholar]
- 25. Cooper DML, Thomas CDL, Clement JG, Hallgrímsson B. Three‐dimensional microcomputed tomography imaging of basic multicellular unit‐related resorption spaces in human cortical bone. Anatom Record Part A. 2006;288A(7):806–16. [DOI] [PubMed] [Google Scholar]
- 26. Pratt IV, Belev G, Zhu N, Chapman LD, Cooper DML. In vivo imaging of rat cortical bone porosity by synchrotron phase contrast micro computed tomography. Phys Med Biol. 2015;60(1):211. [DOI] [PubMed] [Google Scholar]
- 27. Felder AA, Phillips C, Cornish H, Cooke M, Hutchinson JR, Doube M. Secondary osteons scale allometrically in mammalian humerus and femur. R Soc Open Sci. 2017;4(11):170431. [DOI] [PMC free article] [PubMed] [Google Scholar]
- 28. Sietsema WK. Animal models of cortical porosity. Bone. 1995;17(Suppl 4):297S–305S. [DOI] [PubMed] [Google Scholar]
- 29. Turner AS. Animal models of osteoporosis—necessity and limitations. Eur Cells Mater. 2001;1:66–81. [DOI] [PubMed] [Google Scholar]
- 30. Jee WS, Yao W. Overview: animal models of osteopenia and osteoporosis. J Musculoskelet Neuronal Interact. 2001;1(3):193–207. [PubMed] [Google Scholar]
- 31. Pearce AI, Richards RG, Milz S, Schneider E, Pearce SG. Animal models for implant biomaterial research in bone: a review. Eur Cell Mater. 2007;13:1–10. [DOI] [PubMed] [Google Scholar]
- 32. Reinwald S, Burr D. Review of nonprimate, large animal models for osteoporosis research. J Bone Miner Res. 2008;23(9):1353–68. [DOI] [PMC free article] [PubMed] [Google Scholar]
- 33. Thompson DD, Simmons HA, Pirie CM, Ke HZ. FDA guidelines and animal models for osteoporosis. Bone. 1995;17(4 Suppl):125S–33S. [DOI] [PubMed] [Google Scholar]
- 34. Pazzaglia UE, Bonaspetti G, Rodella LF, Ranchetti F, Azzola F. Design, morphometry and development of the secondary osteonal system in the femoral shaft of the rabbit. J Anat. 2007;211(3):303–12. [DOI] [PMC free article] [PubMed] [Google Scholar]
- 35. Pazzaglia UE, Congiu T, Raspanti M, Ranchetti F, Quacci D. Anatomy of the intracortical canal system: scanning electron microscopy study in rabbit femur. Clin Orthop Relat Res. 2009;467(9):2446–56. [DOI] [PMC free article] [PubMed] [Google Scholar]
- 36. Pazzaglia UE, Zarattini G, Giacomini D, Rodella L, Menti AM, Feltrin G. Morphometric analysis of the canal system of cortical bone: an experimental study in the rabbit femur carried out with standard histology and micro‐CT. Anat Histol Embryol. 2010;39(1):17–26. [DOI] [PubMed] [Google Scholar]
- 37. Gilsanz V, Roe TF, Gibbens DT, et al. Effect of sex steroids on peak bone density of growing rabbits. Am J Physiol. 1988;255(4 Pt 1):E416–21. [DOI] [PubMed] [Google Scholar]
- 38. Newman E, Turner AS, Wark JD. The potential of sheep for the study of osteopenia: current status and comparison with other animal models. Bone. 1995;16(4 Suppl):277s–84s. [DOI] [PubMed] [Google Scholar]
- 39. Yamane H, Takakura A, Shimadzu Y, et al. Acute development of cortical porosity and endosteal naive bone formation from the daily but not weekly short‐term administration of PTH in rabbit. PLoS One. 2017;12(4):e0175329. [DOI] [PMC free article] [PubMed] [Google Scholar]
- 40. Hirano T, Burr DB, Cain RL, Hock JM. Changes in geometry and cortical porosity in adult, ovary‐intact rabbits after 5 months treatment with LY333334 (hPTH 1‐34). Calcif Tissue Int. 2000;66(6):456–60. [DOI] [PubMed] [Google Scholar]
- 41. Hirano T, Burr DB, Turner CH, Sato M, Cain RL, Hock JM. Anabolic effects of human biosynthetic parathyroid hormone fragment (1‐34), LY333334, on remodeling and mechanical properties of cortical bone in rabbits. J Bone Miner Res. 1999;14(4):536–45. [DOI] [PubMed] [Google Scholar]
- 42. Zebaze R, Takao‐Kawabata R, Peng Y, et al. Increased cortical porosity is associated with daily, not weekly, administration of equivalent doses of teriparatide. Bone. 2017;99:80–4. [DOI] [PubMed] [Google Scholar]
- 43. Voor MJ, Yang S, Burden RL, Waddell SW. In vivo micro‐CT scanning of a rabbit distal femur: repeatability and reproducibility. J Biomech. 2008;41(1):186–93. [DOI] [PMC free article] [PubMed] [Google Scholar]
- 44. Castaneda S, Calvo E, Largo R, et al. Characterization of a new experimental model of osteoporosis in rabbits. J Bone Miner Metab. 2008;26(1):53–9. [DOI] [PubMed] [Google Scholar]
- 45. Liu X, Lei W, Wu Z, et al. Effects of glucocorticoid on BMD, micro‐architecture and biomechanics of cancellous and cortical bone mass in OVX rabbits. Med Eng Phys. 2012;34(1):2–8. [DOI] [PubMed] [Google Scholar]
- 46. Baofeng L, Zhi Y, Bei C, Guolin M, Qingshui Y, Jian L. Characterization of a rabbit osteoporosis model induced by ovariectomy and glucocorticoid. Acta Orthop. 2010;81(3):396–401. [DOI] [PMC free article] [PubMed] [Google Scholar]
- 47. Wanderman NR, Mallet C, Giambini H, et al. An ovariectomy‐induced rabbit osteoporotic model: a new perspective. Asian Spine J. 2018;12(1):12–7. [DOI] [PMC free article] [PubMed] [Google Scholar]
- 48. Chen X, Giambini H, Ben‐Abraham E, An KN, Nassr A, Zhao C. Effect of bone mineral density on rotator cuff tear: an osteoporotic rabbit model. PLoS One. 2015;10(10):e0139384. [DOI] [PMC free article] [PubMed] [Google Scholar]
- 49. Qi M, Hu J, Li J, et al. Effect of zoledronate acid treatment on osseointegration and fixation of implants in autologous iliac bone grafts in ovariectomized rabbits. Bone. 2012;50(1):119–27. [DOI] [PubMed] [Google Scholar]
- 50. Sevil F, Kara ME. The effects of ovariectomy on bone mineral density, geometrical, and biomechanical characteristics in the rabbit femur. Vet Comp Orthop Traumatol. 2010;23(1):31–6. [DOI] [PubMed] [Google Scholar]
- 51. Grardel B, Sutter B, Flautre B, Viguier E, Lavaste F, Hardouin P. Effects of glucocorticoids on skeletal growth in rabbits evaluated by dual‐photon absorptiometry, microscopic connectivity and vertebral compressive strength. Osteoporos Int. 1994;4(4):204–10. [DOI] [PubMed] [Google Scholar]
- 52. Eberhardt AW, Yeager‐Jones A, Blair HC. Regional trabecular bone matrix degeneration and osteocyte death in femora of glucocorticoid‐ treated rabbits. Endocrinology. 2001;142(3):1333–40. [DOI] [PubMed] [Google Scholar]
- 53. Castaneda S, Largo R, Calvo E, et al. Bone mineral measurements of subchondral and trabecular bone in healthy and osteoporotic rabbits. Skeletal Radiol. 2006;35(1):34–41. [DOI] [PubMed] [Google Scholar]
- 54. Wen XX, Xu C, Wang FQ, et al. Temporal changes of microarchitectural and mechanical parameters of cancellous bone in the osteoporotic rabbit. Biomed Res Int. 2015;2015:263434. [DOI] [PMC free article] [PubMed] [Google Scholar]
- 55. Chandler H, Brooks DJ, Hattersley G, Bouxsein ML, Lanske B. Abaloparatide increases bone mineral density and bone strength in ovariectomized rabbits with glucocorticoid‐induced osteopenia. Osteoporos Int. 2019;30(8):1607–16. [DOI] [PMC free article] [PubMed] [Google Scholar]
- 56. Muller R, Koller B, Hildebrand T, Laib A, Gianolini S, Ruegsegger P. Resolution dependency of microstructural properties of cancellous bone based on three‐dimensional mu‐tomography. Technol Health Care. 1996;4(1):113–9. [PubMed] [Google Scholar]
- 57. Cooper DM, Matyas JR, Katzenberg MA, Hallgrimsson B. Comparison of microcomputed tomographic and microradiographic measurements of cortical bone porosity. Calcif Tissue Int. 2004;74(5):437–47. [DOI] [PubMed] [Google Scholar]
- 58. Jowsey J. Studies of Haversian systems in man and some animals. J Anat. 1966;100(4):857–64. [PMC free article] [PubMed] [Google Scholar]
- 59. Lieberman DE, Pearson OM, Polk JD, Demes B, Crompton AW. Optimization of bone growth and remodeling in response to loading in tapered mammalian limbs. J Exp Biol. 2003;206(Pt 18):3125–38. [DOI] [PubMed] [Google Scholar]
- 60. Hennig C, Thomas CDL, Clement JG, Cooper DML. Does 3D orientation account for variation in osteon morphology assessed by 2D histology? J Anat. 2015;227(4):497–505. [DOI] [PMC free article] [PubMed] [Google Scholar]
- 61. Doube M, Klosowski MM, Arganda‐Carreras I, et al. BoneJ: free and extensible bone image analysis in ImageJ. Bone. 2010;47(6):1076–9. [DOI] [PMC free article] [PubMed] [Google Scholar]
- 62. Dunn O. Multiple comparisons using rank sums. Dent Tech. 1964;6(3):241–52. [Google Scholar]
- 63. Bonferroni CE. Teoria statistica delle classi e calcolo delle probabilità. Pubblicazioni del R Istituto Superiore di Scienze Economiche e Commerciali di Firenze. 1936.
- 64. Bach‐Gansmo FL, Irvine SC, Bruel A, Thomsen JS, Birkedal H. Calcified cartilage islands in rat cortical bone. Calcif Tissue Int. 2013;92(4):330–8. [DOI] [PubMed] [Google Scholar]
- 65. Shipov A, Zaslansky P, Riesemeier H, Segev G, Atkins A, Shahar R. Unremodeled endochondral bone is a major architectural component of the cortical bone of the rat (Rattus norvegicus). J Struct Biol. 2013;183(2):132–40. [DOI] [PubMed] [Google Scholar]
- 66. Canalis E, Delany AM. Mechanisms of glucocorticoid action in bone. Ann N Y Acad Sci. 2002;966:73–81. [DOI] [PubMed] [Google Scholar]
- 67. Mashiba T, Burr DB, Turner CH, Sato M, Cain RL, Hock JM. Effects of human parathyroid hormone (1‐34), LY333334, on bone mass, remodeling, and mechanical properties of cortical bone during the first remodeling cycle in rabbits. Bone. 2001;28(5):538–47. [DOI] [PubMed] [Google Scholar]
- 68. Turner RT, Hannon KS, Greene VS, Bell NH. Prednisone inhibits formation of cortical bone in sham‐operated and ovariectomized female rats. Calcif Tissue Int. 1995;56(4):311–5. [DOI] [PubMed] [Google Scholar]
- 69. Vrahnas C, Buenzli PR, Pearson TA, et al. Differing effects of parathyroid hormone, alendronate, and odanacatib on bone formation and on the mineralization process in intracortical and endocortical bone of ovariectomized rabbits. Calcif Tissue Int. 2018;103(6):625–37. [DOI] [PubMed] [Google Scholar]
- 70. Ma YL, Zeng QQ, Chiang AY, et al. Effects of teriparatide on cortical histomorphometric variables in postmenopausal women with or without prior alendronate treatment. Bone. 2014;59:139–47. [DOI] [PubMed] [Google Scholar]
- 71. Jiang Y, Zhao JJ, Mitlak BH, Wang O, Genant HK, Eriksen EF. Recombinant human parathyroid hormone (1‐34) [teriparatide] improves both cortical and cancellous bone structure. J Bone Miner Res. 2003;18(11):1932–41. [DOI] [PubMed] [Google Scholar]
- 72. Burr DB, Hirano T, Turner CH, Hotchkiss C, Brommage R, Hock JM. Intermittently administered human parathyroid hormone(1‐34) treatment increases intracortical bone turnover and porosity without reducing bone strength in the humerus of ovariectomized cynomolgus monkeys. J Bone Miner Res. 2001;16(1):157–65. [DOI] [PubMed] [Google Scholar]
- 73. Boyce RW, Paddock CL, Franks AF, Jankowsky ML, Eriksen EF. Effects of intermittent hPTH(1–34) alone and in combination with 1,25(OH)2d3 or risedronate on endosteal bone remodeling in canine cancellous and cortical bone. J Bone Miner Res. 1996;11(5):600–13. [DOI] [PubMed] [Google Scholar]
- 74. Jensen PR, Andersen TL, Pennypacker BL, Duong LT, Delaissé J‐M. The bone resorption inhibitors odanacatib and alendronate affect post‐osteoclastic events differently in ovariectomized rabbits. Calcif Tissue Int. 2014;94(2):212–22. [DOI] [PMC free article] [PubMed] [Google Scholar]
- 75. Jerome CP, Burr DB, Van Bibber T, Hock JM, Brommage R. Treatment with human parathyroid hormone (1‐34) for 18 months increases cancellous bone volume and improves trabecular architecture in ovariectomized cynomolgus monkeys (Macaca fascicularis). Bone. 2001;28(2):150–9. [DOI] [PubMed] [Google Scholar]
- 76. Jerome CP, Johnson CS, Vafai HT, et al. Effect of treatment for 6 months with human parathyroid hormone (1–34) peptide in ovariectomized cynomolgus monkeys (Macaca fascicularis). Bone. 1999;25(3):301–9. [DOI] [PubMed] [Google Scholar]
- 77. Arita S, Ikeda S, Sakai A, et al. Human parathyroid hormone (1–34) increases mass and structure of the cortical shell, with resultant increase in lumbar bone strength, in ovariectomized rats. J Bone Miner Metab. 2004;22(6):530–40. [DOI] [PubMed] [Google Scholar]
- 78. Brouwers JE, van Rietbergen B, Huiskes R, Ito K. Effects of PTH treatment on tibial bone of ovariectomized rats assessed by in vivo micro‐CT. Osteoporos Int. 2009;20(11):1823–35. [DOI] [PMC free article] [PubMed] [Google Scholar]
- 79. Reeve J, Meunier PJ, Parsons JA, et al. Anabolic effect of human parathyroid hormone fragment on trabecular bone in involutional osteoporosis: a multicentre trial. Br Med J. 1980;280(6228):1340–4. [DOI] [PMC free article] [PubMed] [Google Scholar]
- 80. Graeff C, Timm W, Nickelsen TN, et al. Monitoring teriparatide‐associated changes in vertebral microstructure by high‐resolution CT in vivo: results from the EUROFORS study. J Bone Miner Res. 2007;22(9):1426–33. [DOI] [PubMed] [Google Scholar]
- 81. Andreasen CM, Delaisse JM, van der Eerden BC, van Leeuwen JP, Ding M, Andersen TL. Understanding age‐induced cortical porosity in women: the accumulation and coalescence of eroded cavities upon existing intracortical canals is the main contributor. J Bone Miner Res. 2018;33(4):606–20. [DOI] [PubMed] [Google Scholar]
- 82. Lafage‐Proust MH, Roche B, Langer M, et al. Assessment of bone vascularization and its role in bone remodeling. Bonekey Rep. 2015;4:662. [DOI] [PMC free article] [PubMed] [Google Scholar]
- 83. Prisby RD. The clinical relevance of the bone vascular system: age‐related implications. Clin Rev Bone Miner Metabol. 2019;17:48–62. [Google Scholar]
Associated Data
This section collects any data citations, data availability statements, or supplementary materials included in this article.
Supplementary Materials
Supplemental Fig. S1. Micro‐CT Ca.Dm resolution dependency.
Supplemental Fig. S2. Validation of micro‐CT assessment of Ca.Dm.
Supplemental Fig. S3. Variation in cortical porosity within the tibial diaphysis.
Supplemental Table S1. Validation of Micro‐CT Assessment of Ca.Dm