

Abstract
The human immunodeficiency virus (HIV) causes over a million deaths every year and has a huge economic impact in many countries. The first class of drugs approved were nucleoside reverse transcriptase inhibitors. A newer generation of reverse transcriptase inhibitors have become susceptible to drug resistant strains of HIV, and hence alternatives are urgently needed. We have recently pioneered the use of Bayesian machine learning to generate models with public data to identify new compounds for testing against different disease targets. The current study has used the NIAID ChemDB HIV, Opportunistic Infection and Tuberculosis Therapeutics Database for machine learning studies. We curated and cleaned data from HIV-1 wild-type cell-based and reverse transcriptase (RT) DNA polymerase inhibition assays. Compounds from this database with ≤ 1μM HIV-1 RT DNA polymerase activity inhibition and cell-based HIV-1 inhibition are correlated (Pearson r = 0.44, n = 1137, p < 0.0001). Models were trained using multiple machine learning approaches (Bernoulli Naive Bayes, AdaBoost Decision Tree, Random Forest, support vector classification, k-Nearest Neighbors, and deep neural networks as well as consensus approaches) and then their predictive abilities were compared. Our comparison of different machine learning methods demonstrated that support vector classification, deep learning and a consensus were generally comparable and not significantly different from each other using five-fold cross validation and using 24 training and test set combinations. This study demonstrates findings in line with our previous studies for various targets that training and testing with multiple datasets does not demonstrate a significant difference between support vector machine and deep neural networks.
Keywords: Assay Central, Deep Learning, Drug Discovery, HIV, Machine learning, Naïve Bayes, Reverse Transcriptase, Support Vector Machine
Graphical Abstract

INTRODUCTION
The human immunodeficiency virus (HIV) causes acquired immune deficiency syndrome (AIDS), which has claimed more than 35 million lives globally to date and approximately 940,000 people died from HIV-related illnesses in 2017 alone 1. African countries are among the most heavily affected regions: 25.6 million people are living with HIV as of 2016 and these vulnerable areas account for two thirds of the global total of new HIV infections 1. HIV affects young adults in their most productive years and hence also carries a very large economic burden, thus finding new treatments is very important.
The most common target of HIV antiviral drugs is reverse transcriptase (RT), but other well-known targets include protease and integrase, as well as the C-C motif chemokine receptor type 5 (CCR5) 2. The first HIV antiviral approved in 1987 by the FDA was the nucleoside reverse transcriptase inhibitor (NRTI) zidovudine 3. NRTIs bind to the nucleoside-binding pocket of HIV-RT and through direct DNA incorporation cause chain termination. These are potent inhibitors, but require intracellular modification by kinases to catalyze into their active triphosphate form 4. Six first- and second-generation non-nucleoside reverse-transcriptase inhibitors (NNTRIs) have been approved by the FDA (Figure 1) to date 5. This class of drug binds in an allosteric pocket of HIV-RT inhibiting the progression of viral DNA synthesis. These compounds are highly potent with low toxicity yet are still hampered by rapid viral drug resistance 6. Since the introduction of zidovudine, 39 additional HIV antiviral drugs and drug combinations have been approved by the FDA. However, a loss of efficacy of the first and second generation NNTRIs is becoming more common due to the high mutation rate of HIV 7–9 which points to the need for a new generation of NNTRIs.
Figure 1.
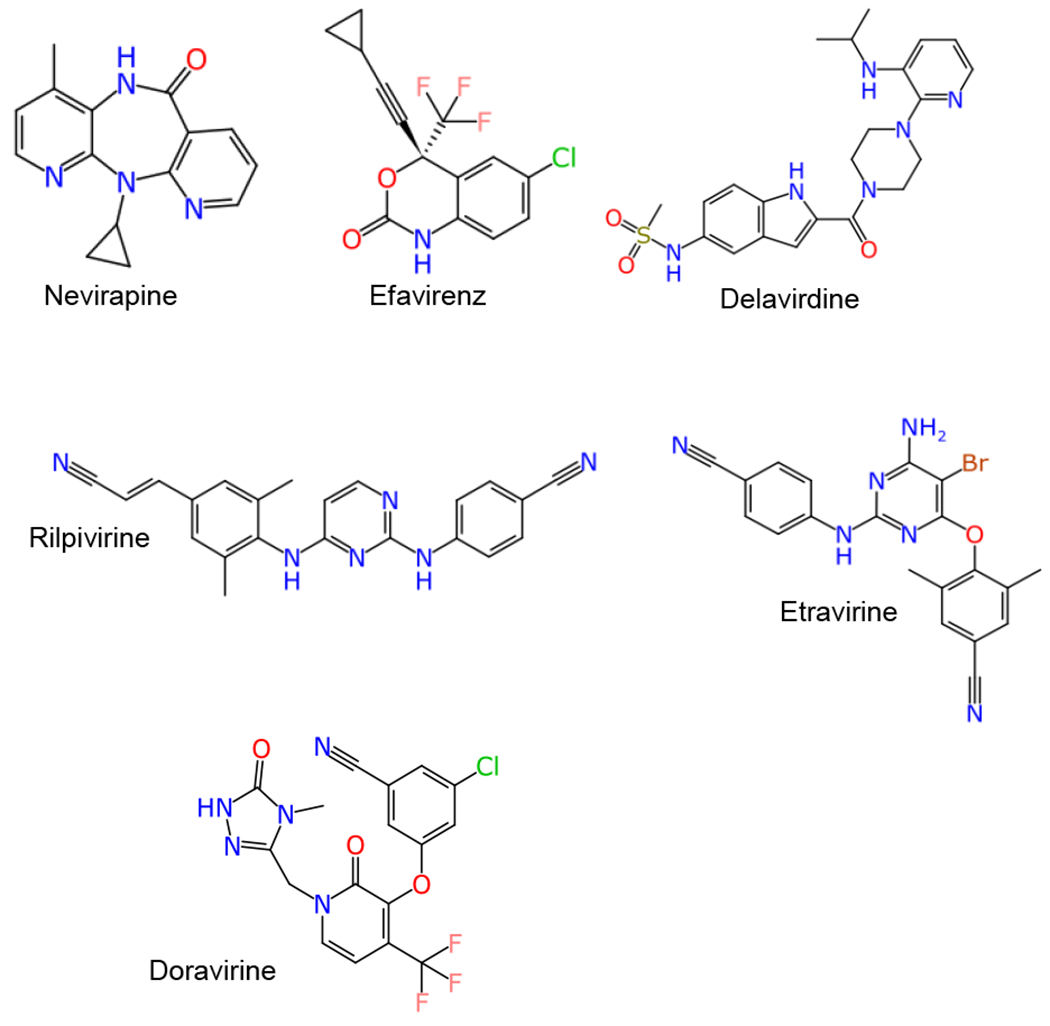
NNRTI inhibitors approved by the FDA.
The implementation of highly active anti-retroviral therapy (HAART) can delay the progression of the most severe symptoms of HIV for decades 10 by restoring the immune system and controlling viral load. HAART is a cocktail of multiple HIV-targeting drugs, with the most common regimens being comprised of an NRTI, an NNRTI, and/or protease inhibitors 11. A multiple-target approach is appropriate because HIV is highly prone to develop mutational-based drug resistance due to the lack of a proofreading activity of reverse transcriptase 12. Side effects are a concern for HAART therapy as these drugs are taken for decades 13. First generation NNRTIs have a low genetic barrier to resistance and only require one mutation to result in resistance, while second generation NNRTIs have a higher genetic barrier 14. There are also efforts ongoing to address host targets as well as viral, for example preventing virus entry via the CCR5 found on the host cells 2 as well as the process of membrane fusion. These targets have the advantage of not resulting in viral resistance.
While there are numerous recent instances of structure-based design to assist in the development of HIV-RT inhibitors 15–19, there have been relatively few examples using machine learning. We have previously used Bayesian and other machine learning methods for tuberculosis 20–22, Chagas disease 23, and Ebola virus 24 drug discovery to identify new molecules for testing. Public databases such as ChEMBL has been used previously to develop support vector machine models for several viruses, including HIV 25, 26. Support vector machine and back propagation neural networks were found to outperform multiple linear regression in training and testing in the modeling of analogs of substituted phenyl-thio-thymines as NNRTI 27. Support vector machine was also used to model RT inhibitors and to improve the speed of virtual screening and the enrichment factor 28. Machine learning has been used in a few limited examples for other targets such as integrase 29. We now describe a comparison of multiple machine learning approaches used with wild-type HIV-1 (referred to as HIV throughout the remainder of this paper) cell-based and RT inhibition data from the NIAID ChemDB HIV, Opportunistic Infection and Tuberculosis Therapeutics Database (ChemDB) 30. This work represents one of the first attempts to curate this data and use it to create and validate machine learning models for eventual prospective prediction and to drive future drug discovery efforts.
EXPERIMENTAL SECTION
NIAID ChemDB Curation of Training Data
ChemDB 30 was initially received as a transfer from NIAID as a series of comma-separate value files (.csv) with measurements from various HIV targets (IC50) and cell-based (EC50) assays. Each measurement was assigned to a molecule identifier (AIDSNo) and depicted in a structure file (.sdf) with additional molecular information. We utilized workflows to combine the structures with measurements into new datasheet structures files (.ds) with the AIDSNo, restricted to targets or cell-based data. HIV datasets were curated to be ‘specific’ or ‘nonspecific’, referring to data where the assay method and or cell lines were either considered or not considered, respectively, for data isolation.
Curation of Cell-based HIV Data
Data for cell-based EC50 measurements were narrowed to pertain to wild-type HIV only. This was done by evaluating the annotated fields provided (i.e. Strain, Species, Mutations, and Comments) and removing entries for known mutations (i.e. ROD, RES056, A17, K103N, Y181C), and related species (i.e. HIV-2, SIV, FIV). Pseudovirus entries were retained. This level of general curation is representative of the ‘nonspecific’ datasets. The ‘specific’ datasets were further restricted to a single cell line (MT-4) and then to multiple assay methods by using keywords to parse the data (“MTT”, “MTS”, “XTT”, and “CPE”). Both of these datasets were separately parsed by unit type (i.e. μM, nM, ug/mL), followed by the retention of those compounds with defined measurements only (i.e. comprised of a “=“ modifier for the EC50). At this point, a workflow was invoked to merge duplicate compounds (duplicate compound activities averaged) into a single source and the subsequent outputs were combined into the final specific (WC-SP) and nonspecific (WC-NS) datasets (Table 1). Duplicate compounds were identified by subgraph isomorphism, which is used to group structure-activity input rows into groups. In cases where more than one activity is available, the most pessimistic interpretation is taken: if all values are specific, the average is taken (with a calculated error). If any of the compounds are expressed as inequalities, the least specific interpretation is made. If any of the inequalities contradicts other data, the compound is rejected.
Table 1.
Training and testing dataset information (WC = whole cell, RT = reverse transcriptase, NS = non specific, Lit -= literature, MW = molecular weight)
| Dataset Name | Cell or Target | Curation Level | Actives | Total | |
|---|---|---|---|---|---|
| Training Sets | WC-NS | Cell | nonspecific | 8687 | 18754 |
| WC-NS-balanced | Cell | nonspecific balanced | 8687 | 17374 | |
| WC-SP | Cell | specific | 2991 | 6006 | |
| RT-NS | Target | nonspecific | 1394 | 4750 | |
| RT-NS-balanced | Target | nonspecific balanced | 1394 | 2788 | |
| RT-SP-Group 1 | Target | specific | 131 | 469 | |
| RT-SP-Group 2 | Target | specific | 12 | 270 | |
| RT-SP-Group 3 | Target | specific | 436 | 1246 | |
| Testing Sets | WC-Lit | Cell | specific | 173 | 202 |
| WC-CHEMBL-NS | Cell | specific | 598 | 1719 | |
| WC-CHEMBL-NS-500MW | Cell | specific | 332 | 1246 | |
| WC-CHEMBL-SP* | Cell | specific | 460 | 1146 | |
| WC-CHEMBL-SP-500MW* | Cell | specific | 186 | 808 | |
| RT-CHEMBL-NS | Target | nonspecific | 276 | 1294 | |
| RT-CHEMBL-NS-500MW | Target | nonspecific | 198 | 994 | |
| RT-Lit | Target | nonspecific | 55 | 142 |
WC SP CHEMBL test set has some literature data in it.
Curation of HIV RT DNA Polymerase Inhibition Data
Data for target-based HIV-RT IC50 measurements was parsed similarly to the cell-based datasets to generate a ‘nonspecific’ and ‘specific’ final dataset (Table 1). Similar pruning was done to initially narrow to wild-type HIV-RT data with the additional filtering step of removing all the compounds with the keyword “RNase H’ in order to retain RT DNA polymerase activity inhibition exclusively. No cell line was specified as there was not an applicable field in the target-based data. These data with this level of pruning is designated the nonspecific RT data. The assay method keywords used to parse the specific datasets were grouped by “absorb/color/fluoro/lumin/picogreen” (RT-SP-Group1), “elisa/immuno” (RT-SP-Group2), and “incorp” (RT-SP-Group3). The same process of separating data by units and defined measurements was applied for these datasets, followed by invoking the workflow mentioned in the previous section to merge duplicate compounds.
Universal Curation Process
All target and cell-based datasets were subjected to the same compound pruning process. A molecular weight limit of 500.0000 g/mol was applied to exclude large and non-drug-like compounds; entries with salt adducts were modified so the active component was retained and below this limit. Mixtures, where there was not an obvious active component, and polymers containing dummy atoms were identified and removed. Finally, a balancing script was applied to both target and cell-based nonspecific training datasets, which outputs a diverse dataset with an equivalent number of active and inactive compounds (Table 1). To obtain balanced datasets we split between active and inactive, and then selected N compounds from each, these are obtained so as to minimize the Tanimoto/ECFP6 similarity between pairwise combinations of molecules.
Machine Learning Methods
The machine learning models applied in this work are an addition to our on-going effort to explore and compare a variety of machine learning algorithms across multiple datasets. As such, the model development described herein is similar to that of our previous studies 21, 31, 32. First, the RDKit open-source cheminformatics software (http://www.rdkit.org) was used to generate extended-connectivity fingerprints (ECFP6) 33 for the training set compounds and served as the chemical features for quantitative structure-activity relationship (QSAR) model training. Then, the software package scikit-learn (http://scikit-learn.org/) 34 was used to provide a variety of algorithms to learn the relationship between the chemical features and the target activity within the training compounds. These included the following “classic” machine learning algorithms: Bernoulli Naive Bayes 35 (bnb), AdaBoost Decision Trees 36 (ada), Random Forest 37 (rf), support vector classification 38 (svc), and k-Nearest Neighbors 39 (knn). Additionally, deep neural networks (DL) 40 using three hidden layers and implemented using Keras 41 were also included in our comparison. Hyper-parameter optimization for all “classic” machine learning algorithms was performed as our previous studies 21, 31, 32. This included a stratified five-fold cross validation technique, which maintains similar ratios of active and inactive molecules amongst the splits. This five-fold cross validation was performed exhaustively for each combination of hyper-parameters to identify the best set as measured by the area under the receiver operator characteristic curve (AUC). However, due to the increased training times needed for DL, the five-fold cross validation was performed on a single set of hyper-parameters that we previously found to perform well on a variety of diverse datasets 31.
Consensus Modeling
A consensus model can be created by leveraging the outputs of several individual QSAR models into one prediction. Previous work has demonstrated these models to have comparable or superior predictive capabilities compared to their individual components 42–45. In this work, a consensus model prediction was created by averaging the predicted classification of compound across all machine learning algorithms tested. Therefore, predictions by the consensus model were based on agreement of each algorithm’s predicted classification and ranged from 0–1. A threshold of > 0.5 applied to this prediction categorized compounds as active vs inactive.
Assay Central
The Assay Central project has been previously described 21, 32, 46. It uses the source code management system Git to gather and store structure-activity datasets from diverse sources in addition to storing scripts for thorough curation. These scripts employ a series of rules for the detection of problem data that is corrected by a combination of automated structure standardization (including removing salts, neutralizing unbalanced charges, and merging duplicate structures with finite activities) and human re-curation. The output is a high-quality dataset and a Bayesian model which can be conveniently used to predict activities for proposed compounds. We utilized Assay Central to prepare and merge datasets collated in Molecular Notebook 47 as well as generate Bayesian models. These models also utilize ECFP6 descriptors but generated from the CDK library 48, 49, which are circular topological fingerprints generated by applying the Morgan algorithm that have widely been noted for their ability to map structure-activity relationships 2. Each model in Assay Central includes metrics to evaluate predictive performance which are discussed the Data Analysis section.
Different concentration units were converted to a single unit of −log molarity (−logM) so that a global activity threshold which optimizes model AUC could be calculated 49. Thresholds calculated from the unbalanced ‘nonspecific’ target and cell-based models were applied to the corresponding balanced and ‘specific’ models. The optimal calculated thresholds (−logM) implemented for each model was rounded to three significant figures. The applicability domain for our models is calculated by making histograms of each ECFP6 fingerprint from the molecules that went into the model, and the molecules from a representative chemistry space (in this case the entirety of ChEMBL 24). The score is calculated as the fraction of the area overlap of these histograms, after normalizing to the same height. Values typically approach 0.5 for large diverse datasets, and can be as low as 0.1 for smaller datasets with only a handful of chemotypes. Higher values for this metric suggest that the model is likely to have more generality, as it increases the likelihood that a prediction for an arbitrary biorelevant compound is based on dense training data.
External Validation
Multiple test sets were compiled to ascertain the predictive ability of a given model. A large HIV-RT dataset was obtained from various assays included in a previous model of ChEMBL23 Target IDs 2366516 and 247 (RT-CHEMBL-NS). An additional truncated CHEMBL test set was also utilized where all compounds that exceeded a molecular weight of 500.000 g/mol were excluded (RT-CHEMBL-NS-500MW). Two new cell-based testing sets were curated similarly from ChEMBL24 Target ID 378, either including or excluding compounds exceeding 500.000 g/mol (WC-CHEMBL-NS and WC-CHEMBL-NS-500MW, respectively). Two additional, related test sets were also curated from a previous model of specific cell-based assays from the same ChEMBL23 Target ID. These datasets were specifically filtered by cell (MT-4) and assay (MTT, XTT, and CPE assays) type with the addition of a small literature set that met the same criteria 5, 17, 50–56. Similar to the previously described test sets, these either did or did not apply a molecular weight cut-off (WC-CHEMBL-SP and WC-CHEMBL-SP-500MW, respectively). Table 1 details the size and number of actives in each of these test sets. A third test set was curated by an exhaustive search in PubMed for wild-type HIV-RT data, yielding nine primary literature articles published between 2016-2018 with 142 HIV-RT bioactivities (RT-Lit) and 202 cell-based activities (WC-Lit) 16, 51, 57–63. All test sets were subjected to a proprietary script to eliminate overlap with the various training sets, including corresponding tautomers. We used a tautomer generator that is slightly modified from the method described previously 64. Any two molecules that share a tautomeric form are considered to be equivalent.
Data Analysis
We have previously described several traditional measurements of model performance 21, 31, 32. Statistics generated within Assay Central are Recall, Precision, F1 Score, AUC, Cohen’s Kappa (CK) 65, 66, and Matthews Correlation Coefficient (MCC) 67. These metrics, in addition to Accuracy, were used for algorithm comparisons.
The following abbreviations are used for metric definitions: the number of true positives (TP), the number of false positives (FP), the number of true negatives (TN), and the number of false negatives (FN) classified during five-fold cross-validation. Specificity, or the TN rate, is defined by the percentage of false class labels correctly identified by five-fold cross-validation, . Recall, also known as sensitivity or the TP rate, refers to the percentage of positive class labels (i.e. compound is active at a target) correctly identified by the model out of the total number of actual positives: . Precision, or the positive predictive value, is the percentage of positive class labels correctly identified out of total predicted positives: . The F1 Score is simply the harmonic mean of the Recall and Precision: . The ROC curve can be computed by first plotting the TP rate versus the FP rate at various decision thresholds, T, where . All constructed models are capable of assigning a probability estimate of a sample belonging to the positive class. The TP and FP rate performances are measured when we consider a sample with a probability estimate > T as being true for various intervals between 0 and 1. The AUC can be calculated from this receiver operator characteristic plot; it is interpreted as the ability of the model to separate classes, where 1 denotes perfect separation and 0.5 is random classification. Accuracy is the percentage of correctly identified labels (TP and TN) out of the entire population: . CK attempts to leverage the Accuracy by normalizing it to the probability that the classification would agree by chance (pe): , where . Another measure of overall model classification performance is MCC, which is not subject to heavily imbalanced classes and can have a value between −1 and 1: .
We 68 and others 69 have used the rank normalized scores 68 as a performance criteria for each machine learning method. We obtained a rank normalized metric by first range-scaling all metrics for each model to [0, 1] and then taking the mean. This allows for a comprehensive overall model robustness comparison for different machine learning algorithms. To assess if the mean was the most appropriate representative for these metrics, several statistical evaluations were done for each set of metrics (i.e. the individual six metrics that make up each rank normalized score) to ensure that they were normally distributed. Four different normal distribution tests (Anderson-Darling, D’Agostino & Pearson, Shapiro-Wilk, Kolmogorov-Smirnov tests) were used in Prism (GraphPad Software, San Diego, CA) for each individual set of the 24 external test set validation pairs gave a near-consensus: these populations are normally distributed for every algorithm tested, suggesting that the mean is the appropriate representative. When looking at the distribution of the rank normalized scores per machine learning algorithm, many of these metrics are statistically unlikely to be normally distributed; this suggests that the median, not the mean was the more appropriate representation of each population. This also suggests that nonparametric statistical tests are also more appropriate to compare machine learning algorithms for these data.
Under the assumption that a rank normalized score is an acceptable method of comparison, the question of “which machine learning algorithm is best” can be thought of from two different perspectives: which one wins most often and by how much, or which one performs better on average by comparing the rank normalized score pairwise or independently (assuming that experimental results of every training-test set pair are equivalently important). Unfortunately, this approach only considers the difference between two machine learning algorithms at a time. Since one of the statistical analysis (Mann-Whitney U) used to compare two algorithms requires ranking of all the metrics from those two algorithms and then comparing these ranks, this creates an issue with asking which algorithm is best overall using just rank normalized scores. If one assumes independence of the rank normalized scores, the comparisons of ranking between two different algorithms are independent of the other algorithms tested. We took a related approach to try and assess which algorithm wins overall from the seven different algorithms tested. This was done by looking at the differences in the distributions of the “difference from the top rank normalized score” per algorithm per training-test set pair. The “difference from the top” (ΔRNS) is the rank normalized score for each machine learning algorithm subtracted from the highest score from that training-test set. This is essential to maintain the results from each training-test set experiment, which allows us to compare the performance of two machine learning algorithms while maintaining information from the other machine learning algorithms tested. This extended the ability of the Mann-Whitney U test to not just be able to compare the number of wins out of all pairwise contests, but also indirectly includes the performance of the other participants. Based on the nature of the test used for analysis, this score is only able to answer the question “which machine learning algorithm overall wins each training-test experiment and by how much?”. For this question the metric essentially removes the need for a pairwise comparison between rank normalized scores to access the winner on a test by test basis all while still considering the performance of all the other tested algorithms from that same test.
Diversity Metrics
Diversity metrics were calculated using Discovery Studio (Biovia, San Diego, CA). Tanimoto similarity between the training and testing sets were calculated using 2D ECFP6 descriptors. These values are representative of a pair-wise comparison between each test molecule and its most similar molecule found within the training set. The diversity of each training and testing set is described using multiple metrics, including the number of assemblies and fingerprint features as well as the average fingerprint and property distances. The number of assemblies and fingerprint features is the number of unique Murcko assemblies and fingerprints normalized by the number of ligands, respectively. The average fingerprint distance between all pairs of molecules is equivalent to the Tanimoto similarity subtracted from one. Average property distance is defined as the average Euclidean distance between every pair of compounds using the following molecular descriptors: lipophilicity (aLogP), molecular weight, number of hydrogen bond donors and acceptors, number of rotatable bonds, number of rings, number of aromatic rings, and molecular fractional polar surface area.
Principal component analysis (PCA) is a dimension-reduction technique to reduce the high-dimensional feature sets to two or three dimensions and aids in visualization. This method was used to compare the structural similarity of the different datasets.
RESULTS
Comparison of datasets
In order to study the relationship between HIV-RT DNA polymerase activity inhibition and cell-based inhibition, a comparative analysis was performed on compounds that have been tested in both assays. The purpose was to see if an assay to assess HIV-RT inhibition would be expected to result in a very similar activity for cellular HIV inhibition. Firstly, the overlap of molecules between the concatenated NIAID HIV-RT and cell-based inhibition datasets were identified and sorted accordingly. If more than one value existed for the tested activity of a unique molecule then these values were averaged early in the curation process. There were 1647 compounds identified as having defined numerical measurements for both classes (Table S1). To enhance the likelihood that the target causing the cell-based inhibition is RT, an additional filter of ≤ 1 μM RT inhibition activity was applied (Figure 2). There is sufficient data to show that there is a relationship between the AC50’s of RT and WC for molecules when these values are considered on a logarithmic scale (−logM) (i.e. are not due likely to be random sampling, p < 0.0001). While a relationship exists, the values are weakly correlated (Pearson r = 0.44, n = 1137) and the low r-score suggests that even on a logarithmic scale the measurements do not linearly change. These data were further scrutinized by reducing the compounds within each dataset based on different activity filters (Table S1, Figure S1). This was done in order to identify if these relationships are disrupted when the inhibition potency of the compounds is considered. The correlational data suggests a trend towards a reduced linear relationship between cell-based and RT inhibition data as the activity threshold is reduced.
Figure 2.
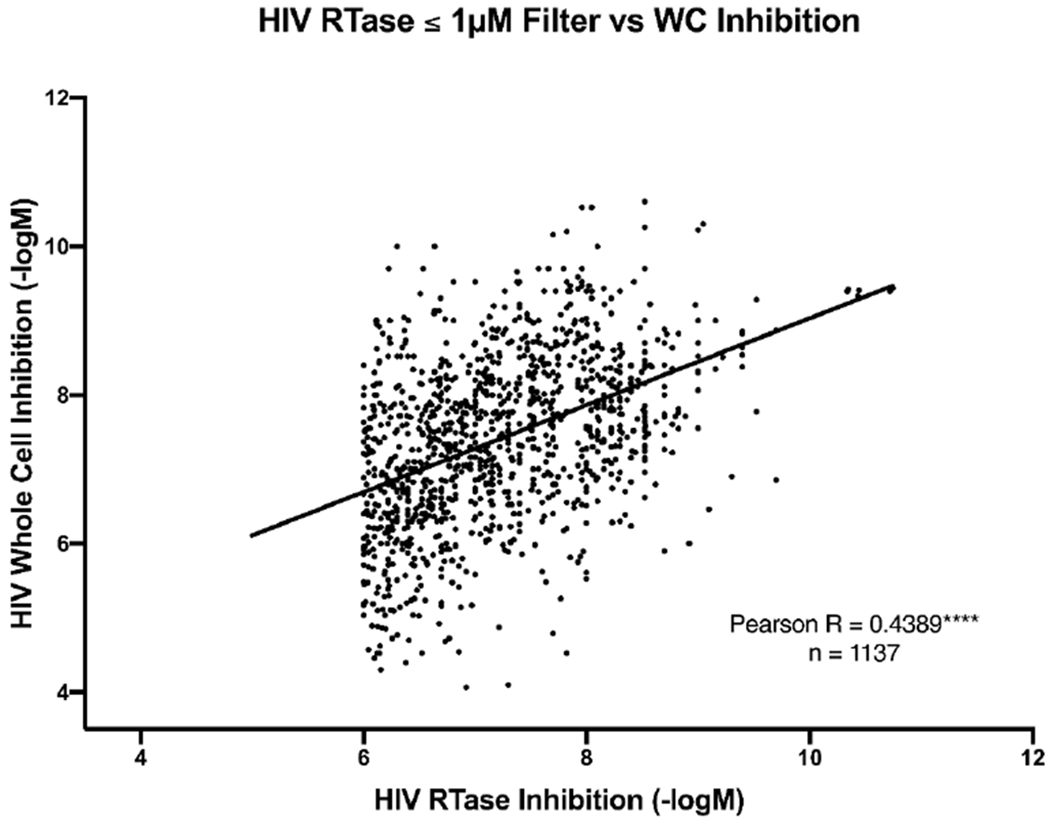
Correlation of cell-based and RT data from the NIAID ChemDB with an RT inhibition cut off of 1μM.
Machine Learning Algorithm comparison
We curated eight training sets and eight test sets for the cell-based and RT data from different sources (Table 1). There were two independent master training sets, one for RT inhibition and one for cell-based inhibition, with all other training sets being derived from these master sets using a different set of filtering criteria. This is similar with the test sets, which had four master sets, two for each type of inhibition tested (Literature and CHEMBL test sets). We compared multiple machine learning methods using both five-fold cross-validation and external test validation of the cell-based and HIV-RT training sets. Activity thresholds were calculated by Assay Central, based on optimizing the AUC for the nonspecific cell- and target-based models. All cell- and target-based models utilized a threshold of 6.14 and 6.87 −logM (approximately 724 nM and 135 nM, respectively).
Rank normalized scores were generated for all the five-fold cross-validation cell- and target-based models in this study (Figure 3A). As these data are not normally distributed the median of the rank normalized score was calculated for comparison purposes (Figure 3B). Using the Mann-Whitney U test, svc and DL algorithms were not found to be significantly different (p = 0.19, (Table 2A), 0.64 (Table 2B) and 0.11 (Table 2C)) using these metrics, respectively. Interestingly, while Assay Central showed no significant difference from DL, bnb was often significantly different to DL (p = 0.04* (Table 2A), 0.1304 (Table 2B), and 0.005** (Table 2C)) and almost every other algorithm for differences in rank normalized and rank normalized top scores. The test set analysis demonstrated comparable normalized metric scores for the different algorithms (Figure 4). Recall appeared to have qualitatively more variability than the other metrics.
Figure 3.
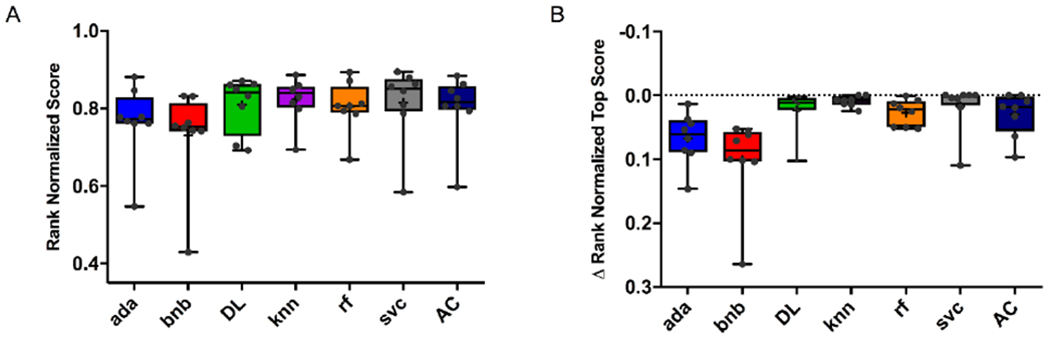
Five-fold cross-validation statistics for all cell-based and RT datasets in this study. A) Rank normalized scores and B) ΔRNS. Assay Central (AC); AdaBoost (ada); Bernoulli Naïve-Bayes (bnb); k-nearest neighbors (knn); Random Forest (rf); support vector classification (svc); Deep Neural Networks (DL).
Table 2.
Five-fold cross validation statistical significance (p-value) using different scores. A. Rank normalized score (pairwise; Wilcoxon matched-pairs signed rank test), B. Rank normalized score (Unpaired Comparison; Mann-Whitney U test), C. ΔRNS (Unpaired Comparison; Mann-Whitney U test). Assay Central (AC); AdaBoost (ada); Bernoulli Naïve-Bayes (bnb); k-nearest neighbors (knn); Random Forest (rf); support vector classification (svc); Deep Neural Networks (DL).
| A. | |||||||
|---|---|---|---|---|---|---|---|
| ada | bnb | DL | knn | rf | svc | AC | |
| ada | N/A | 0.0078** | 0.1094 | 0.0078** | 0.0078** | 0.0078** | 0.0156* |
| bnb | 0.0078** | N/A | 0.0391* | 0.0078** | 0.0078** | 0.0078** | 0.0078** |
| DL | 0.1094 | 0.0391* | N/A | 0.5469 | 0.6406 | 0.1953 | 0.6406 |
| knn | 0.0078** | 0.0078** | 0.5469 | N/A | 0.0781 | 0.5469 | 0.1953 |
| rf | 0.0078** | 0.0078** | 0.6406 | 0.0781 | N/A | 0.1953 | 0.9453 |
| svc | 0.0078** | 0.0078** | 0.1953 | 0.5469 | 0.1953 | N/A | 0.3125 |
| AC | 0.0156* | 0.0078** | 0.6406 | 0.1953 | 0.9453 | 0.3125 | N/A |
| B. | |||||||
| ada | bnb | DL | knn | rf | svc | AC | |
| ada | N/A | 0.1949 | 0.3281 | 0.1049 | 0.1605 | 0.1049 | 0.1605 |
| bnb | 0.1949 | N/A | 0.1304 | 0.0499* | 0.1304 | 0.0281* | 0.0830 |
| DL | 0.3281 | 0.1304 | N/A | 0.9591 | 0.7984 | 0.6454 | 0.7984 |
| knn | 0.1049 | 0.0499* | 0.9591 | N/A | 0.3823 | 0.7984 | 0.5737 |
| rf | 0.1605 | 0.1304 | 0.7984 | 0.3823 | N/A | 0.4418 | 0.9591 |
| svc | 0.1049 | 0.0281* | 0.6454 | 0.7984 | 0.4418 | N/A | 0.5737 |
| AC | 0.1605 | 0.0830 | 0.7984 | 0.5737 | 0.9591 | 0.5737 | N/A |
| C. | |||||||
| ada | bnb | DL | knn | rf | svc | AC | |
| ada | N/A | 0.1949 | 0.0207* | 0.0011** | 0.0281* | 0.0095** | 0.0626 |
| bnb | 0.1949 | N/A | 0.0047** | 0.0002*** | 0.0002*** | 0.0065** | 0.0068** |
| DL | 0.0207* | 0.0047** | N/A | 0.5526 | 0.4418 | 0.1183 | 0.8527 |
| knn | 0.0011** | 0.0002*** | 0.5526 | N/A | 0.0626 | 0.3579 | 0.1790 |
| rf | 0.0281* | 0.0002*** | 0.4418 | 0.0626 | N/A | 0.0443* | 0.8527 |
| svc | 0.0095** | 0.0065** | 0.1183 | 0.3579 | 0.0443* | N/A | 0.2171 |
| AC | 0.0626 | 0.0068** | 0.8527 | 0.1790 | 0.8527 | 0.2171 | N/A |
Figure 4.

Individual metric validation set statistics by machine learning algorithm for all whole-cell and RT datasets in this study. All metrics were range scaled to [0,1]. Assay Central (AC); AdaBoost (ada); Bernoulli Naïve-Bayes (bnb); k-nearest neighbors (knn); Random Forest (rf); support vector classification (svc); Deep Neural Networks (DL).
When we compared rank normalized scores and ΔRNS (Figure 5) across all the machine learning methods for the external test set analysis for 24 training-set comparisons we showed that svc performed comparably to DL using the rank normalized score (p = 0.5088 (Table 3A), > 0.9999 (Table 3B), Figure 6A) or in ΔRNS (p = 0.4499, (Table 3C) Figure 6B). A pairwise or ΔRNS comparison of every generated metric (ACC, AUC, CK, MCC, Precision, Recall, Specificity, and F1 Score) between DL and svc also did not show a significant difference (p=0.1450 and p=0.0833, respectively). Using any of the comparison methods none of the top three scoring algorithms (ada, DL, and svc) are significantly different from each other. Comparison of the top three scoring algorithms with the fourth (rf and knn for rank normalized score and ΔRNS, respectively) showed a significant difference with both svc and DL, but not with ada. Both svc and DL were also significantly different from all the other methods.
Figure 5.

Test set validation statistics for all cell-based and RT datasets in this study. A) Rank normalized scores and B) ΔRNS. Assay Central (AC); AdaBoost (ada); Bernoulli Naïve-Bayes (bnb); k-nearest neighbors (knn); Random Forest (rf); support vector classification (svc); Deep Neural Networks (DL).
Table 3.
test set validation statistical significance using different scores. A. Rank normalized score (pairwise; Wilcoxon matched-pairs signed rank test), B. Rank normalized score (Unpaired Comparison; Mann-Whitney U test), C. ΔRNS (Unpaired Comparison; Mann-Whitney U test). Assay Central (AC); AdaBoost (ada); Bernoulli Naïve-Bayes (bnb); k-nearest neighbors (knn); Random Forest (rf); support vector classification (svc); Deep Neural Networks (DL).
| A. | ||||||||
|---|---|---|---|---|---|---|---|---|
| ada | bnb | DL | knn | rf | svc | Consensus | AC | |
| ada | N/A | 0.0006*** | 0.1011 | 0.5457 | 0.1688 | 0.0894 | 0.0340* | 0.0164* |
| bnb | 0.0006*** | N/A | 0.0004*** | 0.0491* | 0.0035** | 0.0008*** | <0.0001**** | 0.9888 |
| DL | 0.1011 | 0.0004*** | N/A | 0.0291* | 0.0425* | 0.5088 | 0.9218 | 0.0002*** |
| knn | 0.5457 | 0.0491* | 0.0291* | N/A | 0.2768 | 0.0526 | 0.0457* | 0.0526 |
| rf | 0.1688 | 0.0425* | 0.0035** | 0.2768 | N/A | 0.0039** | 0.0011** | 0.2076 |
| svc | 0.0894 | 0.0008*** | 0.5088 | 0.0526 | 0.0039** | N/A | 0.5457 | 0.0008*** |
| Consensus | 0.0340* | <0.0001**** | 0.9218 | 0.0457* | 0.0011** | 0.5457 | N/A | <0.0001**** |
| AC | 0.0164* | 0.9888 | 0.0002*** | 0.0526 | 0.2076 | 0.0008*** | <0.0001**** | N/A |
| B. | ||||||||
| ada | bnb | DL | knn | rf | svc | Consensus | AC | |
| ada | N/A | 0.2912 | 0.4071 | 0.6165 | 0.4803 | 0.3956 | 0.4803 | 0.2382 |
| bnb | 0.2912 | N/A | 0.0355* | 0.3842 | 0.4932 | 0.0287* | 0.0483* | 0.8944 |
| DL | 0.4071 | 0.0355* | N/A | 0.1153 | 0.1106 | >0.9999 | 0.8143 | 0.0587 |
| knn | 0.6165 | 0.3842 | 0.1153 | N/A | 0.9430 | 0.1106 | 0.2221 | 0.6753 |
| rf | 0.4803 | 0.4932 | 0.1106 | 0.9430 | N/A | 0.0890 | 0.1305 | 0.6456 |
| svc | 0.3956 | 0.0287* | >0.9999 | 0.1106 | 0.0890 | N/A | 0.9593 | 0.0459* |
| Consensus | 0.4803 | 0.0483* | 0.8143 | 0.2221 | 0.1305 | 0.9593 | N/A | 0.0533 |
| AC | 0.2382 | 0.8944 | 0.0587 | 0.6753 | 0.6456 | 0.0459* | 0.0533 | N/A |
| C. | ||||||||
| ada | bnb | DL | knn | rf | svc | Consensus | AC | |
| ada | N/A | 0.0025** | 0.1448 | 0.6444 | 0.1151 | 0.0756 | 0.1524 | 0.0205* |
| bnb | 0.0025** | N/A | <0.0001**** | 0.0217* | 0.2818 | <0.0001**** | <0.0001**** | 0.6456 |
| DL | 0.1448 | <0.0001**** | N/A | 0.0349* | 0.0023** | 0.4499 | 0.6159 | <0.0001**** |
| knn | 0.6444 | 0.0217* | 0.0349* | N/A | 0.2008 | 0.0263* | 0.0534 | 0.0820 |
| rf | 0.1151 | 0.2818 | 0.0023** | 0.2008 | N/A | 0.0012** | 0.0022** | 0.5364 |
| svc | 0.0756 | <0.0001**** | 0.4499 | 0.0263* | 0.0012** | N/A | 0.3187 | <0.0001**** |
| Consensus | 0.1524 | <0.0001**** | 0.6159 | 0.0534 | 0.0022** | 0.3187 | N/A | 0.0001*** |
| AC | 0.0205* | 0.6456 | <0.0001**** | 0.0820 | 0.5364 | <0.0001**** | 0.0001*** | N/A |
Figure 6.

The effect of curation of training and test sets on predictive performance. A. Rank normalized score validation set statistics for all cell-based and RT datasets in this study. B. Rank normalized score validation set statistics for all cell-based and RT datasets in this study. Training and Test sets limited to 500.000 molecular weight.
We assessed whether curation of training and testing sets made a significant difference in the predictive performance of a model by evaluating rank normalized scores of cell-based models. In general, the nonspecific training sets were significantly better at predicting both nonspecific and specific testing sets, and this holds true when restricting the molecular weight of each dataset as well (Figure 6). This suggests that for these experiments an expanded curation of the training datasets (based on assay and cell type) does not improve its ability to predict an external test set, even when it is generated with identical criteria.
Dataset diversity analysis and applicability
We analyzed the various HIV cell-based and RT training and test sets with different approaches to access performance. The diversity metrics for the cell-based datasets suggests the whole cell literature set is more similar to the training set than both ChEMBL test sets when measured by ECFP6 descriptors (Figure S2). For the HIV-RT datasets the literature set has a distribution that skews to lower similarity than the ChEMBL test sets based on Tanimoto similarity (Figure S3). We also evaluated individual dataset diversity using fingerprints or assemblies (Table S2). These suggest the cell-based training and test set sets have comparable numbers of assemblies or fingerprints, while for RT there are differences between the test sets and training set, with higher scores for both in the test sets versus the training set. PCA analysis of the cell-based datasets suggest that the test sets reside in the property space of the training set when using simple interpretable descriptors (Figure S4). The RT literature dataset extends outside the training set, while the corresponding ChEMBL test set resides in the training set property space (Figure S5). These analyses (Figure S2–S5) can also be considered as further methods to determine the applicability domain 70–74 of the models.
DISCUSSION
Recent years have seen the development of a diverse array of new NNRTIs as substituted imidazoles 75, substituted pyridinones 76, 77, 2,4,5-trisubstituted thiazole derivatives 6, diarylnicotinamide derivatives 53, diaryltriazine derivatives 78, triazine derivatives 50, piperidin-4-yl-aminopyrimidine derivatives 56, bicyclic arylaminoazines 79, aryl-phospho-indole 5 and arylazolyl(azinyl)thioacetanilides derivatives 54 have been described by several groups and companies. While there have been considerable efforts in using structure-based design to develop NNRTIs 15, 78–80 we are not aware of other recent work using similar datasets to compare different machine learning methods and metrics to the extent undertaken in this study. There is also an opportunity to use these models to develop novel next generation NNRTIs that could be used to address drug resistance 7–9.
We can certainly learn from the growing data in the public domain on NNRTIs. ChemDB contains data for HIV reactivation, targets, cell-based assays, data from animal and cytotoxicity studies, as well as data against opportunistic infections. Although this database has a plethora of detailed information, proper curation and modeling is a hurdle as this data is not machine readable 81. The major issues presented here were that the data is not delivered in model-ready format and the annotation of assay methods is not standardized (i.e. “RT assay” versus “[3H]-dGTP incorporation” versus no annotation). Varying degrees of detail further complicate how one can define compatible data. Converting data into a model-ready format requires laborious curation, the development of workflows and removing a vast majority of compounds (i.e. ions, polymers, large molecules). To some extent while the value of curation is obvious there may be a point also where the return on investment of further curation is balanced by limited improvement in prediction statistics (Figure 6). In summary, the current study demonstrates that the ChemDB is likely a valuable starting point for machine learning for HIV drug discovery, but requires extensive curation efforts to utilize the valuable data for modelling for each target or dataset.
We have performed a comparison of multiple machine learning methods for five-fold cross validation and external testing for 24 test set comparisons. We used these multiple external test sets with the goal of validating the models derived from the ChemDB prior to using them for prospective prediction in future. We also illustrate how a consensus machine learning approach can be used, although surprisingly this did not demonstrate an improvement over svc or DL for these datasets. These efforts overall show that svc and DL are likely superior to other machine learning methods. This agrees with our recent work with the estrogen receptor and tuberculosis datasets which also demonstrated the excellent performance of svc relative to DL for external testing 21, 32. As DL has become more accessible 82–85 it has seen wider use in drug discovery and has been popularized by researchers 86 who have generally showed relatively small improvements over other algorithms 21, 31, 32, 87, 88. DL has been used as multitask neural networks 89, 90 and with graph convolutional networks 91 as groups expand their use for cheminformatics approaches. Our comparisons here demonstrate that with ECFP6 descriptors DL and SVC may be significantly better than many other algorithms, but this difference is minimal. Consideration should be given to the computational cost as well as time needed to generate models with these approaches versus the other algorithms. Our work has also enabled the development of a new assessment metric (difference rank normalized top score) which provides a unique way to determine the best algorithm and statistical significance across many metrics (Figure 3 and Figure 5). Perhaps in future this could also be weighted to consider the computational time needed for model building of each of the algorithms.
Expanding on the current efforts, further work could include restricting the datasets to selected molecule classes (i.e. excluding nucleoside-like or peptide structures) or increasing the molecular weight limit. Additionally, these NIAID datasets could be combined with other public resources, such as ChEMBL (used here as a test set), PubChem, or other non-overlapping databases. The same approaches taken comparing different machine learning methods and available metrics to rank the five-fold and external test set evaluations can be applied to datasets relating to HIV-RT mutants 92 as well as to other viral targets. Machine learning may be able to help us narrow down the number of compounds selected for in vitro and in vivo testing. Our efforts could be replicated for the many other datasets in the NIAID database as well as for additional viruses for which there are data in the public domain in other public databases. This may then provide an opportunity to learn from the likely vast investments used to create this data and build databases like ChemDB.
In conclusion, the internally and externally validated models we have developed can now be used for prospective prediction to score libraries of compounds to test. Our future efforts will likely demonstrate which algorithms enable us to identify novel HIV-RT inhibitors which also possess activity in cells. The benefits of these machine learning models are that they leverage data generated in the public domain (ChemDB) and can enable anyone to score and identify molecules for testing in vitro. These machine learning models may also assist our efforts in HIV drug discovery, requiring fewer molecules to be tested in vitro and accelerate our pace in the race between developing new compounds and drug resistance.
Supplementary Material
ACKNOWLEDGMENTS
Biovia is kindly acknowledged for providing Discovery Studio to S.E. Dr. Mohamed Nasr is thanked for assistance with obtaining the NIAID ChemDB HIV, Opportunistic Infection and Tuberculosis Therapeutics Database. Dr. Alfredo Garzino-Demo is kindly acknowledged for advice on how to determine compatible HIV data pertaining to cell lines and strains.
Grant information
We kindly acknowledge NIH NINDS: 1R01NS102164-01, RFBR 17-54-30007 and NIGMS: R43GM122196, R44GM122196-02A1.
Research reported in this publication was supported by the National Institute of Neurological Disorders and Stroke of the National Institutes of Health under Award Number 1R01NS102164-01. The content is solely the responsibility of the authors and does not necessarily represent the official views of the National Institutes of Health.
ABBREVIATIONS USED
- AIDS
Acquired immune deficiency syndrome
- ada
AdaBoost Decision Trees
- AC
Assay Central
- AUC
area under the receiver operating characteristic curve
- bnb
Bernoulli Naive Bayes
- CCR5
C-C motif chemokine receptor type 5
- CK
Cohen’s Kappa
- DL
Deep Neural Networks
- ΔRNS
difference from the top
- ECFP6
extended connectivity fingerprints of maximum diameter 6
- HAART
highly active anti-retroviral therapy
- HIV
human immunodeficiency virus
- knn
k-Nearest Neighbors
- NIAID
NIAID, National Institute of Allergy and Infectious Diseases
- ChemDB
NIAID ChemDB HIV, Opportunistic Infection and Tuberculosis Therapeutics Database
- MCC
Matthews Correlation Coefficient
- NNTRIs
non-nucleoside reverse-transcriptase inhibitors
- NRTI
nucleoside reverse transcriptase inhibitor
- PCA
Principal component analysis
- QSAR
quantitative structure activity relationships
- rf
Random forest
- ΔRNS
Rank normalized top score
- RT
Reverse Transcriptase
- svc
support vector classification
Footnotes
Competing interests:
S.E. is owner, T.R.L. and K.M.Z., are employees, and A.M.C and D.P.R. are consultants of Collaborations Pharmaceuticals, Inc.
Supporting further details on the models, structures of public molecules and computational models are available. This material is available free of charge via the Internet at http://pubs.acs.org. Assay Central models are available upon request from the authors. Obtaining the dataset in ChemDB requires interested parties to contact NIH NIAID and has restrictions on reuse.
REFERENCES
- 1.WHO HIV/AIDS. http://www.who.int/news-room/fact-sheets/detail/hiv-aids
- 2.Kinch MS; Patridge E An analysis of FDA-approved drugs for infectious disease: HIV/AIDS drugs. Drug Discov Today 2014, 19, (10), 1510–3. [DOI] [PubMed] [Google Scholar]
- 3.De Clercq E The nucleoside reverse transcriptase inhibitors, nonnucleoside reverse transcriptase inhibitors, and protease inhibitors in the treatment of HIV infections (AIDS). Adv Pharmacol 2013, 67, 317–58. [DOI] [PubMed] [Google Scholar]
- 4.Stein DS; Moore KH Phosphorylation of nucleoside analog antiretrovirals: a review for clinicians. Pharmacotherapy 2001, 21, (1), 11–34. [DOI] [PubMed] [Google Scholar]
- 5.Dousson C; Alexandre FR; Amador A; Bonaric S; Bot S; Caillet C; Convard T; da Costa D; Lioure MP; Roland A; Rosinovsky E; Maldonado S; Parsy C; Trochet C; Storer R; Stewart A; Wang J; Mayes BA; Musiu C; Poddesu B; Vargiu L; Liuzzi M; Moussa A; Jakubik J; Hubbard L; Seifer M; Standring D Discovery of the Aryl-phospho-indole IDX899, a Highly Potent Anti-HIV Non-nucleoside Reverse Transcriptase Inhibitor. J Med Chem 2016, 59, (5), 1891–8. [DOI] [PubMed] [Google Scholar]
- 6.Xu Z; Ba M; Zhou H; Cao Y; Tang C; Yang Y; He R; Liang Y; Zhang X; Li Z; Zhu L; Guo Y; Guo C 2,4,5-Trisubstituted thiazole derivatives: a novel and potent class of non-nucleoside inhibitors of wild type and mutant HIV-1 reverse transcriptase. Eur J Med Chem 2014, 85, 27–42. [DOI] [PubMed] [Google Scholar]
- 7.Martins S; Ramos MJ; Fernandes PA The current status of the NNRTI family of antiretrovirals used in the HAART regime against HIV infection. Curr Med Chem 2008, 15, (11), 1083–95. [DOI] [PubMed] [Google Scholar]
- 8.Zhang Z; Hamatake R; Hong Z Clinical utility of current NNRTIs and perspectives of new agents in this class under development. Antivir Chem Chemother 2004, 15, (3), 121–34. [DOI] [PubMed] [Google Scholar]
- 9.Ghosn J; Chaix ML; Delaugerre C HIV-1 resistance to first- and second-generation non-nucleoside reverse transcriptase inhibitors. AIDS Rev 2009, 11, (3), 165–73. [PubMed] [Google Scholar]
- 10.Murphy EL; Collier AC; Kalish LA; Assmann SF; Para MF; Flanigan TP; Kumar PN; Mintz L; Wallach FR; Nemo GJ; Viral Activation Transfusion Study, I. Highly active antiretroviral therapy decreases mortality and morbidity in patients with advanced HIV disease. Ann Intern Med 2001, 135, (1), 17–26. [DOI] [PubMed] [Google Scholar]
- 11.Wainberg MA The Need for Development of New HIV-1 Reverse Transcriptase and Integrase Inhibitors in the Aftermath of Antiviral Drug Resistance. Scientifica (Cairo) 2012, 2012, 238278. [DOI] [PMC free article] [PubMed] [Google Scholar]
- 12.Svarovskaia ES; Cheslock SR; Zhang WH; Hu WS; Pathak VK Retroviral mutation rates and reverse transcriptase fidelity. Front Biosci 2003, 8, d117–34. [DOI] [PubMed] [Google Scholar]
- 13.Tan IL; McArthur JC HIV-associated neurological disorders: a guide to pharmacotherapy. CNS Drugs 2012, 26, (2), 123–34. [DOI] [PubMed] [Google Scholar]
- 14.Usach I; Melis V; Peris JE Non-nucleoside reverse transcriptase inhibitors: a review on pharmacokinetics, pharmacodynamics, safety and tolerability. J Int AIDS Soc 2013, 16, 1–14. [DOI] [PMC free article] [PubMed] [Google Scholar]
- 15.Kudalkar SN; Beloor J; Quijano E; Spasov KA; Lee WG; Cisneros JA; Saltzman WM; Kumar P; Jorgensen WL; Anderson KS From in silico hit to long-acting late-stage preclinical candidate to combat HIV-1 infection. Proc Natl Acad Sci U S A 2018, 115, (4), E802–E811. [DOI] [PMC free article] [PubMed] [Google Scholar]
- 16.Kang D; Ding X; Wu G; Huo Z; Zhou Z; Zhao T; Feng D; Wang Z; Tian Y; Daelemans D; De Clercq E; Pannecouque C; Zhan P; Liu X Discovery of Thiophene[3,2-d]pyrimidine Derivatives as Potent HIV-1 NNRTIs Targeting the Tolerant Region I of NNIBP. ACS Med Chem Lett 2017, 8, (11), 1188–1193. [DOI] [PMC free article] [PubMed] [Google Scholar]
- 17.Huang B; Wang X; Liu X; Chen Z; Li W; Sun S; Liu H; Daelemans D; De Clercq E; Pannecouque C; Zhan P; Liu X Discovery of novel DAPY-IAS hybrid derivatives as potential HIV-1 inhibitors using molecular hybridization based on crystallographic overlays. Bioorg Med Chem 2017, 25, (16), 4397–4406. [DOI] [PubMed] [Google Scholar]
- 18.Kang D; Fang Z; Li Z; Huang B; Zhang H; Lu X; Xu H; Zhou Z; Ding X; Daelemans D; De Clercq E; Pannecouque C; Zhan P; Liu X Design, Synthesis, and Evaluation of Thiophene[3,2-d]pyrimidine Derivatives as HIV-1 Non-nucleoside Reverse Transcriptase Inhibitors with Significantly Improved Drug Resistance Profiles. J Med Chem 2016, 59, (17), 7991–8007. [DOI] [PubMed] [Google Scholar]
- 19.Jorgensen WL Computer-aided discovery of anti-HIV agents. Bioorg Med Chem 2016, 24, (20), 4768–4778. [DOI] [PMC free article] [PubMed] [Google Scholar]
- 20.Ekins S; Bradford J; Dole K; Spektor A; Gregory K; Blondeau D; Hohman M; Bunin B A Collaborative Database And Computational Models For Tuberculosis Drug Discovery. Mol BioSystems 2010, 6, 840–851. [DOI] [PubMed] [Google Scholar]
- 21.Lane T; Russo DP; Zorn KM; Clark AM; Korotcov A; Tkachenko V; Reynolds RC; Perryman AL; Freundlich JS; Ekins S Comparing and Validating Machine Learning Models for Mycobacterium tuberculosis Drug Discovery. Mol Pharm 2018, 15, 4346–4360. [DOI] [PMC free article] [PubMed] [Google Scholar]
- 22.Ekins S; Reynolds R; Kim H; Koo M-S; Ekonomidis M; Talaue M; Paget SD; Woolhiser LK; Lenaerts AJ; Bunin BA; Connell N; Freundlich JS Bayesian Models Leveraging Bioactivity and Cytotoxicity Information for Drug Discovery. Chem Biol 2013, 20, 370–378. [DOI] [PMC free article] [PubMed] [Google Scholar]
- 23.Ekins S; Lage de Siqueira-Neto J; McCall L-I; Sarker M; Yadav M; Ponder EL; Kallel EA; Kellar D; Chen S; Arkin M; Bunin BA; McKerrow JH; Talcott C Machine Learning Models and Pathway Genome Data Base for Trypanosoma cruzi Drug Discovery PLoS Negl Trop Dis 2015, 9, (6), e0003878. [DOI] [PMC free article] [PubMed] [Google Scholar]
- 24.Ekins S; Freundlich JS; Clark AM; Anantpadma M; Davey RA; P. M Machine learning models identify molecules active against the Ebola virus in vitro. F1000Res 2016, 4, 1091. [DOI] [PMC free article] [PubMed] [Google Scholar]
- 25.Qureshi A; Kaur G; Kumar M AVCpred: an integrated web server for prediction and design of antiviral compounds. Chem Biol Drug Des 2017, 89, (1), 74–83. [DOI] [PMC free article] [PubMed] [Google Scholar]
- 26.Qureshi A; Rajput A; Kaur G; Kumar M HIVprotI: an integrated web based platform for prediction and design of HIV proteins inhibitors. J Cheminform 2018, 10, (1), 12. [DOI] [PMC free article] [PubMed] [Google Scholar]
- 27.Jain Pancholi N; Gupta S; Sapre N; Sapre NS Design of novel leads: ligand based computational modeling studies on non-nucleoside reverse transcriptase inhibitors (NNRTIs) of HIV-1. Mol Biosyst 2014, 10, (2), 313–25. [DOI] [PubMed] [Google Scholar]
- 28.Plewczynski D; von Grotthuss M; Spieser SA; Rychlewski L; Wyrwicz LS; Ginalski K; Koch U Target specific compound identification using a support vector machine. Comb Chem High Throughput Screen 2007, 10, (3), 189–96. [DOI] [PubMed] [Google Scholar]
- 29.Kurczyk A; Warszycki D; Musiol R; Kafel R; Bojarski AJ; Polanski J Ligand-Based Virtual Screening in a Search for Novel Anti-HIV-1 Chemotypes. J Chem Inf Model 2015, 55, (10), 2168–77. [DOI] [PubMed] [Google Scholar]
- 30.Anon NIAID ChemDB HIV, Opportunistic Infection and Tuberculosis Therapeutics Database. https://chemdb.niaid.nih.gov
- 31.Korotcov A; Tkachenko V; Russo DP; Ekins S Comparison of Deep Learning With Multiple Machine Learning Methods and Metrics Using Diverse Drug Discovery Datasets. Mol Pharm 2018, 14, 4462–4475. [DOI] [PMC free article] [PubMed] [Google Scholar]
- 32.Russo DP; Zorn KM; Clark AM; Zhu H; Ekins S Comparing Multiple Machine Learning Algorithms and Metrics for Estrogen Receptor Binding Prediction. Mol Pharmaceutics 2018. [DOI] [PMC free article] [PubMed] [Google Scholar]
- 33.Rogers D; Hahn M Extended-connectivity fingerprints. J Chem Inf Model 2010, 50, (5), 742–54. [DOI] [PubMed] [Google Scholar]
- 34.Pedregosa F; Varoquaux G; Gramfort A; Michel V; Thirion B; Grisel O; Blondel M; Prettenhofer P; Weiss R; Dubourg V; Vanderplas J; Passos A; Cournapeau D; Brucher M; Perrot M; Duchesnay E Scikit-learn: Machine Learning in Python. J Mach Learn Res 2011, 12, 2825–2830. [Google Scholar]
- 35.Friedman N; Geiger D; Goldszmidt M Bayesian Network Classifiers. Mach Learn 1997, 29, 131–163. [Google Scholar]
- 36.Drucker H Improving Regressors using Boosting Techniques. https://pdfs.semanticscholar.org/8d49/e2dedb817f2c3330e74b63c5fc86d2399ce3.pdf
- 37.Breiman L Random Forests. Mach Learn 2001, 45, 5–32. [Google Scholar]
- 38.Cortes C; Vapnik V Support vector networks. Machine Learn 1995, 20, 273–293. [Google Scholar]
- 39.Altman NS An introduction to kernel and nearest-neighbor nonparametric regression. The American Statistician 1992, 46, 175–185. [Google Scholar]
- 40.LeCun Y; Bengio Y; Hinton G Deep learning. Nature 2015, 521, (7553), 436–44. [DOI] [PubMed] [Google Scholar]
- 41.Keras Anon. https://keras.io/ [Google Scholar]
- 42.Kim MT; Sedykh A; Chakravarti SK; Saiakhov RD; Zhu H Critical evaluation of human oral bioavailability for pharmaceutical drugs by using various cheminformatics approaches. Pharm Res 2014, 31, (4), 1002–14. [DOI] [PMC free article] [PubMed] [Google Scholar]
- 43.Solimeo R; Zhang J; Kim M; Sedykh A; Zhu H Predicting chemical ocular toxicity using a combinatorial QSAR approach. Chem Res Toxicol 2012, 25, (12), 2763–9. [DOI] [PMC free article] [PubMed] [Google Scholar]
- 44.Sprague B; Shi Q; Kim MT; Zhang L; Sedykh A; Ichiishi E; Tokuda H; Lee KH; Zhu H Design, synthesis and experimental validation of novel potential chemopreventive agents using random forest and support vector machine binary classifiers. J Comput Aided Mol Des 2014, 28, (6), 631–46. [DOI] [PMC free article] [PubMed] [Google Scholar]
- 45.Wang W; Kim MT; Sedykh A; Zhu H Developing Enhanced Blood-Brain Barrier Permeability Models: Integrating External Bio-Assay Data in QSAR Modeling. Pharm Res 2015, 32, (9), 3055–65. [DOI] [PMC free article] [PubMed] [Google Scholar]
- 46.Sandoval PJ; Zorn KM; Clark AM; Ekins S; Wright SH Assessment of Substrate Dependent Ligand Interactions at the Organic Cation Transporter OCT2 Using Six Model Substrates. Mol Pharmacol 2018, 94, 1057–1068. [DOI] [PMC free article] [PubMed] [Google Scholar]
- 47.Clark AM Molecular Notebook. http://molmatinf.com/MolNote/ [Google Scholar]
- 48.Clark AM; Dole K; Coulon-Spector A; McNutt A; Grass G; Freundlich JS; Reynolds RC; Ekins S Open source bayesian models: 1. Application to ADME/Tox and drug discovery datasets. J Chem Inf Model 2015, 55, 1231–1245. [DOI] [PMC free article] [PubMed] [Google Scholar]
- 49.Clark AM; Ekins S Open Source Bayesian Models: 2. Mining A “big dataset” to create and validate models with ChEMBL. J Chem Inf Model 2015, 55, 1246–1260. [DOI] [PubMed] [Google Scholar]
- 50.Chen X; Meng Q; Qiu L; Zhan P; Liu H; De Clercq E; Pannecouque C; Liu X Design, Synthesis, and Anti-HIV Evaluation of Novel Triazine Derivatives Targeting the Entrance Channel of the NNRTI Binding Pocket. Chem Biol Drug Des 2015, 86, (1), 122–8. [DOI] [PubMed] [Google Scholar]
- 51.Famiglini V; La Regina G; Coluccia A; Masci D; Brancale A; Badia R; Riveira-Munoz E; Este JA; Crespan E; Brambilla A; Maga G; Catalano M; Limatola C; Formica FR; Cirilli R; Novellino E; Silvestri R Chiral Indolylarylsulfone Non-Nucleoside Reverse Transcriptase Inhibitors as New Potent and Broad Spectrum Anti-HIV-1 Agents. J Med Chem 2017, 60, (15), 6528–6547. [DOI] [PubMed] [Google Scholar]
- 52.Kang D; Fang Z; Huang B; Lu X; Zhang H; Xu H; Huo Z; Zhou Z; Yu Z; Meng Q; Wu G; Ding X; Tian Y; Daelemans D; De Clercq E; Pannecouque C; Zhan P; Liu X Structure-Based Optimization of Thiophene[3,2-d]pyrimidine Derivatives as Potent HIV-1 Non-nucleoside Reverse Transcriptase Inhibitors with Improved Potency against Resistance-Associated Variants. J Med Chem 2017, 60, (10), 4424–4443. [DOI] [PubMed] [Google Scholar]
- 53.Liu Z; Chen W; Zhan P; De Clercq E; Pannecouque C; Liu X Design, synthesis and anti-HIV evaluation of novel diarylnicotinamide derivatives (DANAs) targeting the entrance channel of the NNRTI binding pocket through structure-guided molecular hybridization. Eur J Med Chem 2014, 87, 52–62. [DOI] [PubMed] [Google Scholar]
- 54.Lu X; Li X; Yang J; Huang B; Kang D; Zhao F; Zhou Z; De Clercq E; Daelemans D; Pannecouque C; Zhan P; Liu X Arylazolyl(azinyl)thioacetanilides. Part 20: Discovery of novel purinylthioacetanilides derivatives as potent HIV-1 NNRTIs via a structure-based bioisosterism approach. Bioorg Med Chem 2016, 24, (18), 4424–33. [DOI] [PubMed] [Google Scholar]
- 55.Lu HH; Xue P; Zhu YY; Ju XL; Zheng XJ; Zhang X; Xiao T; Pannecouque C; Li TT; Gu SX Structural modifications of diarylpyrimidines (DAPYs) as HIV-1 NNRTIs: Synthesis, anti-HIV activities and SAR. Bioorg Med Chem 2017, 25, (8), 2491–2497. [DOI] [PubMed] [Google Scholar]
- 56.Wan ZY; Yao J; Tao Y; Mao TQ; Wang XL; Lu YP; Wang HF; Yin H; Wu Y; Chen FE; De Clercq E; Daelemans D; Pannecouque C Discovery of piperidin-4-yl-aminopyrimidine derivatives as potent non-nucleoside HIV-1 reverse transcriptase inhibitors. Eur J Med Chem 2015, 97, 1–9. [DOI] [PubMed] [Google Scholar]
- 57.Liu Z; Tian Y; Liu J; Huang B; Kang D; De Clercq E; Daelemans D; Pannecouque C; Zhan P; Liu X Design, synthesis and anti-HIV evaluation of novel diarylpyridine derivatives as potent HIV-1 NNRTIs. Eur J Med Chem 2017, 140, 383–391. [DOI] [PubMed] [Google Scholar]
- 58.Fraczek T; Kaminski R; Krakowiak A; Naessens E; Verhasselt B; Paneth P Diaryl ethers with carboxymethoxyphenacyl motif as potent HIV-1 reverse transcriptase inhibitors with improved solubility. J Enzyme Inhib Med Chem 2018, 33, (1), 9–16. [DOI] [PMC free article] [PubMed] [Google Scholar]
- 59.Monforte AM; De Luca L; Buemi MR; Agharbaoui FE; Pannecouque C; Ferro S Structural optimization of N1-aryl-benzimidazoles for the discovery of new non-nucleoside reverse transcriptase inhibitors active against wild-type and mutant HIV-1 strains. Bioorg Med Chem 2018, 26, (3), 661–674. [DOI] [PubMed] [Google Scholar]
- 60.Lu X; Yang J; Kang D; Gao P; Daelemans D; De Clercq E; Pannecouque C; Zhan P; Liu X The discovery of novel diarylpyri(mi)dine derivatives with high level activity against a wide variety of HIV-1 strains as well as against HIV-2. Bioorg Med Chem 2018, 26, (8), 2051–2060. [DOI] [PubMed] [Google Scholar]
- 61.Chen W; Zhan P; Daelemans D; Yang J; Huang B; De Clercq E; Pannecouque C; Liu X Structural optimization of pyridine-type DAPY derivatives to exploit the tolerant regions of the NNRTI binding pocket. Eur J Med Chem 2016, 121, 352–363. [DOI] [PubMed] [Google Scholar]
- 62.Tian Y; Liu Z; Liu J; Huang B; Kang D; Zhang H; De Clercq E; Daelemans D; Pannecouque C; Lee KH; Chen CH; Zhan P; Liu X Targeting the entrance channel of NNIBP: Discovery of diarylnicotinamide 1,4-disubstituted 1,2,3-triazoles as novel HIV-1 NNRTIs with high potency against wild-type and E138K mutant virus. Eur J Med Chem 2018, 151, 339–350. [DOI] [PMC free article] [PubMed] [Google Scholar]
- 63.Huo Z; Zhang H; Kang D; Zhou Z; Wu G; Desta S; Zuo X; Wang Z; Jing L; Ding X; Daelemans D; De Clercq E; Pannecouque C; Zhan P; Liu X Discovery of Novel Diarylpyrimidine Derivatives as Potent HIV-1 NNRTIs Targeting the “NNRTI Adjacent” Binding Site. ACS Med Chem Lett 2018, 9, (4), 334–338. [DOI] [PMC free article] [PubMed] [Google Scholar]
- 64.Oellien F; Cramer J; Beyer C; Ihlenfeldt WD; Selzer PM The impact of tautomer forms on pharmacophore-based virtual screening. J Chem Inf Model 2006, 46, (6), 2342–54. [DOI] [PubMed] [Google Scholar]
- 65.Carletta J Assessing agreement on classification tasks: The kappa statistic. Computational Linguistics 1996, 22, 249–254. [Google Scholar]
- 66.Cohen J A coefficient of agreement for nominal scales. Education and Psychological Measurement 1960, 20, 37–46. [Google Scholar]
- 67.Matthews BW Comparison of the predicted and observed secondary structure of T4 phage lysozyme. Biochim Biophys Acta 1975, 405, (2), 442–51. [DOI] [PubMed] [Google Scholar]
- 68.Korotcov A; Tkachenko V; Russo DP; Ekins S Comparison of Deep Learning With Multiple Machine Learning Methods and Metrics Using Diverse Drug Discovery Data Sets. Mol Pharm 2017, 14, (12), 4462–4475. [DOI] [PMC free article] [PubMed] [Google Scholar]
- 69.Caruana R; Niculescu-Mizil A In An empirical comparison of supervised learning algorithms, 23rd International Conference on Machine Learning, Pittsburgh, PA, 2006; Pittsburgh, PA. [Google Scholar]
- 70.Norinder U; Rybacka A; Andersson PL Conformal prediction to define applicability domain - A case study on predicting ER and AR binding. SAR QSAR Environ Res 2016, 27, (4), 303–16. [DOI] [PubMed] [Google Scholar]
- 71.Roberts DW; Patlewicz G; Kern PS; Gerberick F; Kimber I; Dearman RJ; Ryan CA; Basketter DA; Aptula AO Mechanistic applicability domain classification of a local lymph node assay dataset for skin sensitization. Chem Res Toxicol 2007, 20, (7), 1019–30. [DOI] [PubMed] [Google Scholar]
- 72.Roy K; Kar S; Ambure P On a simple approach for determining applicability domain of QSAR models. Chemometrics and Intelligent Laboratory Systems 2015, 145, 22–29. [Google Scholar]
- 73.Sushko I; Novotarskyi S; Korner R; Pandey AK; Cherkasov A; Li J; Gramatica P; Hansen K; Schroeter T; Muller KR; Xi L; Liu H; Yao X; Oberg T; Hormozdiari F; Dao P; Sahinalp C; Todeschini R; Polishchuk P; Artemenko A; Kuz’min V; Martin TM; Young DM; Fourches D; Muratov E; Tropsha A; Baskin I; Horvath D; Marcou G; Muller C; Varnek A; Prokopenko VV; Tetko IV Applicability domains for classification problems: Benchmarking of distance to models for Ames mutagenicity set. J Chem Inf Model 2010, 50, (12), 2094–111. [DOI] [PubMed] [Google Scholar]
- 74.Tropsha A; Golbraikh A Predictive QSAR modeling workflow, model applicability domains, and virtual screening. Curr Pharm Des 2007, 13, (34), 3494–504. [DOI] [PubMed] [Google Scholar]
- 75.Chong P; Sebahar P; Youngman M; Garrido D; Zhang H; Stewart EL; Nolte RT; Wang L; Ferris RG; Edelstein M; Weaver K; Mathis A; Peat A Rational design of potent non-nucleoside inhibitors of HIV-1 reverse transcriptase. J Med Chem 2012, 55, (23), 10601–9. [DOI] [PubMed] [Google Scholar]
- 76.Cote B; Burch JD; Asante-Appiah E; Bayly C; Bedard L; Blouin M; Campeau LC; Cauchon E; Chan M; Chefson A; Coulombe N; Cromlish W; Debnath S; Deschenes D; Dupont-Gaudet K; Falgueyret JP; Forget R; Gagne S; Gauvreau D; Girardin M; Guiral S; Langlois E; Li CS; Nguyen N; Papp R; Plamondon S; Roy A; Roy S; Seliniotakis R; St-Onge M; Ouellet S; Tawa P; Truchon JF; Vacca J; Wrona M; Yan Y; Ducharme Y Discovery of MK-1439, an orally bioavailable non-nucleoside reverse transcriptase inhibitor potent against a wide range of resistant mutant HIV viruses. Bioorg Med Chem Lett 2014, 24, (3), 917–22. [DOI] [PubMed] [Google Scholar]
- 77.Lai MT; Feng M; Falgueyret JP; Tawa P; Witmer M; DiStefano D; Li Y; Burch J; Sachs N; Lu M; Cauchon E; Campeau LC; Grobler J; Yan Y; Ducharme Y; Cote B; Asante-Appiah E; Hazuda DJ; Miller MD In vitro characterization of MK-1439, a novel HIV-1 nonnucleoside reverse transcriptase inhibitor. Antimicrob Agents Chemother 2014, 58, (3), 1652–63. [DOI] [PMC free article] [PubMed] [Google Scholar]
- 78.Mislak AC; Frey KM; Bollini M; Jorgensen WL; Anderson KS A mechanistic and structural investigation of modified derivatives of the diaryltriazine class of NNRTIs targeting HIV-1 reverse transcriptase. Biochim Biophys Acta 2014, 1840, (7), 2203–11. [DOI] [PMC free article] [PubMed] [Google Scholar]
- 79.Lee WG; Frey KM; Gallardo-Macias R; Spasov KA; Chan AH; Anderson KS; Jorgensen WL Discovery and crystallography of bicyclic arylaminoazines as potent inhibitors of HIV-1 reverse transcriptase. Bioorg Med Chem Lett 2015, 25, (21), 4824–7. [DOI] [PMC free article] [PubMed] [Google Scholar]
- 80.Frey KM; Puleo DE; Spasov KA; Bollini M; Jorgensen WL; Anderson KS Structure-based evaluation of non-nucleoside inhibitors with improved potency and solubility that target HIV reverse transcriptase variants. J Med Chem 2015, 58, (6), 2737–45. [DOI] [PMC free article] [PubMed] [Google Scholar]
- 81.Clark AM; Williams AJ; Ekins S Machines first, humans second: on the importance of algorithmic interpretation of open chemistry data. J Cheminform 2015, 7, 9. [DOI] [PMC free article] [PubMed] [Google Scholar]
- 82.Anon Deepchem. https://deepchem.io/
- 83.Anon Tensorflow. www.tensorflow.org
- 84.Anon Amazon Sagemaker. https://aws.amazon.com/sagemaker/ [Google Scholar]
- 85.Anon Cloud AutoML. https://cloud.google.com/automl/docs/ [Google Scholar]
- 86.Ma J; Sheridan RP; Liaw A; Dahl GE; Svetnik V Deep neural nets as a method for quantitative structure-activity relationships. J Chem Inf Model 2015, 55, (2), 263–74. [DOI] [PubMed] [Google Scholar]
- 87.Hop P; Allgood B; Yu J Geometric Deep Learning Autonomously Learns Chemical Features That Outperform Those Engineered by Domain Experts. Mol Pharm 2018, 15, (10), 4371–4377. [DOI] [PubMed] [Google Scholar]
- 88.Rodriguez-Perez R; Bajorath J Prediction of Compound Profiling Matrices, Part II: Relative Performance of Multitask Deep Learning and Random Forest Classification on the Basis of Varying Amounts of Training Data. ACS Omega 2018, 3, (9), 12033–12040. [DOI] [PMC free article] [PubMed] [Google Scholar]
- 89.Xu Y; Ma J; Liaw A; Sheridan RP; Svetnik V Demystifying Multitask Deep Neural Networks for Quantitative Structure-Activity Relationships. J Chem Inf Model 2017, 57, (10), 2490–2504. [DOI] [PubMed] [Google Scholar]
- 90.Ramsundar B; Kearnes S; Riley P; Webster D; Konerding D; Pande V Massively Multitask Networks for Drug Discovery. https://arxiv.org/abs/1502.02072 [Google Scholar]
- 91.Kearnes S; McCloskey K; Berndl M; Pande V; Riley P Molecular graph convolutions: moving beyond fingerprints. J Comput Aided Mol Des 2016, 30, (8), 595–608. [DOI] [PMC free article] [PubMed] [Google Scholar]
- 92.Kaiser TM; Burger PB; Butch CJ; Pelly SC; Liotta DC A Machine Learning Approach for Predicting HIV Reverse Transcriptase Mutation Susceptibility of Biologically Active Compounds. J Chem Inf Model 2018, 58, (8), 1544–1552. [DOI] [PubMed] [Google Scholar]
Associated Data
This section collects any data citations, data availability statements, or supplementary materials included in this article.