

Abstract
Social and economic disadvantage are hypothesized to increase the risk of disease and death via accelerated biological aging. Given that US blacks are socially and economically disadvantaged relative to whites, health disparities scholars expected that blacks would have shorter telomere length–a biomarker of cell aging–than whites. Yet the majority of studies have found that blacks have longer telomere length than whites. Using data from the National Health and Nutrition Examination Survey (n=3,761; 28.3% non-Hispanic black, 71.7% non-Hispanic white), we found that leukocyte telomere length was 4.00% (95% CI: 1.12%, 6.87%) longer among blacks compared to whites in the full sample, but differences were greatest among those with lower SES (5.66%; 95% CI: 0.10%, 10.32%), intermediate among those with middle SES (4.14%; 95% CI: 0.05%, 8.24%), and smallest among those with higher SES (2.33%; 95% CI: −3.02%, 7.67%). These results challenge purely genetic explanations for race differences in telomere length and point to a potential social-environmental cause of longer telomere length in US blacks.
Keywords: race/ethnicity, socioeconomic status, telomere length, weathering
Blacks in the US have higher prevalence than whites of many age-related diseases, including hypertension, diabetes, and cardiovascular disease (Mozaffarian et al., 2015); and average life expectancy at birth is 3.5 years lower for blacks compared to whites (Arias et al., 2017). One prominent explanation for black/white disparities in health is the weathering hypothesis, which contends that cumulative exposure to material hardship and psychosocial stressors results in accelerated biological aging among US blacks (Geronimus, 1992; Geronimus et al., 2006). Telomere length, a biomarker of cell aging that is inversely associated with age-related disease and death among adults (Blackburn et al., 2015), has been proposed as a potential empirical indicator of the theoretical construct of weathering (Geronimus et al., 2010). Contrary to expectations, however, a growing body of evidence suggests that blacks have longer telomere length than whites (see Table 1 for a summary of results). While some have argued that race differences in telomere length are due, at least in part, to genetic variation (Benetos & Aviv, 2017; Hamad et al., 2016; Hansen et al., 2016), others have shown that black/white differences vary according to social and economic conditions (Geronimus et al., 2015; Needham et al., 2017), challenging purely genetic explanations. While intriguing, prior studies are limited by small sample sizes and the use of unidimensional measures of socioeconomic status (SES). In the current study, we used data from the National Health and Nutrition Examination Survey, a large, nationally representative sample, to examine whether black/white differences in telomere length depend on SES. Our measure of SES, which includes 12 indicators of social and economic status, was derived from latent class analysis, a technique for identifying unobservable subgroups within a population. Results may help shed light on the mechanisms underlying observed black/white differences in telomere length, including the extent to which these differences are due to genetic versus environmental causes.
Table 1.
Summary of the Main Study Findings Regarding the Association between Race/Ethnicity and Telomere Length
| Study | Sample | Tissue | Measurement of Race | Method | Major Findings |
|---|---|---|---|---|---|
| Okuda et al. 2002 | 86 black, 29 Hispanic, 48 white, and 5 other race female and male neonates born at two New Jersey hospitals | White blood cells, umbilical artery, and foreskin | Abstracted from medical record | Southern blot | No significant difference in TRF length among black, white, and Hispanic newborns in any tissue type examined in bivariate analysis. |
| Hunt et al. 2008 | 711 black and 1742 white women and men from the Family Heart Study, aged 30–93, and the Bogalusa Heart Study, aged 19–37 | Leukocytes | Not discussed | Southern blot | Blacks had significantly longer age-adjusted telomere length than whites in both cohorts. |
| Diez Roux et al. 2009 | 279 black, 520 Hispanic, and 182 white women and men from the Multi-Ethnic Study of Atherosclerosis, aged 45–84 | Leukocytes | Not discussed | PCR | Blacks and Hispanics had shorter telomere length than whites in age- and sex-adjusted models, but the difference was not statistically significant. Race/ethnic differences became significant after adjustment for income, education, smoking, physical activity, diet, and BMI. |
| Diaz et al. 2010 | 133 black, 184 white, and 8 other race women and men recruited from a health science university, aged 40–64 | Leukocytes | Self-reported | PCR | Blacks had significantly longer telomere length than whites (unadjusted). |
| Geronimus et al. 2010 | 117 black and 115 white women from the Study of Women’s Health Across the Nation, aged 49–55 | PBMCs | Self-reported | PCR | Blacks had shorter telomere length than whites in models adjusted for age, estradiol, PCR batch, and study site, but the difference was not statistically significant. |
| Fitzpatrick et al. 2011 | 168 black and 968 white/other women and men from the Cardiovascular Health Study, aged 65+ | Leukocytes | Self-reported | Southern blot | Blacks had significantly longer telomere length than whites in age- and sex-adjusted models. |
| Zhu et al. 2011 | 319 black and 348 white female and male adolescents recruited from public high schools in Georgia, aged 14–18 | Leukocytes | Self-reported | PCR | Blacks had significantly longer telomere length than whites in age- and sex-adjusted models. |
| Needham et al. 2012 | 35 black and 35 white female and male children from the Admixture Mapping for Ethnic and Racial Insulin Complex Outcomes Study, aged 7–12 | Leukocytes | Not discussed | PCR | No significant difference in telomere length among blacks and whites in models adjusted for age, sex, family income, parent education, diet, physical activity, and BMI. |
| Adler et al. 2013 | 1053 black and 1546 white women and men from the Health, Aging, and Body Composition Study, aged 70–79 | Leukocytes | Self-reported | PCR | Blacks had significantly longer telomere length than whites (unadjusted), but the difference was not statistically significant in models adjusted for age, sex, chronic conditions, study site, and batch. |
| Needham et al. 2013 | 986 black, 1377 Mexican-American, and 2997 white women and men from the National Health and Nutrition Survey, 1999–2002, aged 20–84 | Leukocytes | Self-reported | PCR | Blacks had significantly longer telomere length than whites in models adjusted for age, age squared, sex, nativity, marital status, education, and poverty income ratio. |
| Rewak et al. 2014 | 27 black and 116 male and female newborns from the New England Family Study, aged ~41 years at follow up | Cord blood (infancy) and Leukocytes (adulthood) | Self-reported | PCR |
Blacks had significantly longer telomere length than whites at birth and in adulthood, but the rate of shortening was greater for blacks than for whites. Models were adjusted for sex, study site, and age at follow-up (in longitudinal analysis). |
| Carty et al. 2015 | 667 black and 858 white women from the Women’s Health Initiative, aged 50–79 | Leukocytes | Not discussed | Southern blot | Blacks had significantly longer age-adjusted telomere length than whites. |
| Drury et al. 2015 | 42 black and 24 white female and male neonates | Dried blood spots | Maternal race self-reported and assigned to child | MMq-PCR | Neonates born to black mothers had significantly longer telomere length than those born to white mothers in bivariate analysis and in models controlling for maternal age, maternal education, birth weight, sex of infant and paternal age. |
| Geronimus et al. 2015 | 239 black, Mexican, and white women and men from the Detroit Telomere Study, aged 25–64 (sample size by race/ethnicity not shown) | Leukocytes | Self-reported | PCR | No significant race differences in telomere length in age- and sex-adjusted models. |
| von Kanel et al. 2015 | 161 black and 180 white South African teachers from the Sympathetic Activity and Ambulatory Blood Pressure in Africans study, aged 23–66 | Leukocytes | Not discussed | PCR | Blacks had significantly shorter telomere length than whites in bivariate analysis and in models controlling for age, sex, years having lived in area, HIV infection, hypertension, BMI, C-reactive protein, and alcohol abuse. |
| Fatctor-Litvak et al. 2016 | Female and male neonates born to 45 black, 140 Hispanic, 273 white, and 32 other race mothers enrolled in the NuMoM2b study | Cord blood | Maternal race self-reported | Southern blots | Infants born to black mothers had significantly longer telomere length than those born to white mothers in bivariate analysis and in models controlling for parents’ telomere length, parents’ age, maternal race, and infant sex. |
| Hamad et al. 2016 | 1599 Black, 1110 Hispanic, 9034 white, and 191 other race women and men from the Health and Retirement Study, aged 50+ | Saliva | Self-reported | PCR | Blacks and Hispanics had longer telomere length than whites in bivariate analysis. Blacks had longer telomere length than whites in models adjusted for age, sex, education, and assets. After adjusting for genetic structure, the race difference was no longer statistically significant. |
| Hansen et al. 2016 | 100 East African, 90 European, and 97 African American women and men, mean age ~43 years | Leukocytes | Not discussed | Southern blots | Africans had longer telomere length than African Americans and Europeans in age- and sex-adjusted models. |
| Lynch et al. 2016 | 142 black, 679 Hispanic, and 689 white women and men from three medical centers, aged 38–63 | Leukocytes | Not discussed | Southern blots | Blacks and Hispanics had longer telomere length than whites in models controlling for age, gender, cancer status, DNA extraction method, and study site. |
| Raymond et al. 2016 | 101 black and 104 white African women and men with rheumatoid arthritis, mean age ~ 57 years | Leukocytes | Not discussed | PCR | Blacks had longer telomere length than whites (unadjusted), but the association was no longer significant after adjusting for age and gender. |
| Walton et al. 2016 | 128 Asian, 73 black, 88 white and 44 mixed/other female and male children from the London-based Exploration of Health and Lungs in the Environment study, aged 8–9 | Saliva | Self-reported and genetic ancestry analysis using random SNPs | MMq-PCR | Blacks had longer telomere length than Asians and whites in models adjusted for sex, BMI, environmental tobacco, and area-level deprivation. African ancestry was associated with longer telomere length in sex-adjusted models. |
| Weber et al. 2016 | 38 black and 38 white full-term male neonates from the Hormones in Umbilical Cord Blood study | Cord blood | Not discussed | PCR | No significant race difference in telomere length before or after adjusting for maternal age and parity, neonate birthweight and placental weight, and steroid and peptide hormones. |
| Jones et al. 2017 | 34 black and 12 white pregnant women recruited in New Orleans, aged 18–41 | Placental tissue (amnion, chorion, villus, umbilical cord) | Self-reported | MMq-PCR | Samples from black mothers had shorter telomere length than samples from white mothers in bivariate analysis, and the association was stronger after controlling for infant sex, maternal education and age at conception, gestational age, and duration to sample collection. The greatest difference was for chorionic telomere length. |
| Needham et al. 2017 | Female and male neonates born in Michigan to 63 black, 67 Hispanic, and 65 white mothers | Dried blood spots | Maternal race self-reported | PCR | Infants born to black mothers had significantly longer telomere length than those born to Hispanic or white mothers in bivariate analysis and in models controlling for maternal characteristics (education, receipt of public assistance, marital status, age, obstetric complications, and infection), infant sex, gestational age, and year of birth. In models stratified by receipt of public assistance, the race difference was only significant among those who did not receive public assistance. |
| Weber et al. 2018 | 22 black and 33 white maternal-neonate pairs from the Expanded Hormones in Umbilical Cord Blood study, mothers aged 18+ | Leukocytes (mothers) and cord blood (neonates) | Self-reported | PCR | No significant race difference in telomere length among mothers or neonates in maternal age- and plate-adjusted models. |
PBMCs=peripheral blood mononuclear cells, PCR=polymerase chain reaction, TRF=terminal restriction fragment, BMI=body mass index, MMq-PCR=monochrome multiplex quantitative real-time PCR, SNP=single nucleotide polymorphism.
Note: p-value <0.05 considered statistically significant.
Telomere length and the weathering hypothesis
Telomeres are the protective caps at the ends of chromosomes that promote chromosomal stability. Telomeres shorten naturally as a result of cell division (Harley et al., 1990) and in response to oxidative damage (von Zglinicki, 2002). Although telomerase can counteract shortening by elongating and protecting telomeres (Blackburn, 1997), this enzyme is kept downregulated in normal human cells (Blackburn et al., 2015). When telomeres become critically shortened, cellular senescence is triggered, and cells lose the ability to grow and divide (Blackburn, 2000; Blasco, 2005). In addition to being a key mechanism of cellular aging, recent studies also suggest that telomere shortening may be a causal determinant of cardiovascular disease and longevity (Aviv et al., 2015; Codd et al., 2013; Haycock et al., 2017a).
While older people tend to have shorter telomeres than younger people, there is substantial inter-individual variation in telomere length (Muezzinler et al., 2013). Estimates of heritability range from 30% to 80% (Blackburn et al., 2015); and genome-wide association studies in select populations have identified genetic variants associated with telomere length (Codd et al., 2013; Pooley et al., 2013). However, there is also growing evidence that economic, psychosocial, chemical, and behavioral exposures–including many that vary according to race and ethnicity–are associated with telomere length. For example, prior research suggests that low SES (Needham et al., 2013), neighborhood disorder (Needham et al., 2014), perceived stress (Schutte & Malouff, 2016), discrimination (Beatty Moody et al., 2019), air pollution (Zhao et al., 2018), cadmium exposure (Zota et al., 2015), sedentary behavior (Cherkas et al., 2008), and consumption of processed meat (Nettleton et al., 2008) and sugar-sweetened beverages (Leung et al., 2014) are associated with shorter telomere length. Given what we know about race differences in diseases of aging and premature mortality, as well as race differences in exposure to environmental (i.e., non-genetic) risk factors for short telomere length, previous research strongly suggests that blacks should have shorter telomere length than whites (see Figure 1). Next, we review the evidence for this claim.
Figure 1.
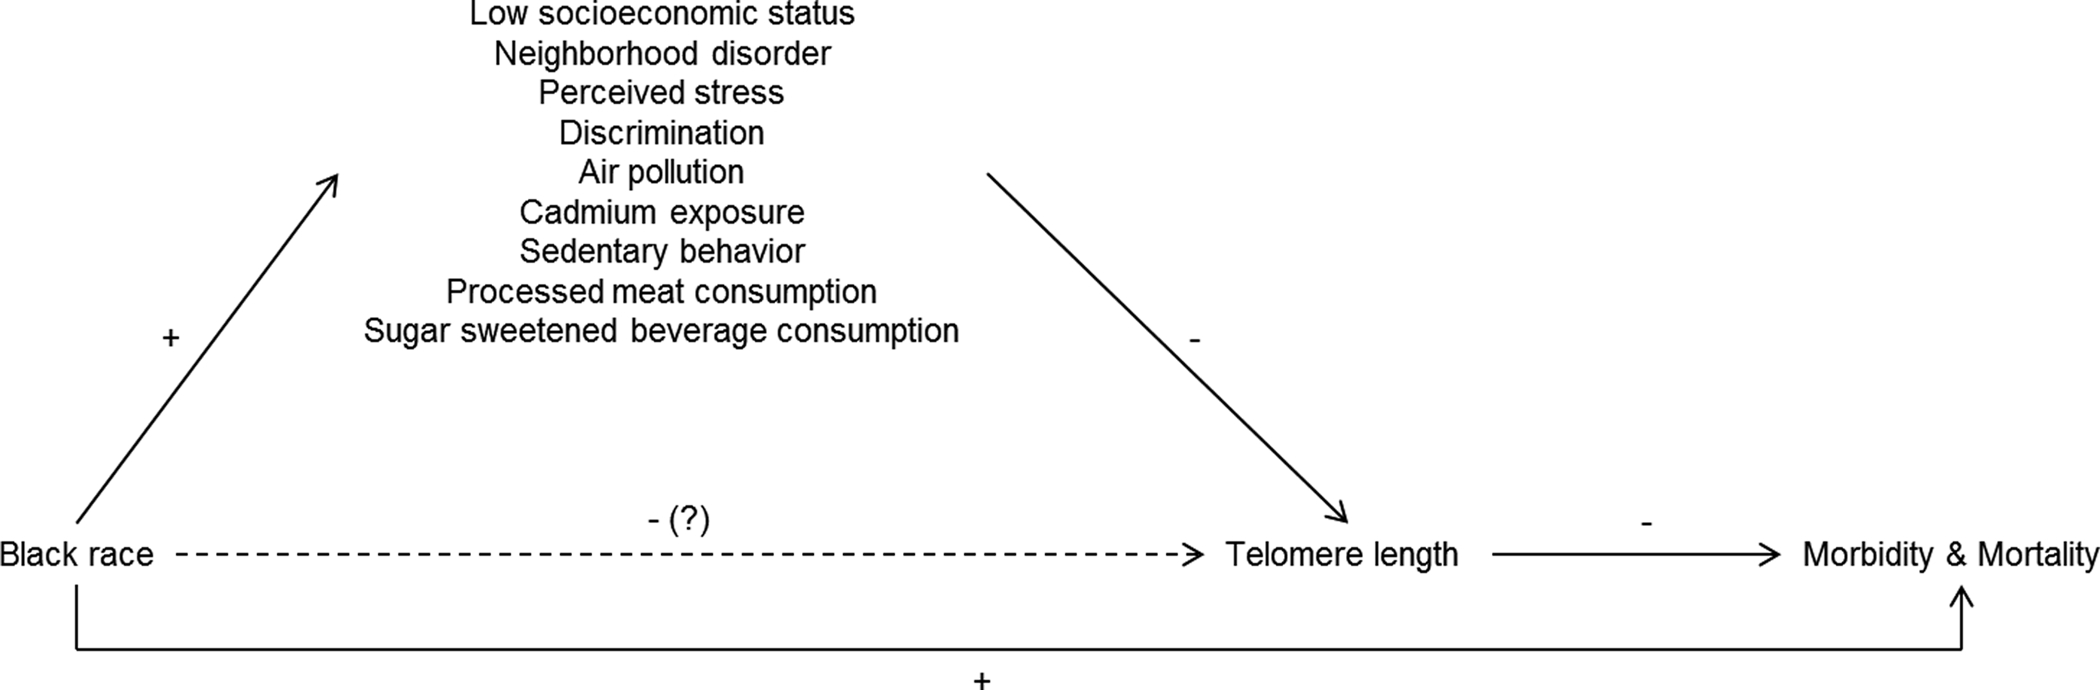
Simplified causal diagram depicting the effect of race on morbidity and mortality through telomere length. Solid lines show documented associations. The dashed line shows the expected association between black race and telomere length based on other known relationships in the model.
Race differences in telomere length
In general, the evidence suggests that there is either no race difference in newborn telomere length (Okuda et al., 2002; Weber et al., 2018; Weber et al., 2016) or that babies born to black mothers have longer telomere length than babies born to white mothers (Drury et al., 2015; Factor-Litvak et al., 2016; Needham et al., 2017; Rewak et al., 2014). The only exception was in a study examining placental telomere length, which found shorter telomere length in the placentas of black mothers (C. W. Jones et al., 2017). While studies of newborns have become increasingly common, few studies have examined race differences in telomere length during childhood or adolescence. Two previous studies found that black youth had longer telomere length than white youth (Walton et al., 2016; Zhu et al., 2011), whereas a third study found no difference (Needham et al., 2012). Previous studies examining race differences in newborn and child or adolescent telomere length are limited by small sample sizes (ranging from 46 to 490 in studies of newborns and 70–667 in studies of children and adolescents), which results in low statistical power, and non-random sampling, which limits internal and external validity. Differences in study results may be due to differences in the tissues examined, the methods used to measure telomere length, and characteristics of the samples (see Table 1 for study details).
Studies examining race differences in adult telomere length are more numerous and have produced more consistent findings with respect to black/white differences than studies examining newborn, child, or adolescent samples. Out of 15 unique studies that we reviewed, two found no difference in telomere length between blacks and whites (Geronimus et al., 2010; Geronimus et al., 2015), two found shorter telomere length in blacks compared to whites (Diez Roux et al., 2009; von Kanel et al., 2015), and 11 found longer telomere length in blacks compared to whites (N. Adler et al., 2013; Carty et al., 2015; Diaz et al., 2010; Fitzpatrick et al., 2011; Hamad et al., 2016; Hansen et al., 2016; Hunt et al., 2008; S. M. Lynch et al., 2016; Needham et al., 2013; Raymond et al., 2016; Rewak et al., 2014). Studies examining race differences in telomere length among adults have relatively large sample sizes (ranging from 205–5,808), and at least two previous studies included nationally representative samples (Hamad et al., 2016; Needham et al., 2013). Despite some discrepant findings, the bulk of the evidence suggests that blacks have longer telomere length than whites during adulthood, regardless of tissue type, measurement technique, or covariate adjustment.
Hypothesized mechanisms underlying race differences in telomere length
A number of post hoc explanations have been offered for the unexpected finding that blacks have longer telomere length than whites. First, many authors have speculated that racial differences in leukocyte cell subpopulations may contribute to differences in average telomere length in white blood cells, the most commonly examined tissue type in epidemiologic studies (Hunt et al., 2008; Needham et al., 2013; Rewak et al., 2014; Weber et al., 2018; Zhu et al., 2011). These differences may arise from fewer replications of hematopoietic stem cells and progenitor cells in blacks compared to whites (Hunt et al., 2008). Others have speculated that longer telomere length among blacks may reflect greater mortality selection, particularly in late life (Brown et al., 2016). A third explanation posits that blacks have longer telomere length in early life as a result of fetal programming of a compensatory mechanism designed to protect against accelerated telomere shortening in response to greater anticipated levels of lifetime stress exposure (Needham et al., 2017; Zhu et al., 2011). Researchers have also proposed genetic explanations for race differences in telomere length. Hamad et al. (2016) found that blacks in the Health and Retirement Study were more likely to have genetic markers associated with longer telomere length, although the authors note that it’s not clear if these genetic markers, which were identified in genome-wide association studies of individuals of European descent, determine telomere length in people with African ancestry. Hansen et al. (2016) concluded that polygenic adaptation resulted in shorter telomere length in people of European versus African descent and that short telomeres may reduce the risk of melanoma in people with lighter skin color.
In contrast to the explanations described above, others have argued that observed race differences in telomere length are a statistical artifact (Geronimus et al., 2015), which may arise from a variety of specification errors in regression models (Larzelere & Danelia, 2012). Examples of specification errors include the omission of relevant variables, as well as the failure to account for interaction effects (Larzelere & Danelia, 2012). Though few studies have examined heterogeneous treatment effects of race on telomere length, some prior evidence suggests that the association between race and telomere length depends on the socioeconomic characteristics of the sample. For example, in a socioeconomically homogeneous sample of South African teachers, von Kanel et al. (2012) found that whites had longer telomere length than blacks, a finding that is inconsistent with the overwhelming majority of studies in adults. In their Detroit-based study, where poverty rates were similar across racial/ethnic groups, Geronimus et al. (2015) found no race differences in telomere length, overall, but opposite patterns among those above and below the poverty line. Finally, in models stratified by receipt of public assistance, Needham et al. (2017) found that the black/white difference in newborn telomere length was only significant among Michigan neonates whose mothers did not receive public assistance during pregnancy. Taken together, the results of these studies suggest that race differences in telomere length may depend on SES.
Socioeconomic status as a moderator
Socioeconomic status is a latent, or unobservable, variable that includes the social and economic factors that shape an individual’s position in society (J. Lynch & Kaplan, 2000). Commonly used indicators of SES include educational attainment, income, wealth, and occupational prestige. US blacks tend to have lower SES than whites due to a variety of factors, including the historical legacy of slavery (Oliver & Shapiro, 2006), differences in opportunity structures resulting from residential segregation (Williams & Collins, 2001), and discrimination in employment, housing, and banking (Pager & Shepherd, 2008). Differences in SES are an important contributor to racial and ethnic health disparities, but disparities persist at all levels of SES (Williams et al., 2010). In fact, a number of studies have shown that black/white disparities are greater among high SES groups (Bjur et al., 2019; Farmer & Ferraro, 2005; Williams & Sternthal, 2010). Explanations include greater exposure to discrimination (Colen et al., 2018) and the health-related costs of goal-striving stress (Sellers & Neighbors, 2008). In the case of telomere length, blacks appear to have an advantage relative to whites; thus, it’s unclear whether the patterns that have been observed for other health-related outcomes, where blacks tend to be disadvantaged, would be seen for telomere length. The few studies that have examined moderation by SES have produced inconsistent results (Geronimus et al., 2015; Needham et al., 2017). These prior studies, which relied on simplistic, unidimensional measures of SES, were underpowered to examine interactions. Using data from a large, nationally representative sample, this study examined the hypothesis that black/white differences in telomere length depend on a composite measure of SES derived from latent class analysis.
METHODS
Data
Data are from the 1999–2000 and 2001–2002 waves of the National Health and Nutrition Examination Survey (NHANES). NHANES is a large-scale stratified, clustered survey administered by the Centers for Disease Control (CDC) which provides a publicly available and nationally representative assessment of health and nutrition status in the United States (CDC, 2005). We utilized information from the demographics and occupation questionnaire portions of the NHANES 1999–2002 survey instruments, as well as laboratory data pertaining to blood composition and telomere length. Telomere length was measured in 7,827 individuals over the age of 20, who had blood collected for five-part differential analysis and DNA purification (Needham et al., 2013). The primary analytic study sample includes an age-restricted subset of 3,761 non-Hispanic black and non-Hispanic white individuals under the age of 65 years.
Measures
Race and Hispanic origin were self-reported by study participants and recoded by NHANES staff into the following categories: Mexican-American, other Hispanic, non-Hispanic black, non-Hispanic white, and other race, including multi-racial. Following Jones (2000), we conceptualize race as a variable that precisely measures the social classification of individuals in racialized societies. In this way, self-reported race is an excellent measure of an individual’s position within the racialized social hierarchy, making it a powerful determinant of exposure to a myriad of health-related risk and protective factors. We focus on non-Hispanic blacks and whites in this analysis because previous work in NHANES and other studies has shown that differences in telomere length are most pronounced for these groups (see Table 1).
Telomere length was assayed using quantitative polymerase chain reaction (PCR) and reported as mean length relative to a standard reference DNA sample (mean T/S ratio) (Cawthon, 2002; Needham et al., 2013). A logarithmic transformation was applied to normalize the mean T/S ratio, and this transformed measure was considered as the outcome in all models. The measure of telomere length used in this study is an average of telomere length across all leukocyte cell types. Previous research has shown that, within the same individual, telomere length in different cell types varies (Lin et al., 2010). Furthermore, there is evidence of differences between blacks and whites in leukocyte cell subpopulations (Freedman et al., 1997). To account for potential confounding by leukocyte cell subpopulations, we controlled for white blood cell count, as well as relative percentages of lymphocytes, monocytes, segmented neutrophils, eosinophils, and basophils. Models also adjusted for age and sex.
To identify groups of individuals with similar socioeconomic status, 12 SES indicators were analyzed from the NHANES demographic and occupation questionnaires. Education level consisted of four categories: less than high school, high school, some college, or college graduate. Household size was the total number of people in the household, with values ranging from one to six and seven or more. Marital status was classified as never married, divorced or separated, married or living with a partner, or widowed. Household income was measured on an 11-point scale, from less than $5,000 to $75,000 or more. Additional measures of SES included food security (food insecure with hunger, food insecure without hunger, marginally food secure, or food secure); insurance status (uninsured, insured through Medicaid, or privately/Medicare insured); Special Supplemental Nutrition Program for Women, Infants, and Children (WIC) utilization (any WIC in the household in last 12 months or not); and two indicators of housing characteristics (owns home or not and family home detached or not). A five-category occupational classification was created based on two dimensions of occupation: white-collar versus blue-collar and technical skill. The five occupation categories (no work, low blue-collar, high blue-collar, low white-collar, and high white-collar) were derived from occupation group codes in the NHANES 1999–2002 occupation questionnaire, as used in Rehkopf et al. (2008) with NHANES III data, and based conceptually on the national statistics socioeconomic job classification (NS-SEC) (Rose & Pevalin, 2002). Employment status (not employed, disabled/student; not employed, homemaker; part-time employment; full-time employment; or retired) was also constructed from the occupation modules using three measures: type of work done last week, hours worked last week at all jobs, and main reason for not working last week. Lastly, we categorized the poverty income ratio (PIR) as less than 1.3, 1.3 to less than 3.5, and greater than or equal to 3.5 times the federal poverty level (see Kant & Graubard, 2013).
Statistical Methods
The purpose of this study was to explore whether the marginal association of self-reported race with telomere length is modified by SES. We used latent class analysis (LCA) to characterize SES as a single categorical variable by identifying underlying groups of study participants with similar characteristics based on the 12 demographic and occupational indicators described above (Goodman, 1974). Class constructions from LCA were incorporated in our second-step analytical model, which regressed the log-transformed mean T/S ratio on race, latent SES class, and their interaction, adjusting for age, sex, and blood composition. All analyses were carried out using SAS software, version 9.4 (SAS, 2013). We accounted for the features of the NHANES complex survey design, including the survey weights, primary sampling units (PSUs), and sampling strata, in the calculation of latent class assignments, analytical model effect estimates, and design-based standard errors using the SURVEYREG procedure.
Latent class membership was estimated using the LCA procedure developed by Lanza et al. (2007; 2011) to accommodate the presence of missing data across the SES variables, the complex NHANES survey sampling design, and the inclusion of age as an adjustment covariate. Missing data in the 12 SES variables was accounted for using full information maximum likelihood (FIML) estimation. Survey weights, PSUs, and sampling strata from the NHANES survey design were incorporated into the latent class model, and centered and scaled linear and squared age terms were used as adjustment covariates. For full model specifications and technical details on the estimation procedure, see Lanza et al. (2007). Latent classes were estimated using two variations on the LCA method. In the first approach, latent class model parameters were estimated independent of self-reported race for the study participants. In a sensitivity analysis, a multiple-group latent class model was fit with the latent class membership probabilities, item-response probabilities conditional on latent class membership, and polytomous logistic regression coefficients for the age-related covariates estimated conditional on race. To account for the uncertainty in SES class assignment that could be attributable to variability in the latent class estimation procedure, individuals were repeatedly assigned to latent classes by taking 1,000 independent draws based on the estimated probabilities of being assigned to each class. These results were then compared to results from a single model in which latent classes were assigned based on the individuals’ most likely (maximum-probability) class membership. Estimated probabilities of latent class membership were used to assess the assignment accuracy of the LCA models.
First, log-transformed telomere length was regressed on race, sex, age, and blood composition. Using the LCA results, we then fit a full analytical model with the SURVEYREG procedure, which regressed log-transformed telomere length on the above covariates, latent class membership, and the interactions between race and the latent classes. The final analytical model can be written as follows:
Where log (·) is the logarithmic transformation and is an indicator of whether the ith individual belongs to a certain group (1) or not (0). To account for uncertainty in latent class assignment, effect estimates were averaged across the 1,000 latent class assignments and reported along with their pooling-adjusted standard errors (Little & Rubin, 2014). These results were again compared to the estimates obtained from a single analytical model fit with latent class assignments estimated using the maximum-probability class assignment rule.
LCA was performed over k = 2, 3, …, to 10 latent classes. Due to the inclusion of the survey design variables in the latent class estimation procedure, traditional likelihood-based model selection criteria such as AIC or BIC are not appropriate metrics in this setting. We observed that the estimated values for these criteria continue to decrease with each additional class estimated. Given the diminishing returns in estimating additional classes, and our goal to achieve an interpretable measure of SES from our set of 12 socioeconomic variables, we took a more heuristic approach to determining the number of latent classes. Specifically, the number of estimated classes, k, was based on the agreement of three separate criteria. First, we fit a common factor model using the polychoric correlations between the individual SES variables. Based on this model, we conducted a visual elbow test, by which a plot of the eigenvalues was examined. We observed that a natural elbow occurs at three or four latent classes. This point of inflection was quantified by calculating the ratio of the total variance in our factor model to the number of variables and selected the number of latent classes to be the minimum value, k, such that the corresponding eigenvalues exceeded this ratio. By this criterion, three latent classes were retained. Second, we analyzed the probability of separation for the individual SES variables by each set of estimated latent classes. The LCA model with three estimated latent classes yielded the highest level of agreement between the probability of each latent class assignment and the observed class assignment over 1,000 replications, as compared to other k values. Lastly, we examined the separation of individual SES variables by each set of estimated classes. We found that the greatest separation occurred in estimating three latent classes, while beyond three classes, only specific levels of certain SES indicators were being isolated. In the estimation of four latent classes, for example, a gradation was present in the individual measures of SES across the first three estimated latent SES classes. However, the fourth class resembles the first class, except in the distribution of household size and marital status. This suggests that the fourth class did not fit into a natural ordering of SES as in the three-class solution, but rather isolated differences in family structure.
RESULTS
Characteristics of our primary study sample are presented in Table 2. As shown, a clear gradation is present in the distribution of the individual measures of SES across the three estimated latent SES classes. In particular, a higher proportion of individuals in the third latent class had systematically lower household income, education levels, and occupation/employment status, and higher levels of un-insurance, food insecurity, and WIC utilization as compared to the first and second latent classes. Based on the observed patterns in the individual SES variables across the three latent classes, these classes were qualitatively labeled “Higher SES,” “Middle SES,” and “Lower SES,” respectively. The average estimated probabilities of class membership for individuals assigned to each class, pooled over the 1,000 pseudo-datasets, are given in Table 3. These results suggest a high level of agreement between the probability of each latent class assignment and the observed class assignment, an indication of the classification accuracy of the model. These results were consistent between the pooled pseudo-dataset and maximum-probability class assignment methods, as well as across latent class models.
Table 2:
Characteristics of the Study Sample by Latent Class Membership
| Full Sample (n = 3,761) |
“Higher SES” (n = 1,243) |
“Middle SES” (n = 1,562) |
“Lower SES” (n = 956) |
Missing n (%) |
|
|---|---|---|---|---|---|
| Telomere Length, Mean T/S Ratio | 1.09 (0.27) | 1.07 (0.26) | 1.10 (0.27) | 1.11 (0.29) | N/A |
| Age, Years | 41.42 (12.75) | 45.73 (10.60) | 39.56 (12.89) | 38.87 (13.63) | N/A |
| Sex | 0 (0.00%) | ||||
| Female | 1,971 (52.41%) | 632 (50.84%) | 795 (50.90%) | 544 (56.90%) | - |
| Male | 1,790 (47.59%) | 611 (49.16%) | 767 (49.10%) | 412 (43.10%) | - |
| Race | N/A | ||||
| Non-Hispanic Black | 1,063 (28.30%) | 146 (11.75%) | 479 (30.67%) | 438 (45.82%) | - |
| Non-Hispanic White | 2,698 (71.70%) | 1,097 (88.25%) | 1,083 (69.33%) | 518 (54.18%) | - |
| Education | 4 (0.11%) | ||||
| Less Than High School | 717 (19.06%) | 46 (3.70%) | 286 (18.32%) | 385 (40.36%) | - |
| High School | 970 (25.79%) | 236 (19.00%) | 442 (28.32%) | 292 (30.61%) | - |
| Some College | 1,120 (29.78%) | 375 (28.74%) | 547 (35.04%) | 216 (22.64%) | - |
| College Graduate | 950 (25.26%) | 603 (48.55%) | 286 (18.32%) | 61 (6.39%) | - |
| Household Size | 0 (0.00%) | ||||
| 1 Person | 390 (10.37%) | 38 (3.06%) | 188 (12.04%) | 164 (17.15%) | - |
| 2 People | 1,113 (29.59%) | 494 (39.74%) | 422 (27.02%) | 197 (20.61%) | - |
| 3 People | 861 (22.89%) | 306 (24.62%) | 377 (24.14%) | 178 (18.62%) | - |
| 4 People | 719 (19.12%) | 267 (21.48%) | 277 (17.73%) | 175 (18.31%) | - |
| 5 People | 378 (10.05%) | 102 (8.21%) | 170 (10.88%) | 106 (11.09%) | - |
| 6 People | 147 (3.91%) | 26 (2.09%) | 64 (4.10%) | 57 (5.96%) | - |
| 7+ People | 153 (4.07%) | 10 (0.80%) | 64 (4.10%) | 79 (8.26%) | - |
| Marital Status | 170 (4.52%) | ||||
| Never Married | 722 (19.20%) | 45 (3.76%) | 391 (26.31%) | 286 (31.50%) | - |
| Divorced/Separated | 496 (13.19%) | 57 (4.76%) | 228 (15.34% | 211 (23.24%) | - |
| Married/Living with Partner | 2,285 (60.76%) | 1,082 (90.39%) | 837 (56.33%) | 366 (40.31%) | - |
| Widowed | 88 (2.34%) | 13 (1.09%) | 30 (2.02%) | 45 (4.96%) | - |
| PIR Category | 274 (7.29%) | ||||
| PIR < 1.3 | 747 (19.86%) | 0 (0.00%) | 11 (0.76%) | 736 (82.98%) | - |
| 1.3 ≤ PIR < 3.5 | 1,174 (31.22%) | 0 (0.00%) | 1,023 (70.89%) | 151 (17.02%) | - |
| PIR ≥ 3.5 | 1,566 (41.64%) | 1,157 (100.00%) | 409 (28.34%) | 0 (0.00%) | - |
| Employment Status | 167 (4.44%) | ||||
| Not Employed, Disabled/Student | 489 (13.00%) | 33 (2.79%) | 148 (9.87%) | 308 (33.77%) | - |
| Not Employed, Homemaker | 322 (8.56%) | 87 (7.35%) | 100 (6.67%) | 135 (14.80%) | - |
| Part-Time Employment | 555 (14.76%) | 188 (15.89%) | 218 (14.54%) | 149 (16.34%) | - |
| Full-Time Employment | 2,052 (54.56%) | 795 (67.20%) | 973 (64.91%) | 284 (31.14%) | - |
| Retired | 176 (4.68%) | 80 (6.76%) | 60 (4.00%) | 36 (3.95%) | - |
| Food Security Status | 160 (4.25%) | ||||
| Food Insecure with Hunger | 140 (3.72%) | 0 (0.00%) | 10 (0.68%) | 130 (13.86%) | - |
| Food Insecure without Hunger | 228 (6.06%) | 1 (0.08%) | 64 (4.37%) | 163 (17.38%) | - |
| Marginally Food Secure | 225 (5.98%) | 6 (0.50%) | 86 (5.88%) | 133 (14.18%) | - |
| Food Secure | 3,008 (79.98%) | 1,193 (99.42%) | 1,303 (89.06%) | 512 (54.58%) | - |
| Household Income | 365 (9.70%) | ||||
| $0 – $4,999 | 76 (2.02%) | 0 (0.00%) | 0 (0.00%) | 76 (8.87%) | - |
| $5,000 – $9,999 | 149 (3.96%) | 0 (0.00%) | 0 (0.00%) | 149 (17.39%) | - |
| $10,000 – $14,999 | 185 (4.92%) | 0 (0.00%) | 1 (0.07%) | 184 (21.47%) | - |
| $15,000 – $19,999 | 210 (5.58%) | 0 (0.00%) | 22 (1.58%) | 188 (21.95%) | - |
| $20,000 – $24,999 | 222 (5.90%) | 0 (0.00%) | 108 (7.75%) | 114 (13.30%) | - |
| $25,000 – $34,999 | 367 (9.76%) | 0 (0.00%) | 286 (20.52%) | 81 (9.45%) | - |
| $35,000 – $44,999 | 364 (9.68%) | 0 (0.00%) | 329 (23.60%) | 35 (4.08%) | - |
| $45,000 – $54,999 | 337 (8.96%) | 58 (5.07%) | 264 (18.94%) | 15 (1.75%) | - |
| $55,000 – $64,999 | 300 (7.98%) | 138 (12.05%) | 156 (11.19%) | 6 (0.70%) | - |
| $65,000 – $74,999 | 198 (5.26%) | 128 (11.18%) | 65 (4.66%) | 5 (0.58%) | - |
| $75,000 + | 988 (26.27%) | 821 (71.70%) | 163 (11.69%) | 4 (0.47%) | - |
| Home Type | 31 (0.82%) | ||||
| Family Home, Detached | 2,339 (62.19%) | 1,078 (87.29%) | 867 (56.15%) | 394 (41.43%) | - |
| Other | 1,391 (36.98%) | 157 (12.71%) | 677 (43.85%) | 557 (58.57%) | - |
| Insurance Status | 66 (1.75%) | ||||
| Uninsured | 667 (17.73%) | 9 (0.73%) | 318 (20.85%) | 340 (36.06%) | - |
| Insured, Medicaid | 188 (5.00%) | 0 (0.00%) | 5 (0.33%) | 183 (19.41%) | - |
| Insured, Private/Medicare | 2,840 (75.51%) | 1,218 (99.27%) | 1,202 (78.82%) | 420 (44.54%) | - |
| Occupation Category | 111 (2.95%) | ||||
| No Work | 70 (1.86%) | 0 (0.00%) | 15 (0.99%) | 55 (5.95%) | - |
| Low Blue Collar | 1,238 (32.92%) | 161 (13.24%) | 588 (38.94%) | 489 (52.92%) | - |
| High Blue Collar | 411 (10.93%) | 106 (8.72%) | 200 (13.25%) | 105 (11.36%) | - |
| Low White Collar | 826 (21.96%) | 303 (24.92%) | 356 (23.58%) | 167 (18.07%) | - |
| High White Collar | 1,105 (29.38%) | 646 (53.13%) | 351 (23.25%) | 108 (11.69%) | - |
| Home Ownership | 31 (0.82%) | ||||
| Does Not Own Home | 1,253 (33.32%) | 85 (6.88%) | 555 (35.90%) | 613 (64.59%) | - |
| Owns Home | 2,477 (65.86%) | 1,150 (93.12%) | 991 (64.10%) | 336 (35.41%) | - |
| WIC Utilization | 12 (0.32%) | ||||
| Did Not Receive WIC | 3,398 (90.35%) | 1,241 (100.00%) | 1,436 (92.23%) | 721 (75.81%) | - |
| Received WIC | 351 (9.33%) | 0 (0.00%) | 121 (7.77%) | 230 (24.19%) | - |
Table 3:
Race-Specific Within-Class Estimated Probability of Class Assignment
| Estimated Probability | Assigned Class 1: “Higher SES” | Assigned Class 2: “Middle SES” | Assigned Class 3: “Lower SES” | |||
|---|---|---|---|---|---|---|
| Black (n = 436) |
White (n = 1,071) |
Black (n = 172) |
White (n = 1,083) |
Black (n = 455) |
White (n = 544) |
|
| Class 1: “Higher SES” | 0.9262 | 0.9215 | 0.0532 | 0.0466 | 0.0353 | 0.0004 |
| Class 2: “Middle SES” | 0.0306 | 0.0777 | 0.8616 | 0.9022 | 0.0359 | 0.0337 |
| Class 3: “Lower SES” | 0.0432 | 0.0008 | 0.0852 | 0.0512 | 0.9288 | 0.9659 |
Table 4 presents the survey-weighted regression results from the comparative analytical models. As shown, the baseline model, which did not adjust for SES, found a statistically significant difference in telomere length between black and white individuals across the full study sample (p = 0.0107). The effect estimate translates to 4.00% longer telomere length in black individuals, on average (95% CI: 1.12%, 6.87%), adjusting for age, sex, and blood composition. Considering the interaction between race and the latent SES classes, the subsequent analytical models in Table 4 and the group-specific race effect estimates in Figure 2 suggest a potential pattern of effect heterogeneity across varying socioeconomic conditions. Specifically, the estimated race effect on telomere length was greatest in the lowest SES class (5.66%; 95% CI: 0.10%, 10.32%). The percent difference between black and white individuals was attenuated in the middle (4.14%; 95% CI: 0.05%, 8.24%) and highest (2.33%; 95% CI: −3.02%, 7.67%) SES classes when considering the sub-group specific effect of race in these SES classes. While the interaction between race and SES class in the outcome model was not statistically significant, the race effect within each SES class does exhibit a decreasing trend from lower to higher SES. These results were consistent between LCA methods and class assignment procedures.
Table 4:
Association between Telomere Length, Race, and SES under Various Analytical Models
| No Latent SES Class Estimates | Latent SES Class Estimates from Maximum-Probability Assignment | Latent SES Class Estimates Pooled over 1,000 Pseudo-Datasets | |||||
|---|---|---|---|---|---|---|---|
| Estimate (95% C.I.) |
p-Value | Estimate (95% C.I.) |
p-Value | Estimate (95% C.I.) |
p-Value | ||
| Intercept | − 0.2568 (− 0.6367, 0.1231) |
0.1956 | − 0.2676 (− 0.6475, 0.1123) |
0.1780 | − 0.2661 (− 0.6468, 0.1146) |
0.1707 | |
| Black | 0.0400 (0.0112, 0.0687) |
0.0107 | 0.0566 (0.0010, 0.1032) |
0.0241 | 0.0527 (0.0058, 0.0996) |
0.0276 | |
| Female | 0.0030 (− 0.0151, 0.0212) |
0.7454 | 0.0032 (− 0.0145, 0.0208) |
0.7283 | 0.0030 (− 0.0147, 0.0207) |
0.7410 | |
| Basophils (%) | 0.0278 (0.0011, 0.0545) |
0.0503 | 0.0274 (0.0008, 0.0541) |
0.0529 | 0.0275 (0.0009, 0.0540) |
0.0424 | |
| Lymphocyte (%) | 0.0029 (− 0.0010, 0.0067) |
0.1549 | 0.0028 (− 0.0010, 0.0067) |
0.1614 | 0.0029 (− 0.0010, 0.0067) |
0.1463 | |
| Monocyte (%) | − 0.0004 (−0.0060, 0.0051) |
0.8788 | − 0.0004 (− 0.0061, 0.0053) |
0.8930 | − 0.0004 (− 0.0060, 0.0053) |
0.8968 | |
| Segmented Neutrophils (%) | 0.0034 (− 0.0005, 0.0073) |
0.0940 | 0.0034 (− 0.0005, 0.0073) |
0.1018 | 0.0034 (− 0.0005, 0.0073) |
0.0859 | |
| White Blood Cell Count (SI) | − 0.0080 (− 0.0140, – 0.0020) |
0.0138 | − 0.0075 (− 0.0132, – 0.0018) |
0.0160 | − 0.0075 (− 0.0132, – 0.0019) |
0.0091 | |
| Age, Centered (10 yrs.) | − 0.0603 (− 0.0673, – 0.0533) |
< 0.0001 | − 0.0614 (− 0.0687, – 0.0541) |
< 0.0001 | − 0.0614 (− 0.0686, – 0.0541) |
< 0.0001 | |
| “Higher SES” vs. “Lower SES” | - | - | - | 0.0180 (− 0.0168, 0.0529) |
0.3193 | 0.0143 (− 0.0231, 0.0517) |
0.4531 |
| “Middle SES” vs. “Lower SES” | - | - | - | 0.0101 (− 0.0264, 0.0466) |
0.5919 | 0.0040 (− 0.0317, 0.0396) |
0.8275 |
| Black x “Higher SES” | - | - | - | − 0.0284 (− 0.0899, 0.0331) |
0.3724 | − 0.0294 (− 0.0907, 0.0319) |
0.3470 |
| Black x “Middle SES” | - | - | - | − 0.0180 (− 0.0694, 0.0333) |
0.4967 | − 0.0113 (− 0.0653, 0.0428) |
0.6830 |
Figure 2.
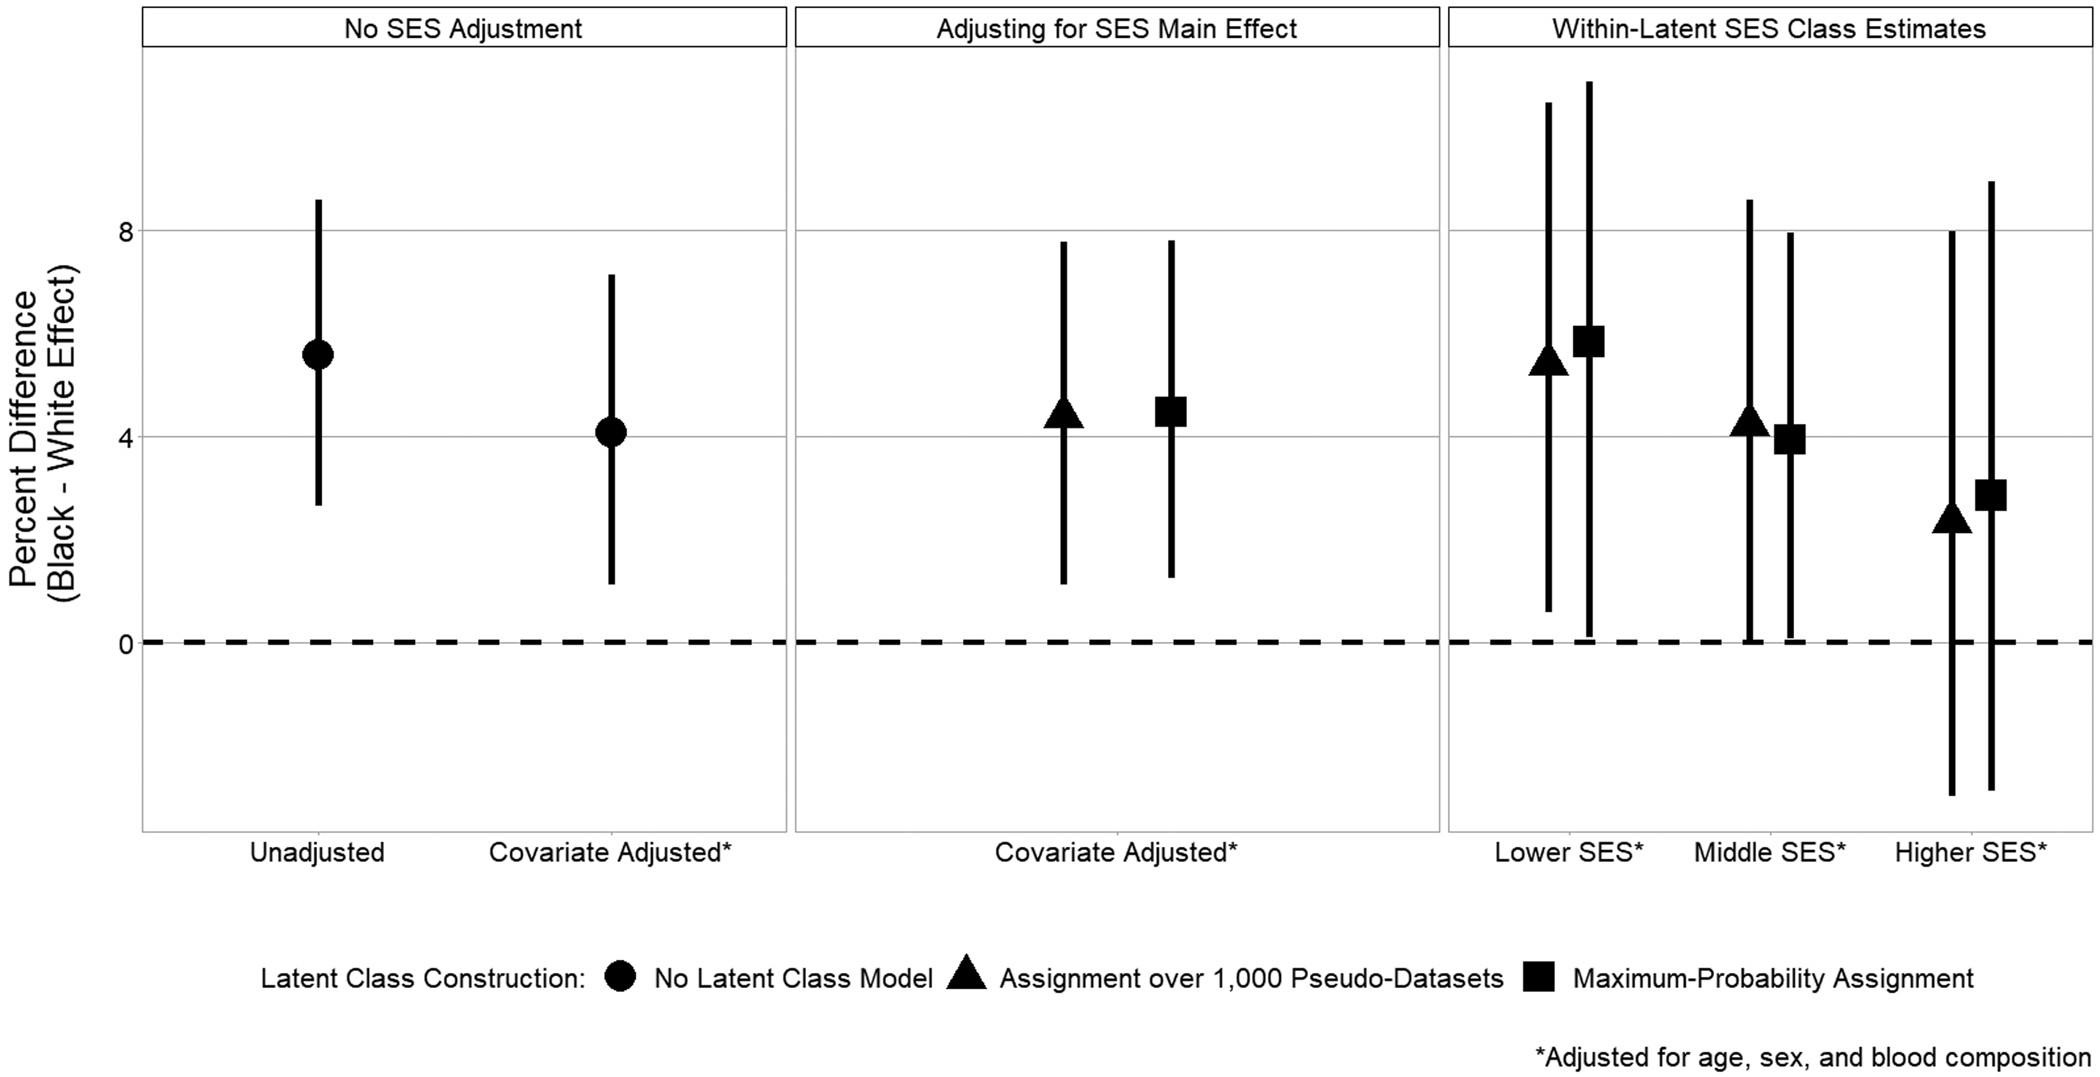
Within-SES Percent Difference in Telomere Length between Black and White Individuals
DISCUSSION
Social and economic disadvantage are hypothesized to increase the risk of age-related disease and death via accelerated biological aging (N. E. Adler & Stewart, 2010; Dressler et al., 2005). Consistent with this hypothesis, previous research has demonstrated associations of telomere length, a biomarker of cell aging, with socioeconomic disadvantage (Needham et al., 2013; Needham et al., 2012) and psychosocial stress exposure (Shalev et al., 2013). Individuals with lower SES and greater exposure to stressors tend to have shorter telomere length, which is, in turn, associated with increased risk for a number of diseases, including cardiovascular disease (Haycock et al., 2014), type 2 diabetes (Willeit et al., 2014), and some types of cancer (Wentzensen et al., 2011), as well as premature mortality (Rode et al., 2015). Given that US blacks tend to be disadvantaged relative to whites with respect to both exposures and outcomes associated with short telomere length, researchers hypothesized that blacks would have shorter telomere length than whites and that differences in telomere length may help explain racial and ethnic health disparities (Geronimus et al., 2010). However, the majority of studies have found that blacks have longer telomeres than whites at all ages, from birth to late life (see Table 1). Some have speculated that observed race differences in telomere length may be due to genetic factors (Benetos & Aviv, 2017; Hamad et al., 2016; Hansen et al., 2016), but two recent studies in small, geographically restricted samples found that black/white differences vary according to social and economic conditions (Geronimus et al., 2015; Needham et al., 2017), challenging purely genetic explanations. Using data from a nationally representative US sample, the current study found that black/white differences in telomere length may vary according to SES, with the greatest difference among those with lower SES.
Although the interaction between race and SES was not statistically significant in this study, black/white differences were greatest among those with lower SES, intermediate among those with middle SES, and smallest among those with higher SES. The race difference was statistically significant for those in the lower and middle SES classes but not for those in the higher SES class. Similarly, in a prior study of adults from low- to moderate-income neighborhoods in Detroit, Geronimus et al. (2015) found that blacks with household income below the federal poverty limit had longer telomere length than poor whites, while the race difference in telomere length among the non-poor did not appear to be significant. In contrast to these results, another Michigan study found that black/white differences in newborn telomere length were only significant among those with higher maternal SES, as indicated by no receipt of public assistance during pregnancy (Needham et al., 2017). Differences in study results may reflect differences in the life stage examined (infancy vs. adulthood) or may be due to chance, particularly given the small sample sizes examined in prior work. It should be noted that the pattern of findings reported in this study and the Geronimus et al. (2015) study run counter to a growing body of research showing that black/white health disparities are greatest for those with higher SES (Bjur et al., 2019; Farmer & Ferraro, 2005; Williams & Sternthal, 2010). Interestingly, though, this body of research focuses on race differences in health outcomes for which blacks are disadvantaged relative to whites, which does not appear to be the case for telomere length.
Sensitivity Analyses
To determine whether the results presented here are robust to different ways of measuring SES, we conducted three sets of sensitivity analyses (results are available from the authors upon request). First, we fit a multiple-group latent class model with the latent class membership probabilities estimated conditionally on the study participant’s self-reported race. After this alternative latent class assignment, we analyzed the key differences in the composition of the estimated SES classes between the two race groups. A similar gradation was present in the distributions of the SES indicators across the three estimated SES classes, stratified by race. Higher proportions of black and white individuals in the lower SES class had lower household income, education levels, occupation/employment status, and higher levels of un-insurance, food insecurity, and WIC utilization as compared to the higher SES classes. However, compared to whites, a higher proportion of blacks with characteristics associated with the lower SES class were assigned to the middle and higher SES classes. Thus, race-stratified models may better capture relative deprivation within race, but this approach may be less advantageous when classifying individuals in SES categories that are comparable across race.
Next, in addition to fitting latent class models, we adapted the typical exploratory factor analysis procedure to fit a common factor model using the polychoric correlations between the SES variables. We extracted the scores associated with the first latent factor and utilized their tertile categories as predictors in a survey-weighted regression of telomere length, adjusting for age, sex, and blood composition. The magnitude and direction of these effect estimates were comparable to those found using latent classes established under maximal probability class assignment rule. A significant interaction was found between race (black versus white) and the contrast between the first and second estimated SES factor tertiles (p = 0.0013).
Third, as education is commonly considered a foundational measure of SES, we directly modeled the effects of race and education on telomere length, adjusting for age, sex, and blood composition. A similar gradation was present in the main and interaction effects as shown in the main results. We found a significant difference in telomere length between college graduates and individuals with less than a high school education, adjusting for all other factors (p=0.0057). Additionally, the interaction between race (black versus white) and this contrast was also significant (p = 0.0267). Results from each of the sensitivity analyses were consistent with the effect patterns observed in our main results and provide concrete evidence of potential interactions of race with SES on telomere length.
Race, the environment, and telomere length
Evidence of a heterogeneous treatment effect of race on telomere length may provide insight into the mechanisms underlying racial differences in this biomarker of aging, which is now widely-used in epidemiologic research and is gaining popularity in the social and behavioral sciences. First, while we cannot rule out the possibility that genetic differences between individuals with European and African ancestry contribute to race differences in telomere length, the results of this study suggest that genetic explanations are, at minimum, incomplete, since the effect of race varies according to SES. In order to test genetic explanations, researchers must first identify the genetic variants associated with telomere length. To date, genome-wide association studies (GWAS) of telomere length have focused on populations of European and Asian descent. We are aware of only one GWAS in a sample of African descent (Zeiger et al., 2018). The authors were unable to replicate previously reported genetic associations in their sample of 492 children and adolescents and were underpowered to detect novel genetic variants associated with telomere length. For decades, scholars have warned against the dangers of attributing race differences in health-related outcomes to genetic factors without direct evidence (Cooper et al., 2003; Duster, 2005; Gravlee, 2009; Kaufman et al., 1997), yet the practice remains widespread (Roberts, 2012). The finding that black/white differences in telomere length are more pronounced among those with low SES suggests that environmental (i.e., non-genetic) factors may contribute to race differences in telomere length.
While the bulk of the evidence linking environmental risk factors (e.g., low SES, discrimination) and health-related outcomes (e.g., CVD, all-cause mortality) to telomere length suggests that blacks should have shorter telomeres than whites, there are two emerging literatures, which may help explain why the majority of previous studies have reported counterintuitive findings with respect to race differences in telomere length. First, a number of recent studies have shown that exposure to carcinogens, including polychlorinated biphenyls (PCBs), arsenic, and benzene, is associated with longer telomere length (Ameer et al., 2016; Bassig et al., 2014; Mitro et al., 2016; Shin et al., 2010; Villarreal et al., 2019). Furthermore, emerging evidence suggests that longer telomere length is a risk factor for many types of cancer, including lung, bladder, endometrial, and testicular cancer (Haycock et al., 2017b; Zhang et al., 2017). Thus, blacks may have longer telomere length than whites–along with greater cancer risk–as a result of exposure to environmental toxicants. Residential segregation in the US remains deeply entrenched, despite laws prohibiting discrimination in housing on the basis of race (Jargowsky, 2018); and residents of predominantly black neighborhoods are significantly more likely to be exposed to environmental hazards, including carcinogens (Mohai et al., 2009; Taylor, 2014). Research suggests that high SES blacks are only slightly less likely than low SES blacks to live in residentially segregated, low-income areas (Reardon et al., 2015; Williams et al., 2010), which may help explain our finding that blacks have longer telomere length than whites at all levels of SES but that the association is attenuated among those with higher SES. Previous research has also shown that blacks are more likely to be exposed to carcinogens at work (Angelon-Gaetz et al., 2010; Briggs et al., 2003). Future research should explore the hypothesis that residential and occupational segregation contribute to black/white differences in telomere length via exposure to carcinogens (see Figure 3).
Figure 3.

Simplified causal diagram depicting the effect of race on cancer-related morbidity and mortality through telomere length.
Strengths, limitations, and directions for future research
Key strengths of this analysis include the use of a large, nationally representative sample; the availability of data on leukocyte cell composition; and the use of LCA to characterize SES. First, the large sample size increases statistical power, making it possible to test the interaction of race with SES. The sample size for this study included 3,761 participants, of whom 1,063 were black and 2,698 were white. We are only aware of two previous studies that examined race differences in telomere length by SES. The first of these studies had a total sample size of 239 adults (Geronimus et al., 2015), while the other included a total of 195 newborns (Needham et al., 2017). Next, the use of a nationally representative sample increases internal validity by reducing non-random sampling bias and increases external validity by ensuring that results can be generalized to the target population of black and white adults in the US. Prior work has examined samples drawn from restricted geographic areas, including the city of Detroit (Geronimus et al., 2015) and the state of Michigan (Needham et al., 2017), and may not be generalizable to other locations. As noted in the introduction, a number of researchers have speculated that race differences in leukocyte cell subpopulations may contribute to black/white differences in telomere length (Hunt et al., 2008; Needham et al., 2013; Rewak et al., 2014; Weber et al., 2018; Zhu et al., 2011). Thus, a third strength of this analysis is that we were able to adjust for white blood cell count and relative percentages of lymphocytes, monocytes, segmented neutrophils, eosinophils, and basophils. Finally, the use of LCA allowed us to generate a composite measure of SES based on 12 indicators of social and economic status. This approach better captures the latent construct of SES than approaches used in prior research in this area, which focused on simplistic, unidimensional measures, including the poverty income ratio (Geronimus et al., 2015) and receipt of public assistance (Needham et al., 2017). Further, our two-stage pooled latent class assignment strategy appropriately accounted for uncertainty in estimated class membership, as opposed to methods which directly reify estimated latent classes into predictors (Elliott et al., 2020).
One important limitation of this study is the failure to include indicators of neighborhood socioeconomic conditions. Future research exploring race differences in telomere length should incorporate neighborhood-level variables, including neighborhood SES and measures of residential segregation. This will be particularly important for testing the hypothesis that black/white differences in telomere length persist at all levels of SES as a result of residential segregation and associated environmental exposures. Another limitation of this study is the restricted age range. Measures of telomere length are only available for NHANES respondents aged 20 and above, so we were unable to examine race differences in telomere length by SES among children and adolescents. In addition, we restricted the analysis to respondents under the age of 65 because the inclusion of older adults yielded latent class estimates that were not readily interpretable as ordinal SES groups. This is due to the fact that some SES indicators (e.g., employment status) are strongly correlated with age, resulting in a class defined primarily by age rather than SES. Results including adults aged 65 and above are available in Tables S1–S2. Finally, the current study was cross-sectional. Longitudinal data are needed in order to test hypotheses about telomere shortening (or lengthening). Some evidence suggests that the rate of telomere attrition may be more important for health-related outcomes than telomere length measured at one point in time (Duggan et al., 2014; Epel et al., 2009; Goglin et al., 2016; Masi et al., 2014). A small number of studies have shown that blacks have faster telomere attrition than whites (Chen et al., 2011; Rewak et al., 2014), which may contribute to excess morbidity and mortality among blacks, even for outcomes such as coronary heart disease and all-cause mortality that are associated with shorter telomere length in cross-sectional analyses.
Conclusions
While the results of this study do not offer any definitive explanations for the counterintuitive finding that US blacks have longer telomere length than whites, it does challenge purely genetic explanations by adding to a small but growing body of literature demonstrating that the effect of race on telomere length may also depend on social and economic conditions. An important but unresolved question is whether telomere length has utility in research on racial and ethnic health disparities. As a biomarker of stress and aging, it appeared, at first, to be an ideal measure of the theoretical construct of weathering. However, the evidence of black/white differences in telomere length is inconsistent with theoretical expectations. While this may be disappointing to health disparities scholars, there is still much to be learned about telomeres. For example, black/white differences in telomere length may result from differences in exposure to carcinogens and could potentially contribute to disparities in cancer-related morbidity and mortality. It is also possible that differences in telomere attrition, rather than cross-sectional telomere length, may help explain racial disparities in age-related diseases like coronary heart disease or type 2 diabetes. Furthermore, emerging evidence suggests that the effect of telomere length on a variety of health-related outcomes depends on race (Carty et al., 2015; Gebreab et al., 2017; Khan et al., 2017; Needham et al., 2015). Thus, a simple mediation model like that shown in Figure 1 may not accurately reflect the data and should be expanded to account for exposure-mediator interaction. While we urge biomedical researchers to avoid automatically attributing race differences in telomere length to unobserved genetic factors, we also urge social and behavioral scientists to continue to explore the role of telomere dynamics in black/white health disparities, but to do so with a greater appreciation of the complexity of the relationships among socially-constructed racial categories, risk factors for telomere shortening and lengthening, and different types of disease outcomes.
Supplementary Material
ACKNOWLEDGEMENTS
The NHANES telomere study was funded by grant R01AG033592 from the National Institute on Aging (Elissa Epel, PI).
Contributor Information
Belinda L. Needham, Department of Epidemiology and Center for Social Epidemiology and Population Health, University of Michigan.
Stephen Salerno, Department of Biostatistics, University of Michigan.
Emily Roberts, Department of Biostatistics, University of Michigan.
Jonathan Boss, Department of Biostatistics, University of Michigan.
Kristi L. Allgood, Department of Epidemiology and Center for Social Epidemiology and Population Health, University of Michigan
Bhramar Mukherjee, Department of Biostatistics, Department of Epidemiology, University of Michigan.
REFERENCES
- Adler N, Pantell MS, O’Donovan A, Blackburn E, Cawthon R, Koster A, et al. (2013). Educational attainment and late life telomere length in the Health, Aging and Body Composition Study. Brain Behav Immun, 27, 15–21. [DOI] [PMC free article] [PubMed] [Google Scholar]
- Adler NE, & Stewart J (2010). Health disparities across the lifespan: meaning, methods, and mechanisms. Ann N Y Acad Sci, 1186, 5–23. [DOI] [PubMed] [Google Scholar]
- Ameer SS, Xu YY, Engstrom K, Li HQ, Tallving P, Nermell B, et al. (2016). Exposure to Inorganic Arsenic Is Associated with Increased Mitochondrial DNA Copy Number and Longer Telomere Length in Peripheral Blood. Frontiers in Cell and Developmental Biology, 4. [DOI] [PMC free article] [PubMed] [Google Scholar]
- Angelon-Gaetz KA, Richardson DB, & Wing S (2010). Inequalities in the nuclear age: impact of race and gender on radiation exposure at the Savannah River Site (1951–1999). New Solut, 20, 195–210. [DOI] [PMC free article] [PubMed] [Google Scholar]
- Arias E, Heron M, & Xu JQ (2017). United States life tables, 2014 National vital statistics reports. Hyattsville, MD: National Center for Health Statistics. [PubMed] [Google Scholar]
- Aviv A, Kark JD, & Susser E (2015). Telomeres, atherosclerosis, and human longevity: a causal hypothesis. Epidemiology, 26, 295–299. [DOI] [PMC free article] [PubMed] [Google Scholar]
- Bassig BA, Zhang LP, Cawthon RM, Smith MT, Yin SN, Li GL, et al. (2014). Alterations in Leukocyte Telomere Length in Workers Occupationally Exposed to Benzene. Environmental and Molecular Mutagenesis, 55, 673–678. [DOI] [PMC free article] [PubMed] [Google Scholar]
- Beatty Moody DL, Leibel DK, Darden TM, Ashe JJ, Waldstein SR, Katzel LI, et al. (2019). Interpersonal-level discrimination indices, sociodemographic factors, and telomere length in African-Americans and Whites. Biol Psychol, 141, 1–9. [DOI] [PMC free article] [PubMed] [Google Scholar]
- Benetos A, & Aviv A (2017). Ancestry, Telomere Length, and Atherosclerosis Risk. Circ Cardiovasc Genet, 10. [DOI] [PMC free article] [PubMed] [Google Scholar]
- Bjur KA, Wi CI, Ryu E, Derauf C, Crow SS, King KS, et al. (2019). Socioeconomic Status, Race/Ethnicity, and Health Disparities in Children and Adolescents in a Mixed Rural-Urban Community-Olmsted County, Minnesota. Mayo Clin Proc, 94, 44–53. [DOI] [PMC free article] [PubMed] [Google Scholar]
- Blackburn EH (1997). The telomere and telomerase: nucleic acid-protein complexes acting in a telomere homeostasis system. A review. Biochemistry (Mosc), 62, 1196–1201. [PubMed] [Google Scholar]
- Blackburn EH (2000). Telomere states and cell fates. Nature, 408, 53–56. [DOI] [PubMed] [Google Scholar]
- Blackburn EH, Epel ES, & Lin J (2015). Human telomere biology: A contributory and interactive factor in aging, disease risks, and protection. Science, 350, 1193–1198. [DOI] [PubMed] [Google Scholar]
- Blasco MA (2005). Telomeres and human disease: ageing, cancer and beyond. Nat Rev Genet, 6, 611–622. [DOI] [PubMed] [Google Scholar]
- Briggs NC, Levine RS, Hall HI, Cosby O, Brann EA, & Hennekens CH (2003). Occupational risk factors for selected cancers among African American and White men in the United States. Am J Public Health, 93, 1748–1752. [DOI] [PMC free article] [PubMed] [Google Scholar]
- Brown L, Needham B, & Ailshire J (2016). Telomere Length Among Older U.S. Adults. J Aging Health, 898264316661390. [DOI] [PMC free article] [PubMed] [Google Scholar]
- Carty CL, Kooperberg C, Liu J, Herndon M, Assimes T, Hou L, et al. (2015). Leukocyte Telomere Length and Risks of Incident Coronary Heart Disease and Mortality in a Racially Diverse Population of Postmenopausal Women. Arterioscler Thromb Vasc Biol, 35, 2225–2231. [DOI] [PMC free article] [PubMed] [Google Scholar]
- Cawthon RM (2002). Telomere measurement by quantitative PCR. Nucleic Acids Res, 30, e47. [DOI] [PMC free article] [PubMed] [Google Scholar]
- CDC, C.J.N., editor. (2005). National health and nutrition examination survey.
- Chen W, Kimura M, Kim S, Cao X, Srinivasan SR, Berenson GS, et al. (2011). Longitudinal versus cross-sectional evaluations of leukocyte telomere length dynamics: age-dependent telomere shortening is the rule. J Gerontol A Biol Sci Med Sci, 66, 312–319. [DOI] [PMC free article] [PubMed] [Google Scholar]
- Cherkas LF, Hunkin JL, Kato BS, Richards JB, Gardner JP, Surdulescu GL, et al. (2008). The association between physical activity in leisure time and leukocyte telomere length. Archives of Internal Medicine, 168, 154–158. [DOI] [PubMed] [Google Scholar]
- Codd V, Nelson CP, Albrecht E, Mangino M, Deelen J, Buxton JL, et al. (2013). Identification of seven loci affecting mean telomere length and their association with disease. Nat Genet, 45, 422–427, 427e421–422. [DOI] [PMC free article] [PubMed] [Google Scholar]
- Colen CG, Ramey DM, Cooksey EC, & Williams DR (2018). Racial disparities in health among nonpoor African Americans and Hispanics: The role of acute and chronic discrimination. Soc Sci Med, 199, 167–180. [DOI] [PMC free article] [PubMed] [Google Scholar]
- Cooper RS, Kaufman JS, & Ward R (2003). Race and genomics. New England Journal of Medicine, 348, 1166–1170. [DOI] [PubMed] [Google Scholar]
- Diaz VA, Mainous AG, Player MS, & Everett CJ (2010). Telomere length and adiposity in a racially diverse sample. Int J Obes (Lond), 34, 261–265. [DOI] [PubMed] [Google Scholar]
- Diez Roux AV, Ranjit N, Jenny NS, Shea S, Cushman M, Fitzpatrick A, et al. (2009). Race/ethnicity and telomere length in the Multi-Ethnic Study of Atherosclerosis. Aging Cell, 8, 251–257. [DOI] [PMC free article] [PubMed] [Google Scholar]
- Dressler WW, Oths KS, & Gravlee CC (2005). Race and ethnicity in public health research: Models to explain health disparities. Annual Review of Anthropology, 34, 231–252. [Google Scholar]
- Drury SS, Esteves K, Hatch V, Woodbury M, Borne S, Adamski A, et al. (2015). Setting the trajectory: racial disparities in newborn telomere length. J Pediatr, 166, 1181–1186. [DOI] [PMC free article] [PubMed] [Google Scholar]
- Duggan C, Risques R, Alfano C, Prunkard D, Imayama I, Holte S, et al. (2014). Change in peripheral blood leukocyte telomere length and mortality in breast cancer survivors. J Natl Cancer Inst, 106, dju035. [DOI] [PMC free article] [PubMed] [Google Scholar]
- Duster T (2005). Medicine - Race and reification in science. Science, 307, 1050–1051. [DOI] [PubMed] [Google Scholar]
- Elliott MR, Zhao Z, Mukherjee B, Kanaya A, & Needham BL (2020). Methods to Account for Uncertainty in Latent Class Assignments When Using Latent Classes as Predictors in Regression Models, with Application to Acculturation Strategy Measures. Epidemiology, 31, 194–204. [DOI] [PMC free article] [PubMed] [Google Scholar]
- Epel ES, Merkin SS, Cawthon R, Blackburn EH, Adler NE, Pletcher MJ, et al. (2009). The rate of leukocyte telomere shortening predicts mortality from cardiovascular disease in elderly men. Aging-Us, 1, 81–88. [DOI] [PMC free article] [PubMed] [Google Scholar]
- Factor-Litvak P, Susser E, Kezios K, McKeague I, Kark JD, Hoffman M, et al. (2016). Leukocyte Telomere Length in Newborns: Implications for the Role of Telomeres in Human Disease. Pediatrics, 137. [DOI] [PMC free article] [PubMed] [Google Scholar]
- Farmer MM, & Ferraro KF (2005). Are racial disparities in health conditional on socioeconomic status? Soc Sci Med, 60, 191–204. [DOI] [PubMed] [Google Scholar]
- Fitzpatrick AL, Kronmal RA, Kimura M, Gardner JP, Psaty BM, Jenny NS, et al. (2011). Leukocyte telomere length and mortality in the Cardiovascular Health Study. J Gerontol A Biol Sci Med Sci, 66, 421–429. [DOI] [PMC free article] [PubMed] [Google Scholar]
- Freedman DS, Gates L, Flanders WD, Van Assendelft OW, Barboriak JJ, Joesoef MR, et al. (1997). Black/white differences in leukocyte subpopulations in men. Int J Epidemiol, 26, 757–764. [DOI] [PubMed] [Google Scholar]
- Gebreab SY, Manna ZG, Khan RJ, Riestra P, Xu R, & Davis SK (2017). Less Than Ideal Cardiovascular Health Is Associated With Shorter Leukocyte Telomere Length: The National Health and Nutrition Examination Surveys, 1999–2002. J Am Heart Assoc, 6. [DOI] [PMC free article] [PubMed] [Google Scholar]
- Geronimus AT (1992). The weathering hypothesis and the health of African-American women and infants: evidence and speculations. Ethn Dis, 2, 207–221. [PubMed] [Google Scholar]
- Geronimus AT, Hicken M, Keene D, & Bound J (2006). “Weathering” and age patterns of allostatic load scores among blacks and whites in the United States. Am J Public Health, 96, 826–833. [DOI] [PMC free article] [PubMed] [Google Scholar]
- Geronimus AT, Hicken MT, Pearson JA, Seashols SJ, Brown KL, & Cruz TD (2010). Do US Black Women Experience Stress-Related Accelerated Biological Aging?: A Novel Theory and First Population-Based Test of Black-White Differences in Telomere Length. Hum Nat, 21, 19–38. [DOI] [PMC free article] [PubMed] [Google Scholar]
- Geronimus AT, Pearson JA, Linnenbringer E, Schulz AJ, Reyes AG, Epel ES, et al. (2015). Race-Ethnicity, Poverty, Urban Stressors, and Telomere Length in a Detroit Community-based Sample. J Health Soc Behav, 56, 199–224. [DOI] [PMC free article] [PubMed] [Google Scholar]
- Goglin SE, Farzaneh-Far R, Epel ES, Lin J, Blackburn EH, & Whooley MA (2016). Change in Leukocyte Telomere Length Predicts Mortality in Patients with Stable Coronary Heart Disease from the Heart and Soul Study. PLoS One, 11, e0160748. [DOI] [PMC free article] [PubMed] [Google Scholar]
- Goodman LAJB (1974). Exploratory latent structure analysis using both identifiable and unidentifiable models. 61, 215–231. [Google Scholar]
- Gravlee CC (2009). How Race Becomes Biology: Embodiment of Social Inequality. Am J Phys Anthropol, 139, 47–57. [DOI] [PubMed] [Google Scholar]
- Hamad R, Tuljapurkar S, & Rehkopf DH (2016). Racial and Socioeconomic Variation in Genetic Markers of Telomere Length: A Cross-Sectional Study of U.S. Older Adults. EBioMedicine, 11, 296–301. [DOI] [PMC free article] [PubMed] [Google Scholar]
- Hansen ME, Hunt SC, Stone RC, Horvath K, Herbig U, Ranciaro A, et al. (2016). Shorter telomere length in Europeans than in Africans due to polygenetic adaptation. Hum Mol Genet, 25, 2324–2330. [DOI] [PMC free article] [PubMed] [Google Scholar]
- Harley CB, Futcher AB, & Greider CW (1990). Telomeres shorten during ageing of human fibroblasts. Nature, 345, 458–460. [DOI] [PubMed] [Google Scholar]
- Haycock PC, Burgess S, Nounu A, Zheng J, Okoli GN, Bowden J, et al. (2017a). Association Between Telomere Length and Risk of Cancer and Non-Neoplastic Diseases: A Mendelian Randomization Study. JAMA Oncol, 3, 636–651. [DOI] [PMC free article] [PubMed] [Google Scholar]
- Haycock PC, Hemani G, & Aviv A (2017b). Telomere Length and Risk of Cancer and Non-neoplastic Diseases: Is Survivin the Ariadne’s Thread?-Reply. JAMA Oncol, 3, 1741–1742. [DOI] [PubMed] [Google Scholar]
- Haycock PC, Heydon EE, Kaptoge S, Butterworth AS, Thompson A, & Willeit P (2014). Leucocyte telomere length and risk of cardiovascular disease: systematic review and meta-analysis. BMJ, 349, g4227. [DOI] [PMC free article] [PubMed] [Google Scholar]
- Hunt S, Chen W, Gardner J, Kimura M, Srinivasan S, Eckfeldt J, et al. (2008). Leukocyte telomeres are longer in African Americans than in whites: The NHLBI Family Heart Study and the Bogalusa Heart Study. Aging Cell, Postprint. [DOI] [PMC free article] [PubMed] [Google Scholar]
- Jargowsky PA (2018). The persistence of segregation in the 21st century. Law and Inequality, 207, 207–230. [Google Scholar]
- Jones CP (2000). Levels of racism: a theoretic framework and a gardener’s tale. Am J Public Health, 90, 1212–1215. [DOI] [PMC free article] [PubMed] [Google Scholar]
- Jones CW, Gambala C, Esteves KC, Wallace M, Schlesinger R, O’Quinn M, et al. (2017). Differences in placental telomere length suggest a link between racial disparities in birth outcomes and cellular aging. Am J Obstet Gynecol, 216, 294 e291–294 e298. [DOI] [PMC free article] [PubMed] [Google Scholar]
- Kant AK, & Graubard BI (2013). Family income and education were related with 30-year time trends in dietary and meal behaviors of American children and adolescents. J Nutr, 143, 690–700. [DOI] [PMC free article] [PubMed] [Google Scholar]
- Kaufman JS, Cooper RS, & McGee DL (1997). Socioeconomic status and health in blacks and whites: the problem of residual confounding and the resiliency of race. Epidemiology, 8, 621–628. [PubMed] [Google Scholar]
- Khan RJ, Gebreab SY, Crespo PR, Xu R, Gaye A, & Davis SK (2017). Race-specific associations between health-related quality of life and cellular aging among adults in the United States: evidence from the National Health and Nutrition Examination Survey. Qual Life Res, 26, 2659–2669. [DOI] [PMC free article] [PubMed] [Google Scholar]
- Lanza ST, Collins LM, Lemmon DR, & Schafer JL (2007). PROC LCA: A SAS Procedure for Latent Class Analysis. Struct Equ Modeling, 14, 671–694. [DOI] [PMC free article] [PubMed] [Google Scholar]
- Lanza ST, Dziak JJ, Huang L, Xu S, & Collins, L.M.J.P.S.U.P., The Methodology Center (2011). Proc LCA & Proc LTA users’ guide (Version 1.3. 2). [Google Scholar]
- Larzelere RE, & Danelia K (2012). Regression artifacts In Salkind NJ (Ed.), Encyclopedia of Research Design pp. 1229–1230). Thousand Oaks, CA: SAGE Publications, Inc. [Google Scholar]
- Leung CW, Laraia BA, Needham BL, Rehkopf DH, Adler NE, Lin J, et al. (2014). Soda and cell aging: associations between sugar-sweetened beverage consumption and leukocyte telomere length in healthy adults from the National Health and Nutrition Examination Surveys. Am J Public Health, 104, 2425–2431. [DOI] [PMC free article] [PubMed] [Google Scholar]
- Lin J, Epel E, Cheon J, Kroenke C, Sinclair E, Bigos M, et al. (2010). Analyses and comparisons of telomerase activity and telomere length in human T and B cells: insights for epidemiology of telomere maintenance. J Immunol Methods, 352, 71–80. [DOI] [PMC free article] [PubMed] [Google Scholar]
- Little RJ, & Rubin DB (2014). Statistical analysis with missing data: John Wiley & Sons. [Google Scholar]
- Lynch J, & Kaplan G (2000). Socioeconomic position In Berkman LF, & Kawachi I (Eds.), Social Epidemiology pp. 13–35). New York: Oxford. [Google Scholar]
- Lynch SM, Peek MK, Mitra N, Ravichandran K, Branas C, Spangler E, et al. (2016). Race, Ethnicity, Psychosocial Factors, and Telomere Length in a Multicenter Setting. PLoS One, 11, e0146723. [DOI] [PMC free article] [PubMed] [Google Scholar]
- Masi S, D’Aiuto F, Martin-Ruiz C, Kahn T, Wong A, Ghosh AK, et al. (2014). Rate of telomere shortening and cardiovascular damage: a longitudinal study in the 1946 British Birth Cohort. Eur Heart J, 35, 3296–3303. [DOI] [PMC free article] [PubMed] [Google Scholar]
- Mitro SD, Birnbaum LS, Needham BL, & Zota AR (2016). Cross-sectional Associations between Exposure to Persistent Organic Pollutants and Leukocyte Telomere Length among U.S. Adults in NHANES, 2001–2002. Environ Health Perspect, 124, 651–658. [DOI] [PMC free article] [PubMed] [Google Scholar]
- Mohai P, Pellow D, & Roberts JT (2009). Environmental Justice. Annual Review of Environment and Resources, 34, 405–430. [Google Scholar]
- Mozaffarian D, Benjamin EJ, Go AS, Arnett DK, Blaha MJ, Cushman M, et al. (2015). Heart disease and stroke statistics--2015 update: a report from the American Heart Association. Circulation, 131, e29–322. [DOI] [PubMed] [Google Scholar]
- Muezzinler A, Zaineddin AK, & Brenner H (2013). A systematic review of leukocyte telomere length and age in adults. Ageing Res Rev, 12, 509–519. [DOI] [PubMed] [Google Scholar]
- Needham BL, Adler N, Gregorich S, Rehkopf D, Lin J, Blackburn EH, et al. (2013). Socioeconomic status, health behavior, and leukocyte telomere length in the National Health and Nutrition Examination Survey, 1999–2002. Soc Sci Med, 85, 1–8. [DOI] [PMC free article] [PubMed] [Google Scholar]
- Needham BL, Carroll JE, Diez Roux AV, Fitzpatrick AL, Moore K, & Seeman TE (2014). Neighborhood characteristics and leukocyte telomere length: the Multi-Ethnic Study of Atherosclerosis. Health Place, 28, 167–172. [DOI] [PMC free article] [PubMed] [Google Scholar]
- Needham BL, Fernandez JR, Lin J, Epel ES, & Blackburn EH (2012). Socioeconomic status and cell aging in children. Soc Sci Med, 74, 1948–1951. [DOI] [PubMed] [Google Scholar]
- Needham BL, Hicken MT, Govia IO, Mitchell C, & Abdou CM (2017). Maternal Social Disadvantage and Newborn Telomere Length in Archived Dried Blood Spots from the Michigan Neonatal Biobank. Biodemography Soc Biol, 63, 221–235. [DOI] [PubMed] [Google Scholar]
- Needham BL, Rehkopf D, Adler N, Gregorich S, Lin J, Blackburn EH, et al. (2015). Leukocyte telomere length and mortality in the National Health and Nutrition Examination Survey, 1999–2002. Epidemiology, 26, 528–535. [DOI] [PMC free article] [PubMed] [Google Scholar]
- Nettleton JA, Diez-Roux A, Jenny NS, Fitzpatrick AL, & Jacobs DR Jr. (2008). Dietary patterns, food groups, and telomere length in the Multi-Ethnic Study of Atherosclerosis (MESA). Am J Clin Nutr, 88, 1405–1412. [DOI] [PMC free article] [PubMed] [Google Scholar]
- Okuda K, Bardeguez A, Gardner JP, Rodriguez P, Ganesh V, Kimura M, et al. (2002). Telomere length in the newborn. Pediatr Res, 52, 377–381. [DOI] [PubMed] [Google Scholar]
- Oliver M, & Shapiro T (2006). Black Wealth / White Wealth. New York: Routledge. [Google Scholar]
- Pager D, & Shepherd H (2008). The sociology of discrimination: Racial discrimination in employment, housing, credit, and consumer markets. Annual Review of Sociology, 34, 181–209. [DOI] [PMC free article] [PubMed] [Google Scholar]
- Pooley KA, Bojesen SE, Weischer M, Nielsen SF, Thompson D, Amin Al Olama A, et al. (2013). A genome-wide association scan (GWAS) for mean telomere length within the COGS project: identified loci show little association with hormone-related cancer risk. Hum Mol Genet, 22, 5056–5064. [DOI] [PMC free article] [PubMed] [Google Scholar]
- Raymond AR, Brooksbank RL, Millen AM, Norton GR, Solomon A, Woodiwiss AJ, et al. (2016). Telomere length, endothelial activation and carotid atherosclerosis in black and white African patients with rheumatoid arthritis. Clin Exp Rheumatol, 34, 864–871. [PubMed] [Google Scholar]
- Reardon SF, Fox L, & Townsend J (2015). Neighborhood Income Composition by Household Race and Income, 1990–2009. Annals of the American Academy of Political and Social Science, 660, 78–97. [Google Scholar]
- Rehkopf DH, Berkman LF, Coull B, & Krieger N (2008). The non-linear risk of mortality by income level in a healthy population: US National Health and Nutrition Examination Survey mortality follow-up cohort, 1988–2001. BMC Public Health, 8, 383. [DOI] [PMC free article] [PubMed] [Google Scholar]
- Rewak M, Buka S, Prescott J, De Vivo I, Loucks EB, Kawachi I, et al. (2014). Race-related health disparities and biological aging: does rate of telomere shortening differ across blacks and whites? Biol Psychol, 99, 92–99. [DOI] [PMC free article] [PubMed] [Google Scholar]
- Roberts D (2012). Debating the Cause of Health Disparities Implications for Bioethics and Racial Equality. Cambridge Quarterly of Healthcare Ethics, 21, 332–341. [DOI] [PubMed] [Google Scholar]
- Rode L, Nordestgaard BG, & Bojesen SE (2015). Peripheral blood leukocyte telomere length and mortality among 64,637 individuals from the general population. J Natl Cancer Inst, 107, djv074. [DOI] [PubMed] [Google Scholar]
- Rose D, & Pevalin DJ (2002). A researcher’s guide to the national statistics socio-economic classification: Sage. [DOI] [PubMed] [Google Scholar]
- SAS, S.J.C., NC: SAS Institute; (2013). 9.4 [Computer Program]. [Google Scholar]
- Schutte NS, & Malouff JM (2016). The Relationship Between Perceived Stress and Telomere Length: A Meta-analysis. Stress Health, 32, 313–319. [DOI] [PubMed] [Google Scholar]
- Sellers SL, & Neighbors HW (2008). Effects of goal-striving stress on the mental health of black Americans. J Health Soc Behav, 49, 92–103. [DOI] [PubMed] [Google Scholar]
- Shalev I, Entringer S, Wadhwa PD, Wolkowitz OM, Puterman E, Lin J, et al. (2013). Stress and telomere biology: a lifespan perspective. Psychoneuroendocrinology, 38, 1835–1842. [DOI] [PMC free article] [PubMed] [Google Scholar]
- Shin JY, Choi YY, Jeon HS, Hwang JH, Kim SA, Kang JH, et al. (2010). Low-dose persistent organic pollutants increased telomere length in peripheral leukocytes of healthy Koreans. Mutagenesis, 25, 511–516. [DOI] [PubMed] [Google Scholar]
- Taylor DE (2014). Toxic Communities: Environmental Racism, Industrial Pollution, and Residential Mobility. New York and London: New York University Press. [Google Scholar]
- Villarreal JJ, Ortiz BM, Garza SM, Armendariz DIR, Villa VDB, Rosales PC, et al. (2019). Telomere length analysis in residents of a community exposed to arsenic. Journal of Biochemical and Molecular Toxicology, 33. [DOI] [PubMed] [Google Scholar]
- von Kanel R (2012). Psychosocial stress and cardiovascular risk : current opinion. Swiss Med Wkly, 142, w13502. [DOI] [PubMed] [Google Scholar]
- von Kanel R, Malan NT, Hamer M, & Malan L (2015). Comparison of telomere length in black and white teachers from South Africa: the sympathetic activity and ambulatory blood pressure in Africans study. Psychosom Med, 77, 26–32. [DOI] [PubMed] [Google Scholar]
- von Zglinicki T (2002). Oxidative stress shortens telomeres. Trends Biochem Sci, 27, 339–344. [DOI] [PubMed] [Google Scholar]
- Walton RT, Mudway IS, Dundas I, Marlin N, Koh LC, Aitlhadj L, et al. (2016). Air pollution, ethnicity and telomere length in east London schoolchildren: An observational study. Environment International, 96, 41–47. [DOI] [PubMed] [Google Scholar]
- Weber KA, Heaphy CM, Joshu CE, Lu J, Rohrmann S, Bienstock JL, et al. (2018). Racial differences in maternal and umbilical cord blood leukocyte telomere length and their correlations. Cancer Causes Control. [DOI] [PMC free article] [PubMed] [Google Scholar]
- Weber KA, Heaphy CM, Rohrmann S, Gonzalez B, Bienstock JL, Agurs-Collins T, et al. (2016). Influence of In Utero Maternal and Neonate Factors on Cord Blood Leukocyte Telomere Length: Clues to the Racial Disparity in Prostate Cancer? Prostate Cancer, 2016, 3691650. [DOI] [PMC free article] [PubMed] [Google Scholar]
- Wentzensen IM, Mirabello L, Pfeiffer RM, & Savage SA (2011). The association of telomere length and cancer: a meta-analysis. Cancer Epidemiol Biomarkers Prev, 20, 1238–1250. [DOI] [PMC free article] [PubMed] [Google Scholar]
- Willeit P, Raschenberger J, Heydon EE, Tsimikas S, Haun M, Mayr A, et al. (2014). Leucocyte telomere length and risk of type 2 diabetes mellitus: new prospective cohort study and literature-based meta-analysis. PLoS One, 9, e112483. [DOI] [PMC free article] [PubMed] [Google Scholar]
- Williams DR, & Collins C (2001). Racial residential segregation: a fundamental cause of racial disparities in health. Public Health Rep, 116, 404–416. [DOI] [PMC free article] [PubMed] [Google Scholar]
- Williams DR, Mohammed SA, Leavell J, & Collins C (2010). Race, socioeconomic status, and health: complexities, ongoing challenges, and research opportunities. Ann N Y Acad Sci, 1186, 69–101. [DOI] [PMC free article] [PubMed] [Google Scholar]
- Williams DR, & Sternthal M (2010). Understanding racial-ethnic disparities in health: sociological contributions. J Health Soc Behav, 51 Suppl, S15–27. [DOI] [PMC free article] [PubMed] [Google Scholar]
- Zeiger AM, White MJ, Eng C, Oh SS, Witonsky J, Goddard PC, et al. (2018). Genetic Determinants of Telomere Length in African American Youth. Sci Rep, 8, 13265. [DOI] [PMC free article] [PubMed] [Google Scholar]
- Zhang X, Zhao Q, Zhu W, Liu T, Xie SH, Zhong LX, et al. (2017). The Association of Telomere Length in Peripheral Blood Cells with Cancer Risk: A Systematic Review and Meta-analysis of Prospective Studies. Cancer Epidemiol Biomarkers Prev, 26, 1381–1390. [DOI] [PubMed] [Google Scholar]
- Zhao B, Vo HQ, Johnston FH, & Negishi K (2018). Air pollution and telomere length: a systematic review of 12,058 subjects. Cardiovasc Diagn Ther, 8, 480–492. [DOI] [PMC free article] [PubMed] [Google Scholar]
- Zhu H, Wang X, Gutin B, Davis CL, Keeton D, Thomas J, et al. (2011). Leukocyte telomere length in healthy Caucasian and African-American adolescents: relationships with race, sex, adiposity, adipokines, and physical activity. J Pediatr, 158, 215–220. [DOI] [PMC free article] [PubMed] [Google Scholar]
- Zota AR, Needham BL, Blackburn EH, Lin J, Park SK, Rehkopf DH, et al. (2015). Associations of cadmium and lead exposure with leukocyte telomere length: findings from National Health and Nutrition Examination Survey, 1999–2002. Am J Epidemiol, 181, 127–136. [DOI] [PMC free article] [PubMed] [Google Scholar]
Associated Data
This section collects any data citations, data availability statements, or supplementary materials included in this article.