
Fig. C.2.
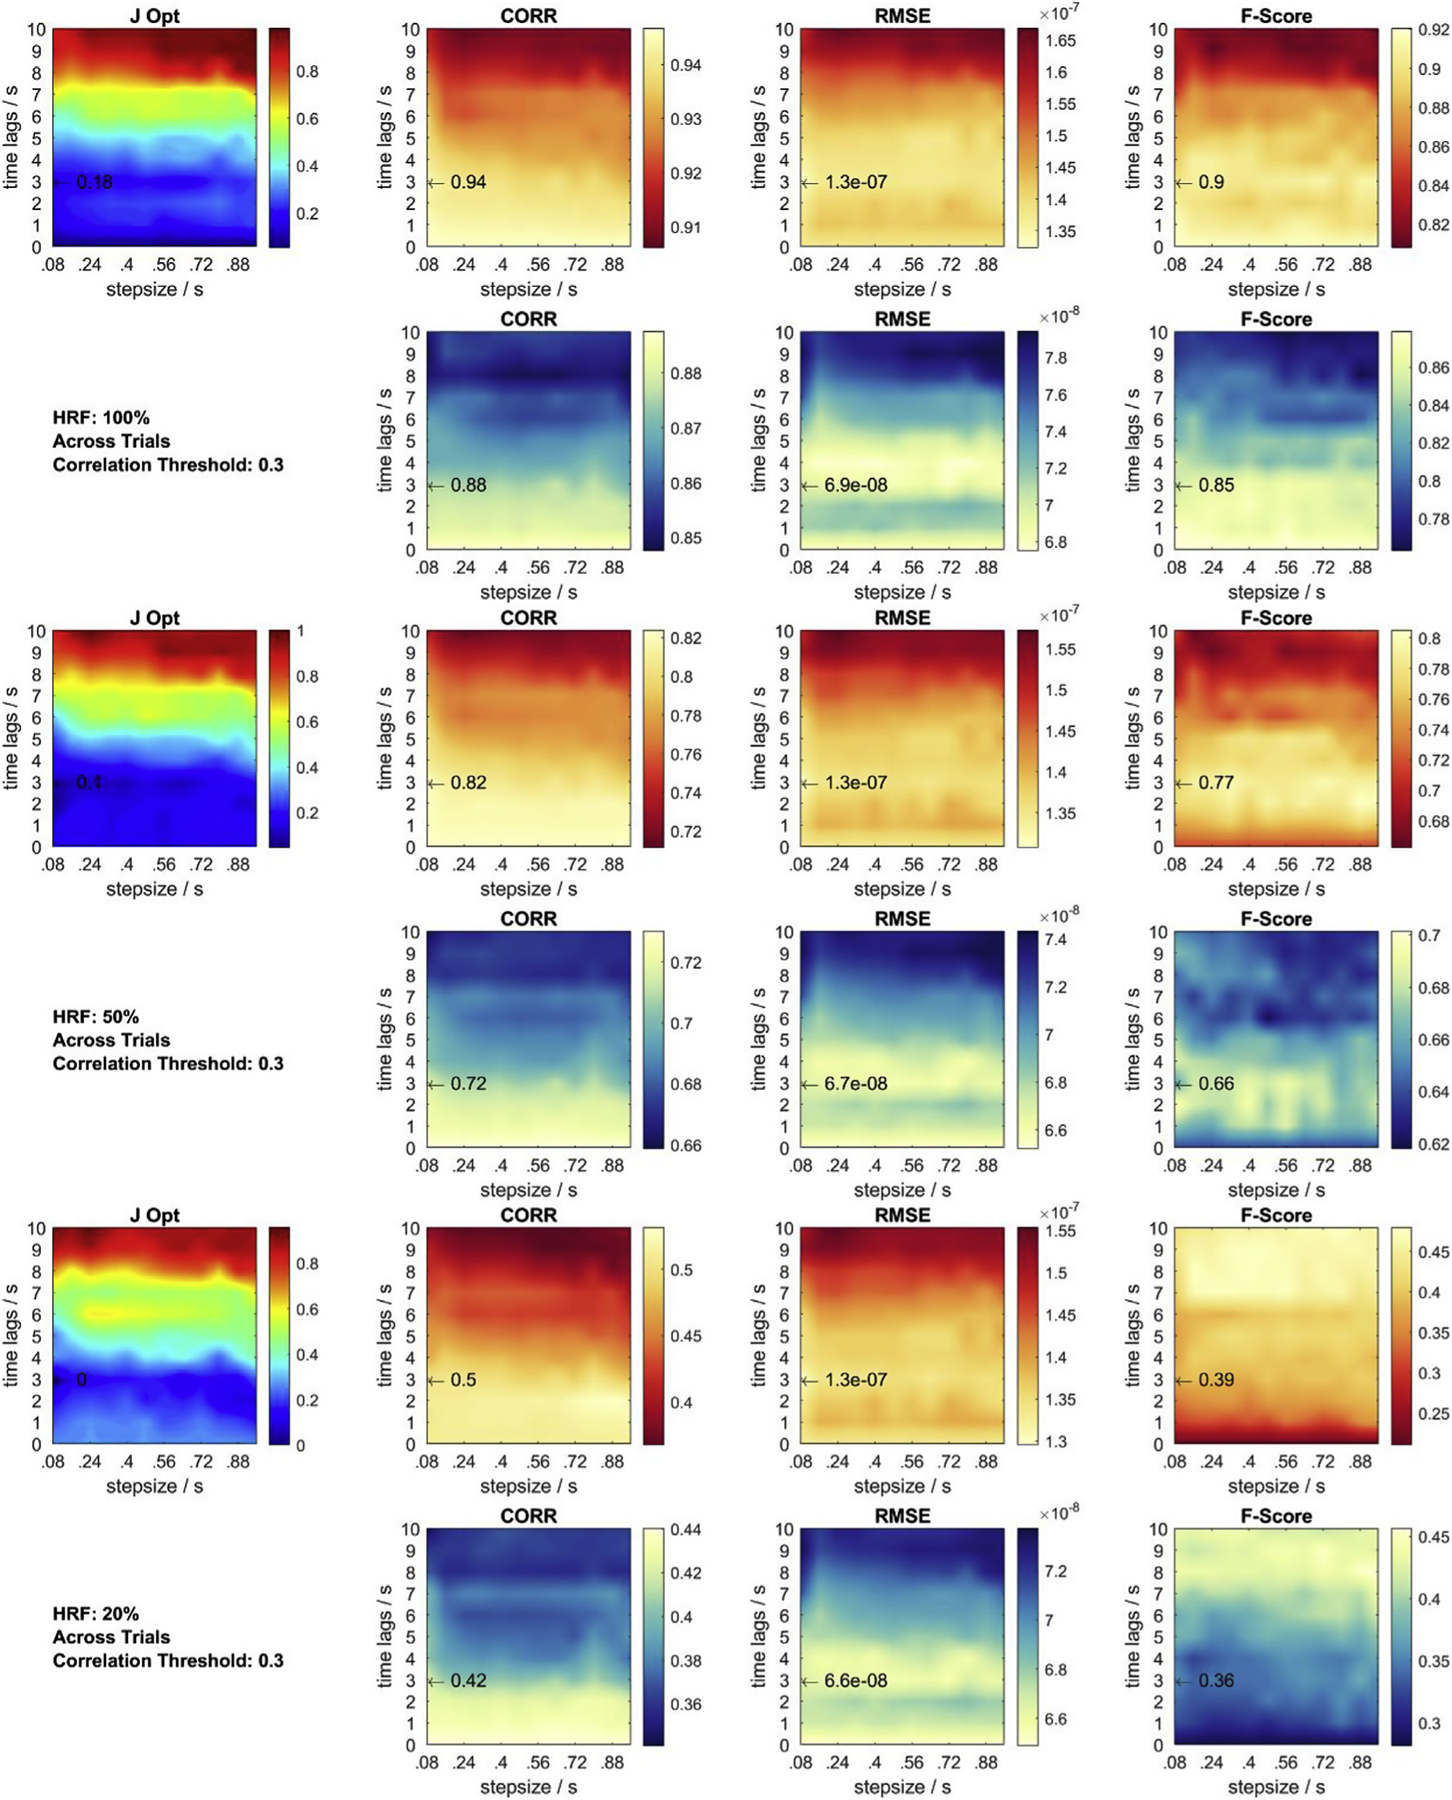
Metrics and objective function at correlation threshold 0.3 for across trial HRF = 20, 50, 100% recovery. Red contour plots: HbO. Blue contour plots: HbR. Black arrow: previously identified global optimum across all objective functions and conditions. J Opt displays the sum of each set of 6 normalized contour plots.