

Abstract
In Alzheimer’s disease (AD), amyloid deposits along the brain vasculature leading to a condition known as cerebral amyloid angiopathy (CAA), which impairs blood-brain barrier (BBB) function and accelerates cognitive degeneration. APOE4 is the strongest risk factor for CAA, yet the mechanisms underlying this genetic susceptibility are unknown. Here, we developed an iPSC-based 3D model that recapitulates anatomical and physiological properties of the human BBB in vitro. Similar to CAA, our in vitro BBB displayed significantly more amyloid accumulation in APOE4 compared to APOE3. Combinatorial experiments revealed that dysregulation of Calcineurin/NFAT-signaling and APOE in pericyte-like mural cells induces APOE4-associated CAA pathology. In the human brain, we identify APOE and NFAT are selectively dysregulated in pericytes of APOE4-carriers, and that inhibiting calcineurin/NFAT-signaling reduces APOE4-associated CAA pathology in vitro and in vivo. Our study reveals the role of pericytes in APOE4-mediated CAA and highlights calcineurin/NFAT-signaling as a therapeutic target in CAA and AD.
The BBB is critical for proper neuronal function, protecting the brain from pathogens and tightly regulating the composition of brain fluids. Neuronal health is directly coupled to the BBB’s ability to provide energy, clear waste, and provide protection from peripheral pathogens1-3. Therefore, cerebrovascular pathologies are strong predictors of cognitive decline in elderly4-6. The majority (> 90%) of Alzheimer’s disease (AD) patients have amyloid deposits along their cerebral vasculature, a pathological condition known as cerebral amyloid angiopathy (CAA)7. CAA impairs BBB function rendering individuals vulnerable to cerebral ischemia, microbleeds, and infections, which promote cognitive decline8,9.
APOE4 is the strongest genetic risk factor for CAA and sporadic AD7,10-12. However, since the underlying molecular and cellular mechanisms are unknown, no therapeutic or life-style interventions exist to offset APOE4 risk for neurodegeneration. The absence of tractable human BBB models presents a major challenge for elucidating how genetics, and life-style predispose cerebrovascular pathologies. To address these limitations and investigate the mechanisms underlying APOE4 predisposition to CAA, we sought to reconstruct the human BBB in vitro.
Reconstruction of Anatomical and Physiological Properties of the Human Blood-barrier in vitro
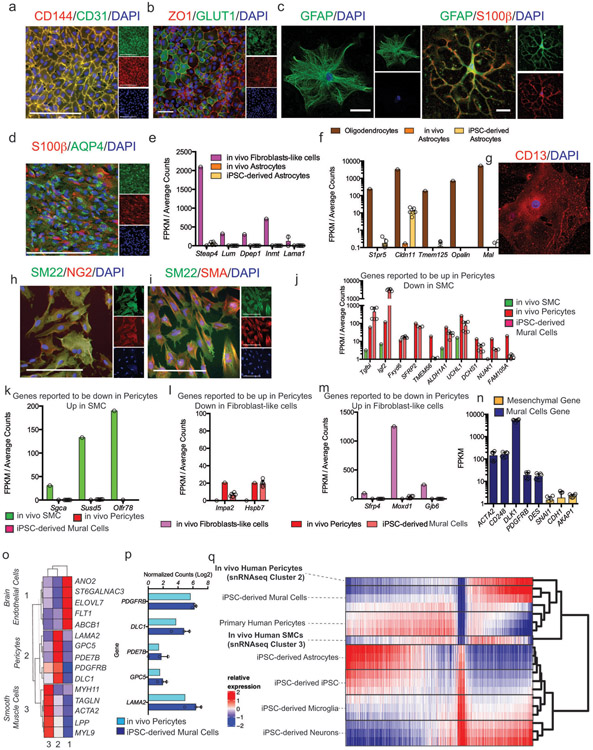
The human BBB is formed through the interactions of three cells types: brain endothelial cells (BECs), pericytes, and astrocytes13-16. We first optimized protocols for differentiating human induced pluripotent stem cells (iPSCs) into BECs, mural cells with pericyte-like properties, and astrocytes, with morphology and marker expression characteristic of each cell type (Fig. 1 a; Extended Data Fig. 1a-i) 17-20. Definitive identification of pericytes is challenging due to the lack of specific markers21,22. Therefore, to extensively characterize the identity of iPSC-derived mural cells (iMCs) we performed RNA-sequencing which revealed iMCs highly express genes up-regulated in pericytes relative to closely related smooth muscle cells (SMCs) and vascular fibroblasts (Extended Data Fig. 1j-m)23,24. Likewise, mesenchymal-associated genes (SNAI, CDH1, and AKAP1), were not detected in iMCs but instead robustly expressed genes associated with mural cells (ACTA2, CD248, DLK1, PDGFRB and DES) (Extended Data Fig. 1n). We next compared iMC’s gene expression to the global transcriptional profiles of in vivo human pericytes and SMC generated by single-nucleus RNA-sequencing (snRNAseq) of human hippocampi. Analysis of human hippocampal vascular cells identified three clusters (Extended Data Fig. 1o). Cluster 1 highly expressed endothelial marker genes (ANO2, ST6GALNAC3, ELOVL7, FLT1, and ABCB1). Cluster 2 highly expressed pericyte marker genes LAMA2, GPC5, PDE7B, PDGFRB, and DLC1, and low levels of SMC genes (MYH11, TAGLN, ACTA2, LPP, and MYL9) and therefore was termed “in vivo pericytes” (Extended Data Fig. 1o). Conversely, cluster 3 expressed low levels of pericytes marker genes, but high levels of SMC marker genes, and, therefore, was termed “in vivo SMCs”. iMCs expressed pericytes marker genes (Extended Data Fig. 1p). By unsupervised global hierarchical clustering iMCs exhibited more similarity to human in vivo pericytes than to in vivo SMCs (Extended Data Fig. 1o) While differences between iPSC-derived mural and in vivo pericytes likely exists, this data demonstrates iMCs lack markers for fibroblasts, mesenchymal cells and exhibit a high-degree of transcriptional similarity to in vivo pericytes.
Fig. 1. Reconstruction of Anatomical and Physiological Properties of the Human Blood-brain-barrier in vitro (iBBB).

a, Schematic of iBBB formation from iPSCs. b, iBBB stained for endothelial cell marker CD144 (red) Scale bar, 50 μm. c, iPSC-derived Mural Cells (iMural cells of iMCs) localize to endothelial vessels after two weeks in culture. Scale bar, 50 μm. d, iMural Cells are labeled with NG2 (green) and BECs with CD144 (red). e, Astrocytes surround endothelial vessels after two weeks in culture. Astrocytes are labeled in green with GFAP. BECs are labeled with CD144 in red. Scale bar, 50 μm. f, Aquaporin 4 (AQP4) green, is expressed on BEC vessels labeled with ZO-1, red, pan-astrocyte marker S100β is blue. Scale bar, 50 μm. Experiment in b-f were repeated at least 3 times each with similar results. g, qRT-PCR measuring the expression of common BBB-associated genes. All expression is normalized to pan-endothelial marker PECAM to account for potential differences in BEC cell number. Mean expression and SD of RNA harvested from 6 independent samples for each condition. Differences were analyzed by one-way ANOVA with Bonferroni’s post-hoc analysis CLDN5, p < 0.0001 for BECs v BA and iBBB; JAMA iBBB v: B+iMCs p < 0.0001, B+A, p = 0.0009, B only, p < 0.0001, B v B+A, p = 0.0013, B v B+iMCs, p = 0.0246; For PgP, iBBB v: B, p = 0.0079, B+A, p = 0.0001, B+iMCs, p 0.0019; LRP1, iBBB v: B, p < 0.0001, B+A, p < 0.0001, B+iMCs, p < 0.0001, B v B+A, p = 0.0029; RAGE iBBB v: B, p < 0.0001, B+A, p = 0.0357; GLUT1, iBBB v: B, p = 0.0026. h, qRT-PCR measuring the expression of transporters, adhesion molecules, and efflux-pumps, and tight-junctions found in the BBB. All expression levels are normalized to BECs alone. Y-axis is the expression level in BECs isolated from the iBBB normalized to BECs cultured alone. X-axis is BECs co-cultured with astrocytes normalized to BECs cultured alone. Blue circles represent means from three biological replicates and three PCR replicates. i, Cartoon depicting transwell setup for measuring iBBB permeability j, Representative image of BECs (ZO-1, red), iMural cells (SM22, blue) and astrocytes (S100β, green) co-cultured on transwell membrane. Transwell imaging experiments were repeated twice k, Trans-endothelial electrical resistance (TEER) measurements from HuVECs, HuVECs plus iMural Cells (MC) and astrocytes (A), BECs only, and the iBBB. Circles represent single measurements from individual transwells. Experiment consisted of six independent transwells for each condition (n = 6). Dots are the means from three readings from one transwell. Bar are means. Error bars are SD. Differences were analyzed by one-way ANOVA with Bonferroni’s post-hoc analysis. BECs only v iBBB, p = 0.0182; BECs and iBBB v HuVECs samples p < 0.0001. The TEER experiment was repeated three times with similar results l, Permeability of fluorescently labeled molecules for BECs alone or iBBB. All values are reported as a percent of each molecule’s permeability across a blank transwell membrane. Dots are the means from three permeability readings from one transwell. Bar are means. Stars represent significance determined by Two-sided multiple student’s t-test (FDR = 0.01). Cadaverine p = 4.14 e-008; 4 kDa Dextran p = 2.8 e-005; 10 kDa Dextran p = 3.39 e-006; Transferin p = 0.006; 70 kDa Dextran p = 0.0006. m, BBB properties of the iBBB require cooperative interaction of iMural cells and astrocytes. The permeability of 4 kDa dextran was quantified in the iBBB and compared to BECs with 2x iMural Cells, 2x astrocytes, or BECs with mouse embryonic fibroblasts (MEFs). Permeability is normalized to BECs alone. Each dot is the mean of three permeability readings from one transwell. N = 12 transwells per a condition. Center values are mean, error bars are SD. One-way ANOVA (p < 0.0001) with Bonferroni’s multiple comparisons. n, ABCG2 expression is up-regulated in the iBBB. One-way ANOVA with Bonferroni’s post-hoc analysis (p < 0.0001). n = 6 biological replicates, each dot is the PCR mean from one biological replicate. Center value is the mean of biological replicatres. Error bars are SD. o, Polarization of Pgp was measured by rhodamine 123 transport for both a BECs monolayer and the iBBB from the apical to basolateral surface and vice versa. Inhibitor-treated samples were normalized to each respective non-inhibitor-treated sample. Each dot is the mean of three permeability readings from one transwell. N = 6 transwells per a condition. Center values are mean, error bars are SD. Stars represent significance determined by two-sided multiple student’s t-tests (p = 0.015) (FDR = 0.01).
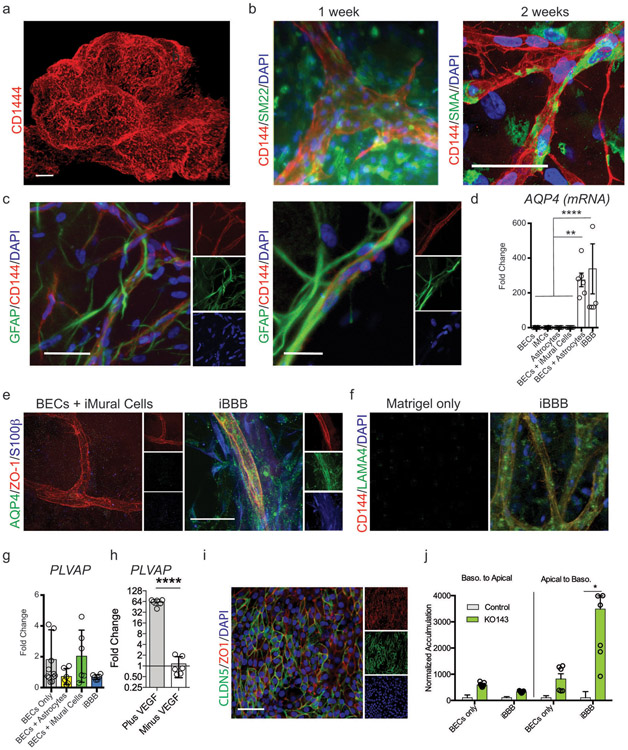
BECs, iMCs, and astrocytes were subsequently encapsulated in Matrigel providing a 3D extracellular matrix for self-assembly. To promote the establishment of each cell type in 3D culture, the Matrigel was supplemented with 10% fetal bovine serum and growth factors (10 ng/ml PDGF-BB and 10 ng/ml VEGFA). After two weeks, BECs assembled into large (> 5 mm2) networks of interconnected CD144-positive cells resembling capillaries (Fig. 1b; Extended Data Fig. 2a; Supplemental Video 1). In vivo endothelial cells secrete PDGF-BB recruiting mural cells to the perivascular space14. Initially, iMCs were evenly dispersed throughout the Matrigel (Extended Data Fig. 2b). However, after two-weeks, iMCs reorganized to occupy positions proximal to the BEC vessels. SM22-positive and NG2-positive cells lined large and small endothelial vessels reflective of mural cell in vivo coverage (Fig. 1c and d; Extended Data Fig. 2b; Supplemental Video 2). Numerous astrocytes surrounded each vessel and extended GFAP-positive projections into the perivascular space (Fig. 1e, Extended Data Fig. 2c). In vivo astrocytic “end-feet” project onto capillaries where transport molecules such as aquaporin 4 (AQP4) are localized14,25. In Astrocytes-only cultures AQP4 mRNA or protein was not detected by qRT-PCR or immunocytochemistry (Extended Data Fig. 2d and e). In contrast, our iPSC-derived BBB (iBBB) robustly expressed AQP4 mRNA and endothelial vessels were lined with S100β and GFAP-positive astrocytes expressing AQP4 (Fig. 1f; Extended Data Fig 2d and e; Supplemental video 3). The BBB is surrounded by a basement membrane rich in laminin α4 (LAMA4)26. LAMA4 is not naturally present in Matrigel (Extended Data Fig. 2f). However, after 1 month in culture, LAMA4-immunoreactive areas surrounded endothelial vessels of the iBBB (Extended Data Fig. 2f) suggesting that iBBB cultures remodel the extracellular matrix to acquire basement membrane proteins found in the in vivo BBB.
We performed transcriptional profiling by qRT-PCR of BECs cultured alone, with astrocytes or iMCs, and the iBBB that included astrocytes and iMCs. Expression of BBB-associated genes CLDN5, JAMA, PgP, LRP1, RAGE, and GLUT1 were significantly higher in BECs from the iBBB than BECs cultured alone or co-cultured with astrocytes and iMCs except for CLDN5 which was up-regulated to similar levels as the iBBB when astrocytes were co-cultured with BECs (Fig. 1g)27,28. Numerous genes highly expressed in the BBB including PECAM, ABCG2, CDH5, CGN, SLC38A5, ABCC2, VWF, and SLC7A5, were up-regulated in the iBBB model compared to BECs alone or co-cultured with astrocytes (Fig. 1h)29. PLVAP, a marker of angiogenic endothelium induced by VEGFA was upregulated in iBBB cultures30. PLVAP expression was not influenced by the presence of iMCs or astrocytes but was significantly decreased upon removal of VEGFA from culture media (Extended Data Fig. 2g and h) suggesting that BECs in the iBBB can respond to soluble cues such as VEGFA. To minimize the effects of VEGFA and angiogenesis we subsequently cultured the iBBB in VEGFA containing media only for the first two weeks of iBBB formation.
To examine physiological properties of the iBBB, we established a trans-well system consisting of a confluent monolayer of BECs on a permeable membrane with iMCs and astrocytes layered on top (Fig. 1i and j; Extended Data Fig 2i)16. Trans-endothelial electrical resistance (TEER) is a sensitive and reliable indicator of permeability31. Peripheral endothelial cells such as human umbilical cord vascular endothelial cells (HuVECs) have relatively high permeability and thus exhibit low TEER (> 150 Ohms/cm2)32. Consistent with this, HuVECs in our trans-well configuration exhibited TEERs of approximately 100 Ohms/cm2 that did not significantly change when co-cultured with astrocyte and iMCs (Fig. 1k). iPSC-derived BECs cultured alone had significantly higher TEERs with an average of 5900 Ohms/cm2 (Fig. 1k)17. However, TEERs for BECs cultured alone exhibited a high degree of variability (SD = +/− 2150 Ohms). Co-culturing BECs with iMCs and astrocytes reduced TEER variability (SD = +/− 513.9 Ohms) and led to a significant increase in the average resistance (8030 Ohms cm2) (Fig. 1k).
We next compared the paracellular permeability of molecules across the iBBB. Molecules between 0.1 to 10 kDa, exhibited an approximately 50% reduction in paracellular permeability of the iBBB compared to BECs alone (Fig. 1l). Higher molecular weight molecules (70 and 80 kDa) crossed the iBBB less efficiently compared to BEC-only with 70 and 90% reductions (Fig. 1l). To exclude the possibility that reduced iBBB permeability resulted from additional layers of cells, we added on top of BECs double the normal number of iMCs-only, astrocytes-only or a non-relevant cell type, mouse embryonic fibroblasts (MEFs). Neither astrocytes, iMCs nor MEFs cultured alone with BECs reduced permeability whereas the co-culture of both astrocytes and iMCs significantly reduced permeability (Fig. 1m). This demonstrates that the reduced iBBB permeability is not simply an effect of physically layering additional cells and requires both astrocytes and MCs.
BBB endothelial cells selectively express efflux pumps on their apical surface, an important mechanism preventing entry of many molecules into the brain33. We identified two common efflux pumps p-glycoprotein (PGP) and ABCG2 are up-regulated in the iBBB compared to BECs alone (Fig. 1g and n). To examine PGP polarization in the iBBB, we measured the efflux of rhodamine 123 in the presence and absence of the PGP-specific inhibitor reversine 121, from the apical to the basolateral surface and vice versa. Inhibition of PGP dramatically increased the permeability of rhodamine 123 from the apical to basolateral side, but not the reverse suggesting that PGP is largely localized to the apical membrane of the iBBB (Fig. 1o)17. Likewise, inhibition of ABCG2 with the specific ABCG2 inhibitor KO143 also robustly increased the apical-to-basolateral transport of Hoechst 33258, an ABCG2 substrate (Extended Data Fig. 2j). This demonstrates that the iBBB has high TEER, reduced molecular permeability, and polarization of efflux pumps, key functional properties of the BBB in vivo.
APOE4 increases Aβ accumulation in the iBBB
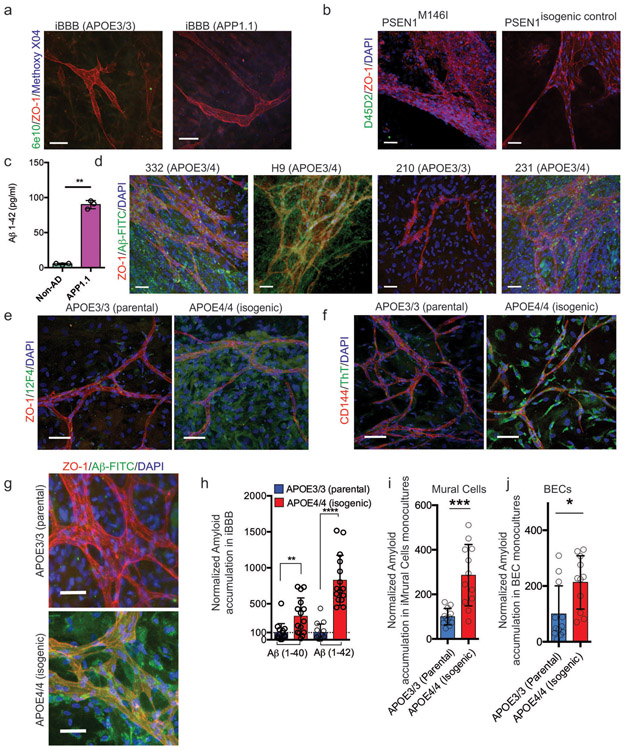
We next examined whether the iBBB can model AD vascular pathologies such as CAA. In vivo, the BBB is not a significant source of amyloid. Consistent with this, we detected minimal amyloid in iBBBs derived from familial AD (fAD) patients with duplication of the APP gene and a separate isogenic pair with a PSEN1M146I mutation and its corrected “non-AD” control (Extended Data Fig. 3a and b). In contrast, neurons are the most significant source of amyloid in the human brain34. Therefore, we utilized Aβ-rich conditioned media from control and fAD neuronal cultures generated from an APP duplication iPSC line35,36.37. iBBBs exposed to non-AD conditioned media exhibited minimal amyloid accumulation (Fig. 2b; Fig. 2a; Extended Data Fig. 3c). In contrast, iBBBs exposed to fAD conditioned media had significant amyloid accumulation, suggesting that the iBBB can model vascular amyloid deposition observed in vivo (Fig. 2b).
Fig. 2. APOE4 increases amyloid accumulation in the iBBB.
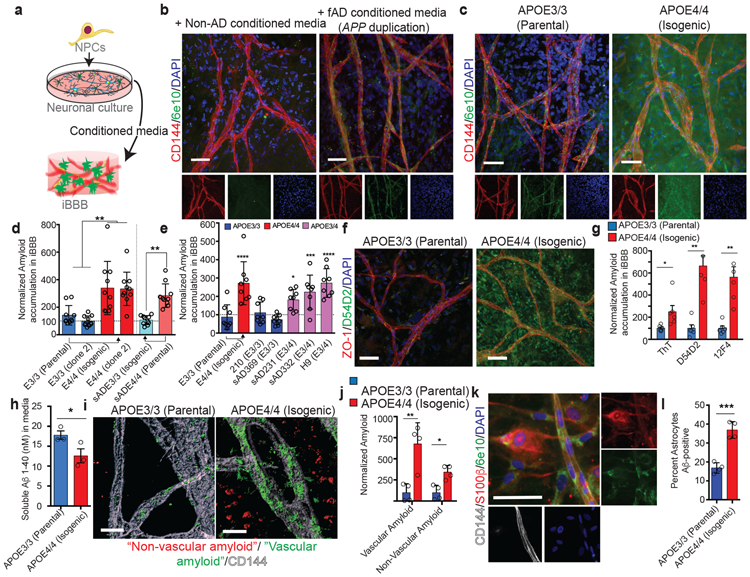
a, Cartoon depicting the experimental paradigm for exposing iBBBs to exogenous amyloid-β. b, Amyloid selectively accumulates on non-AD iBBBs exposed to media conditioned by iPSC-derived neuronal cells from a familial AD patient with an APP-duplication (APP1.1). iBBB derived from APOE3/3 iPSC line (E3/3 parental) from a healthy 75-year-old female. 6e10 antibody, green, recognizes Aβ1-16 epitope. Scale bar, 50 μm. Experiment was repeated at least 3 times with similar results. c, The APOE3/3 parental iPSC line was genetically edited to an isogenic APOE4/4 allowing the generation of genetically identical iBBBs. Isogenic APOE4/4 iBBBs accumulated more amyloid compared to the parental APOE3/3 iBBB when simultaneously exposed to APP1.1 conditioned media for 96 hours. Scale bar, 50 μm. Experiment was repeated at least 3 times with similar results. d, Representative quantification of amyloid accumulation in two isogenic iBBBs with reciprocal genetic editing strategies. Arrows indicate direction of genetic editing where the right-facing arrow indicates editing from APOE3/3 to APOE4/4 and the left-facing arrow indicates editing from APOE4/4 to APOE3/3. Total area positive for amyloid was divided by total nuclei and then normalized to the mean amyloid/nuclei from all E3/3 samples such that the mean of E3/E3 is set to 100%. Blind automated image analysis was performed with ImageJ. Two-sided Student t-test (p = 0.0114). For each condition 12 iBBBs were quantified for each condition. Dots represent mean amyloid across 4 images for each iBBB. Center values are means and error bars are SD. e, APOE3/4 heterozygous iBBBs accumulate significantly more amyloid than APOE3/3 iBBBs. Quantification performed as described in d. For each condition 9 iBBBs were quantified for each condition. Dots represent mean amyloid across 4 images for each iBBB. Center values are means and error bars are SD. ANOVA with Bonferroni’s multiple comparison test (p < 0.0001). (E3/3 v E4/4, p < 0.0001; E3/3 v sAD231, p = 0.0055; E3/3 v sAD332, p = 0.0002; E3/3 v. H9, p < 0.0001) f, Representative images depicting that iBBBs derived from isogenic APOE3/3 and APOE4/4 individuals exhibit high levels of amyloid accumulation assay with anti-amyloid antibody D54D2. Experiment was repeated at least 3 times with similar results. g, Quantification of amyloid in isogenic iBBBs for Thioflavin T (p = 0.0258), and two different amyloid antibodies D54D2 (p =0.0020) and 12F4 (p = 0.0054). Two-sided student t test. Each dot represents the mean of 3 images from one iBBB, 6 iBBBs were analyzed for this experiment. Bars center values represent mean and error bars represent SD. Experiment was repeated 2 times with similar results. h, Quantification of soluble versus in soluble Aβ 1-40 in remaining in the iBBB culture media 96 hours after inoculation with 20 nM Aβ 1-40 (p = 0.0319). Two-sided student t test. Each dot represents the mean of 3 images from one iBBB, 6 iBBBs were analyzed for this experiment. Bars center values represent mean and error bars represent SD. Experiment was repeated 2 times with similar results. i, Representative three-dimensional IMARIS renderings depicting vascular amyloid accumulation in APOE3/3 and APOE4/4 iBBBs. iBBBs were allowed to mature for 1 month and then simultaneously exposed to neuronal conditioned media from the fAD APP1.1 line. Three-dimensional surfaces of 6e10 and VE-Cadherin staining were created using IMARIS software. The total area of 6e10 within 20 μm of the VE-Cadherin surfaces was measured. This was normalized to the total area of the Vecad surfaces Scale bar, 10 μm. Experiment was repeated 2 times with similar results. j, Quantification of vascular (< 20 μm from BEC vessel) (p = 0.0055) and non-vascular (> 20 μm from BEC vessel) (p= 0.0062) using IMARIS software. Amyloid area was normalized to total vascular area for each image. Each dot represents the mean of 3 images from one iBBB, 4 iBBBs were analyzed for this experiment. Bars center values represent mean and error bars represent SD. k, Representative image depicting amyloid accumulation in non-vascular cells positive for astrocyte marker S100β. Scale bar 50 μm. Experiment was repeated 2 times with similar results. l, Quantification showing the number of astrocytes positive for amyloid for each isogenic genotype. (p= 0.0003) two-sided student t-test. Each dot represents the mean of 4 images from one iBBB, 4 iBBBs were analyzed for this experiment. Bars center values represent mean and error bars represent SD.
To examine whether iBBB amyloid accumulation is influenced by APOE genotype, we generated iBBBs from isogenic APOE3/3 and APOE4/4 iPSCs, previously reported38. Isogenic APOE4/4 iBBBs exposed to fAD conditioned media consistently exhibited significantly more 6e10-immunoreactive amyloid accumulation compared to APOE3/3 iBBBs (Fig. 2c Supplemental Video 4). Using the reciprocal genetic editing strategy (APOE4/4-risk edited to APOE3/3-non-risk), we again observed more amyloid accumulation in the APOE4/4 iBBB (Fig. 2d). Unedited E3/4 heterozygous iBBBs also exhibit increased amyloid deposition compared to APOE3/3 iBBBs (Fig 2e; Extended Data Fig. 3d) suggesting that increased amyloid deposition in the APOE4/4 iBBBs is unlikely the result of clonal variation or genetic editing.
We quantified iBBB amyloid accumulation with four additional methods. Using two different antibodies D54D2 (detects Aβ1-37, Aβ1-38, Aβ1-39, Aβ1-40 and Aβ1-42), and 12F4 (detects Aβ1-42 oligomers), we again observed that amyloid accumulation is elevated in the APOE4/4 iBBBs compared to the APOE3/3 (Fig. 2f and g and Extended Data Fig. 3e). Likewise, APOE4/4 iBBBs exposed to neuronal fAD conditioned media exhibited significantly higher Thioflavin T (ThT) staining that binds fibril amyloid (Fig. 2g; Extended Data Fig. 3f). Similarly, exposing iBBBs to fluorescently labeled Aβ peptides (20 nM 1-40/1-42) for 96 hours led to higher levels of amyloid accumulation in APOE4/4 iBBBs suggesting that the phenotype is not dependent upon secondary factors in the conditioned media (Extended Data Fig. 3g and h). Amyloid accumulation in the APOE4/4 iBBB corresponded with a reduction of soluble monomeric Aβ in the APOE4/4 iBBB culture media compared to APOE3/3, further suggesting that APOE4 iBBBs accumulate more amyloid than APOE3 iBBBs (Fig. 2h).
To determine the spatial distribution of amyloid, we quantified 6e10-immunoreactive “vascular amyloid” less than 20 μm from the center of VE-Cadherin-positive vessels and “non-vascular amyloid” greater than 20 μm from the center of a vessel (Fig. 2i). Interestingly, non-vascular amyloid was also increased in the parenchymal space surrounding each vessel in APOE4/4 iBBB (Fig. 2j). Non-vascular amyloid appeared cellular surrounding cells expressing astrocytic markers GFAP and S100β with 36.8% of APOE4 astrocytes containing amyloid compared to 16.8% of APOE3/3 astrocytes (Fig. 2k and l). In agreement, both APOE4/4 pericytes and BECs 2D-monocultures accumulated more fluorescently labeled Aβ than their APOE3/3 counterparts (Extended Data Fig. 3i and j).
Mural cells are required for increased Aβ deposition in the iBBB
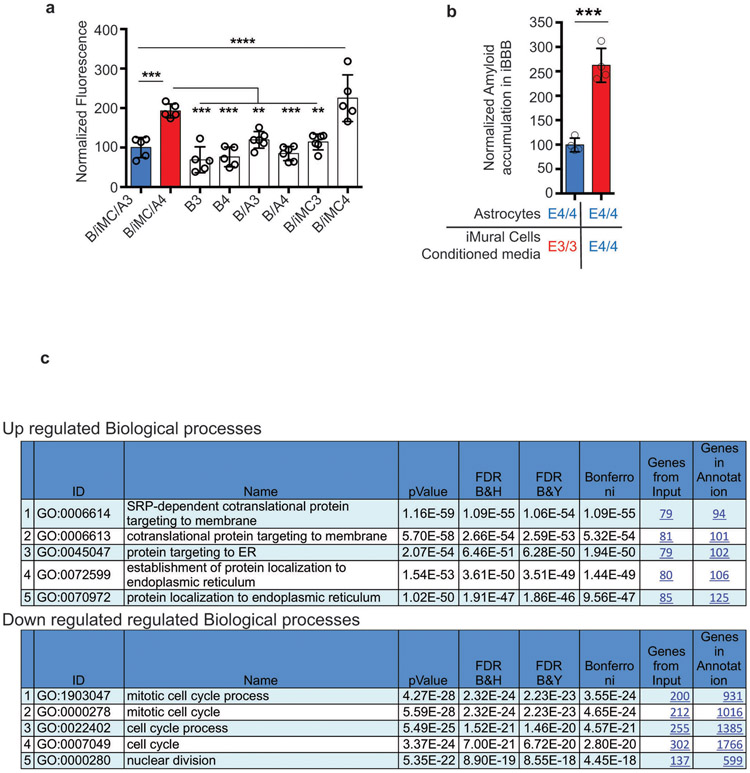
To further determine the cellular origins of APOE4-mediated amyloid accumulation we performed a combinatorial screen consisting of the eight possible permutations of iBBBs from APOE3/3 and APOE4/4 isogenic iPSCs. iBBBs first matured for 1 month and then were exposed to FITC-labeled Aβ (96 hours). We first categorized each of the iBBB permutation based on whether it exhibited low amyloid similar (p < 0.05) to the all APOE3/3 iBBB or high amyloid similar to the all APOE4/4 iBBB (Fig. 3a-c). Both the low and high amyloid conditions equally contained astrocytes and BECs from both APOE3/3 and APOE4/4 genotypes (Fig. 3c). However, strikingly, all the low amyloid conditions contained only APOE3/3 iMCs whereas all high amyloid iBBBs contained only APOE4/4 iMCs (Fig. 3b-c). This strongly suggests that E4/4 iMCs are necessary for the increased amyloid phenotype observed in APOE4 iBBBs. Replacing only APOE4/4 iMCs with iMCs derived from a different APOE3/3 individual resulted in a significant reduction in iBBB amyloid deposition regardless of the BEC or astrocyte genotype (Fig. 3d). Substituting APOE3/3 astrocytes or BECs with APOE3/4 astrocytes or BECs did not significantly increase iBBB amyloid accumulation (Fig. 3d). However, as observed with APOE4/4 homozygous iMCs, replacing APOE3/3 iMCs with heterozygous APOE3/4 iMCs increased iBBB amyloid accumulation to a similar level as observed in the all APOE3/4 iBBB (Fig. 3d). To further confirm that APOE4 iMCs are sufficient, we deconstructed the iBBB into BECs-alone, BECs with iMCs, or BECs with astrocytes from each genotype. Only APOE4/4 BECs with iMCs led to a significant increase in amyloid accumulation further suggesting APOE4 iMCs have a casual role in iBBB amyloid accumulation (Extended Data Fig. 4a). Similarly, we exposed APOE3/3 iBBBs to media conditioned by either APOE3/3 or APOE4/4 iMCs and then added 20 nM Aβ-FITC to all conditions. This revealed that APOE4/4 MC conditioned media is sufficient to increase amyloid accumulation of the APOE3/3 iBBB (Fig. 3e). Treating APOE4 astrocytes with APOE4 iMC conditioned media also significantly increased astrocytic amyloid accumulation (Extended Data Fig. 4b).
Fig. 3. Mural Cells are required for increased amyloid accumulation in the iBBB.
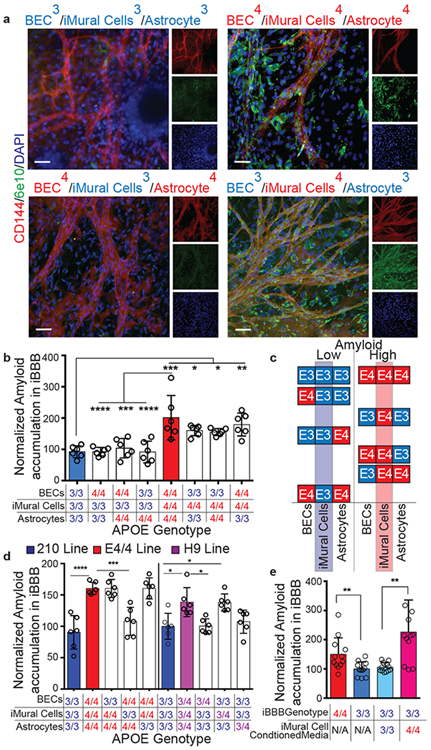
a, Representative images depicting combinatorial screen of APOE3/3 and APOE4/4 isogenic cell-types reveals that APOE4 expression in iMural cells is required for increased iBBB amyloid accumulation. These experiments were repeated 3 times. b, Quantification of amyloid accumulation in isogenic iBBBs for each permutation of combinatorial matrix. Each dot represents mean amyloid of four images. 6 iBBBs were analyzed for each condition. Center values represent mean and error bars are SD. Analysis was performed by one-way ANOVA with Bonferroni’s multiple comparison test where BECs/iMCs/Astrocytes: 3/3/3 v 4/4/4, p < 0.0001; 4/4/4 v 4/3/3, p < 0.0001; 4/4/4 v 4/3/4 p = 0.0004, 4/4/4 v 3/3/4 p < 0.0001; 3/3/3 v 3/4/3, p = 0.0391; 3/3/3 v 3/4/4, p = 0.050; 3/3/3 v 4/4/3 p = 0.0023. c, Segregating each isogenic permutation based on relative amyloid levels (low or high), reveals that APOE3/3 and APOE4/4 BECs and astrocytes are equally represented between the two conditions, however, iMural cells are not. For the low amyloid condition only APOE3/3 iMural cells are present. In contrast, for the high amyloid condition, only APOE4/4 iMural cells are present. d, Quantification of Aβ accumulation in iBBBs derived from APO3/3 (3), H9 is APOE3/4 heterozygous and 210 is APOE3/3 homozygous. Each dot represents mean amyloid of four images. 6 iBBBs were analyzed for each condition. Center values represent mean and error bars are SD. Analysis was performed by one-way ANOVA with Bonferroni’s multiple comparison test where BECs/iMCs/Astrocytes: 3/3/3 v 4/4/4 p < 0.0001; 4/4/4 v 4/3/4 p = 0.0004; 3/3/3 v H9/H9/H9 p = 0.0018; 3/3/3 v 3/H9/3, p = 0.002. e, Quantification of Aβ accumulation in isogenic iBBBs and APOE3/3 iBBBs treated with iMural cell conditioned media from either APOE3/3 (parental) or APOE4/4 (isogenic) iMural cell. Media was conditioned for 48 hours and added iBBBs with 1:1 ratio of fresh media and 20 nM Aβ-FITC for 96 hours. Each dot represents mean amyloid of 3 images. 12 iBBBs were analyzed for each condition. Center values represent mean and error bars are SD. Analysis was performed by two-sided student t-test where iBBB genotype/iMC conditioned media: 4/NA v 3/NA, p = 0.0095; 3/3 v 3/4, p = 0.001.
APOE and Calcineurin signaling are up-regulated in APOE4 pericytes
RNA-sequencing revealed that 4,286 genes are differentially expressed (DEGs; q < 0.05) between isogenic pericytes with 2,303 genes significantly up-regulated and 1,983 genes down-regulated in APOE4/4 pericytes (Fig. 4a). Gene ontology (GO) analysis suggested that the biological processes involved in protein targeting to the membrane and endoplasmic reticulum are up-regulated in APOE4 pericytes whereas mitosis and cell cycle progression are down-regulated (Extended Data Fig. 4c). Similar to in vivo,39 iMCs highly express APOE based on relative comparison of astrocyte and pericyte APOE FPKM values from RNA-sequencing (Extended Data Fig. 5a-c). APOE4 iMCs exhibited robust up-regulation of APOE whereas genetically identical APOE4/4 astrocytes exhibited the reverse expression profile with reduced level of APOE compared to APOE3/3 (Extended Data Fig. 5d). We confirmed differential up-regulation and down-regulation of APOE in iMCs and astrocytes respectively via qRT-PCR of RNA harvested from samples independent from the RNA-seq samples (Fig. 4b). APOE protein was also elevated in APOE4 iMCs (Fig. 4c and d). APOE gene expression was also up-regulated in APOE4/4 iMCs from our reciprocal isogenic pair and multiple APOE3/4 non-edited heterozygous lines suggesting the effect is unlikely due to genetic editing or clonal variation (Fig. 4e).
Fig. 4. APOE and NFAT/Calcineurin-signaling are up-regulated in APOE4 mural cells with pericyte-like properties in vitro and selectively in pericytes in the human brain.
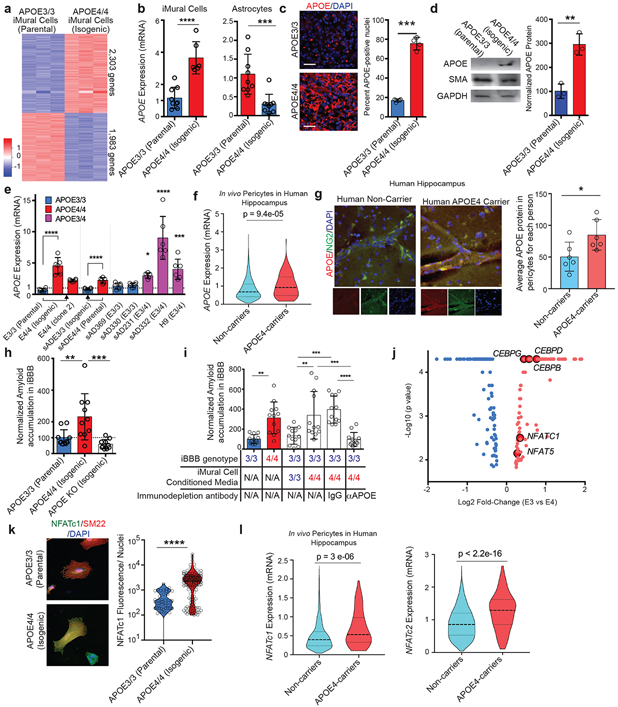
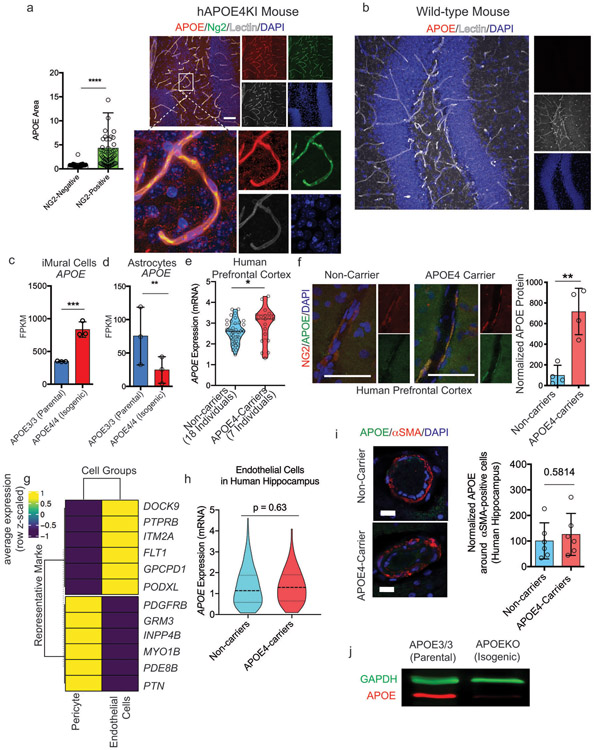
a, Heat map depicting differentially expressed genes between isogenic APOE3/3 and APOE4/4 iPSC-derived iMural cells. (q = 0.01) RNA and sequencing was performed on three independent wells for each isogenic cell line b, APOE gene expression is significantly up-regulated in APOE4/4 iMural cells whereas it is down-regulated in APOE4/4 astrocytes. Expression values from qRT-PCR than used for RNAseq experiment center value are means. two-sided student t-test Astrocyte (p = 0.0009), iMural Cells (p < 0.0001) (n = 9). c, Immunofluorescence staining and quantification of APOE in isogenic iMural cells. Scale bar, 50 μm. Dots are mean APOE fluorescence intensity from four independent images from a single well. Four wells were measured for each genotype. Unpaired Two-tailed t test (p = 0.0005). center values are means. d, Western blot and quantification for APOE protein in APOE isogenic iMural cells. Two constitutively expressed proteins in iMural cells are included smooth muscle actin (SMA) and GAPDH. Dots are band intensity from three independent lysates. Center values are means and error bars are SD. Unpaired Two-tailed t test (p = 0.0033) e, qRT-PCR showing APOE gene expression is also up-regulated in an additional isogenic pair that was edited from E4/4 to E3/3 and three APOE3/4 heterozygous iMural cells from iPSC lines derived from individuals with sporadic AD and H9 hESC line. Arrows indicated the direction of genetic editing. All values are normalized to the mean expression in all APOE3/3 (n = 4) iMural cells. Center values are mean and error bars are SD. Significance determined by One-way ANOVA (p < 0.0001) with Bonferroni’s multiple comparison test to APOE3/3 iMural cells E3/3 v E4/4, p = 0.0002; E3/3 v sAD231, p = 0.0315; E3/3 v sAD332, p <0.0001; E3/3 v H9, p =0.0005. f, Violin plots depicting APOE expression in pericytes isolated from post-mortem hippocampus of APOE4 carriers (n = 16 individuals) Non-carriers (n = 46 individuals) Dashed line is mean. Differential expression was measured using a two-tailed Wilcoxon rank sum test, considering cells with detected expression of APOE. g, Representative images and quantification depicting the expression of APOE protein in hippocampal NG2-positive pericytes in post-mortem brains from APOE4-carriers (n= 6) and non-carriers (n = 6). For each genotype more than 250 NG2-positive pericytes were identified. Center values are means and error bars are SD. Two-sided Unpaired t test, p = 0.0068. h, Isogenic iBBBs that are deficient for APOE by genetically knocking-out (KO) display similar amyloid accumulation to E3/3 iBBBs. (n = 9) Center values are mean and error bars are SD. Significance displayed as One-way ANOVA (p < 0.0001) with Bonferroni’s multiple comparison test. ** = 0.0091; *** = 0.0006. i, Immunodepleting APOE from APOE4 iMural cells conditioned media significantly reduces amyloid accumulation in the APOE3 iBBB. (n = 12) Center values are mean and error bars are SD. One-way ANOVA (p < 0.0001) with Bonferroni’s multiple comparison test where iBBB genotype/ iMC conditioned media/ immunodepletion antibody: 3/NA/NA v 4/NA/NA, p = 0.0051; 3/3/NA v 3/4/NA, p 0.0011; 3/3/NA v 3/4/IgG, p 0.0002; 3/4/NA v 3/4/αAPOE, p 0.0001; 3/4/IgG v 3/4/αAPOE, p < 0.0001. j, Transcription factors differentially expressed between APOE3/3 and E4/4 isogenic pairs (q < 0.05). Blue denotes down-regulated transcription factors and red dots denote up-regulated transcription factors. The five transcription factors highlighted are reported to bind APOE gene regulatory elements. Analysis and samples the same as described in 4a. k, APOE isogenic iMural cells stained for NFATc1 (green) and SM22 (red). NFATc1 is present in both cytoplasm and nucleus. Dephosphorylation of NFAT by calcineurin leads to NFAT translocation to the nucleus. Quantification of NFATc1 staining per nuclei for each APOE3/3 and APOE4/4. 150 cells were analyzed for each genotype. Significance determined by two-sided students t-test, (p < 0.0001). l, Violin plots depicting NFATC1 and NFATC2 expression in endothelial cells isolated from post-mortem hippocampus of APOE4-carriers (n = 16 individuals) and non-carriers (n = 46 individuals) Differential expression was measured using a two-tailed Wilcoxon rank sum test p = 3 e-06. Dashed line is mean.
Next, we examined APOE expression in human brain vasculature by further analyzing our recently published single cell transcriptomic study of the BA10 region of human prefrontal cortex (PFC) using single-nucleus RNA-seq40. Consistent with our in vitro studies, PFC pericytes/endothelial cell cluster from APOE4-carriers (n = 7 individuals) exhibited significantly higher APOE mRNA expression compared to non-carriers (n = 18 individuals) (Extended Data Fig. 5e). APOE protein in PFC sections was also significantly higher in NG2-positive pericytes from APOE4-carriers compared to non-carriers (Extended Data Fig. 5f). We next analyzed snRNA-seq data from the hippocampus of APOE4-carriers (n = 16 individuals) and non-carriers (n = 46 individuals). A larger number of cells in the hippocampus dataset enabled a clear separation of endothelial cells and pericytes based on marker gene expression (Extended Data Fig. 5g). Similar to the PFC, APOE expression in hippocampal pericytes from APOE4-carriers was significantly higher compared to non-carriers (Fig. 4f) whereas in endothelial cells there was no difference (Extended Data Fig. 5h). APOE4-carriers also exhibited higher APOE protein in NG2-positive pericytes compared to non-carriers by immunohistochemistry (Fig. 4g). In contrast, APOE protein in α-SMA-positive SMCs in the human hippocampus did not significantly differ between APOE4-carriers and non-carriers suggesting that differential upregulation of APOE in APOE4-carriers in vivo may be restricted to pericytes (Extended Data Fig. 5i). These results suggest that in vivo APOE4 human brain pericytes express higher APOE than non-carriers across multiple brain regions.
Mouse studies demonstrated that APOE is required for CAA pathologies41 and haploinsufficiency of either APOE3 or APOE4 reduces cerebral amyloid accumulation42. Therefore, the increased expression of APOE in APOE4 iMCs in the iBBB and pericytes in vivo could promote increased amyloid accumulation. To explore this scenario, we generated isogenic APOE-truncation iPSC lines that is deficient for APOE protein (APOEKO) using CRISPR/Cas9 editing (Extended Data Fig. 5j). APOE-deficient iBBBs exhibited low amyloid similar to the APOE3/3 iBBBs (Fig. 4h). To test whether APOE is responsible for increased amyloid accumulation, we immunodepleted APOE from iMC conditioned media and then exposed the APOE3 iBBBs to Aβ. Immuno-depletion of APOE from the APOE4/4 iMC conditioned media significantly reduced the accumulation of amyloid (Fig. 4i). Similarly, increasing APOE to concentrations observed in APOE4 iBBB (200 ng/ml) with recombinant APOE protein was sufficient to increase amyloid accumulation in APOE3/3 iBBB regardless of isoform (Extended Data Fig. 6a). This demonstrates that APOE protein abundance influences amyloid accumulation suggesting that reducing APOE protein in APOE4 iMC could reduce amyloid accumulation.
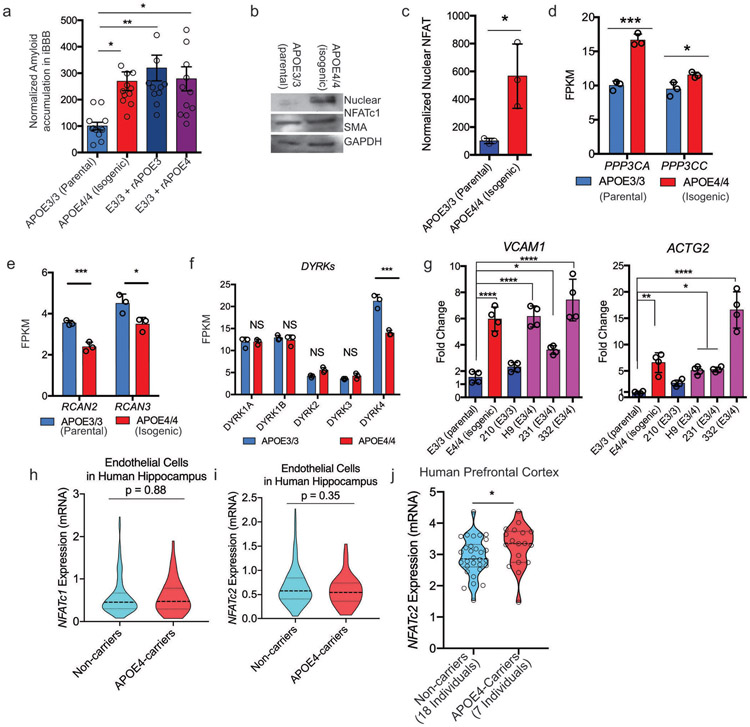
Reasoning that upregulation of APOE is transcription factor mediated, we identified transcription factors differentially expressed between isogenic APOE3/3 and APOE4/4 iMCs. In APOE4/4 iMCs 127 transcription factors were differentially up-regulated and 101 down-regulated (q < 0.05) (Fig. 4j). Two classes of transcription factors were up-regulated in APOE4/4 iMCs, NFAT (NFAT5 and NFATc1) and C/EBP, have been reported to interact with APOE promoter43. We found the up-regulation of NFAT signaling particularly interesting because it is pharmacologically tractable and reported to be dysregulated in AD brains but the consequences of elevated NFAT-signaling on the cerebrovasculature are largely unknown44.
Inactive-NFAT resides in the cytoplasm where it is phosphorylated. Upon activation, calcineurin (CaN) dephosphorylates NFAT permitting its translocation to the nucleus and interaction with gene regulatory elements45. APOE4 iMCs contained significantly higher cytoplasmic and nuclear NFATc1 protein by immunostaining and western blotting (Fig. 4k; Extended Data Fig. 6b and c). Furthermore, genes encoding the catalytic subunits of CaN, PPP3CA and PPP3CC were significantly up-regulated (49.8% and 26.5%, respectively) in APOE4 iMCs (Extended Data Fig. 6d). In contrast, negative Regulators of Calcineurin, RCAN2, and RCAN3, were down-regulated (−23.7% and −27.7%, respectively) in APOE4 iMCs (Extended Data Fig. 6e)46. DYRK4, (but not DYRK1-3) a kinase that phosphorylates NFAT promoting its cytoplasmic retention, was also down-regulated (−38.9%) in APOE4 iMC (Extended Data Fig. 6f). These results indicate that there are bidirectional alterations in APOE4 iMCs consistent with elevated NFAT-mediated transcription. Indeed, genes reported to be NFAT-responsive (ACTG2 and VCAM1) were up-regulated in APOE4 iMCs47,48(Extended Data Data Fig. 6g).
snRNA-seq transcriptomics analysis of the post-mortem hippocampus further identified that both NFATc1 and NFATc2 are significantly higher in human brain pericytes from APOE4-carriers (n = 16) relative to non-carriers (n = 46) (4l and m). In contrast, NFATc1 and NFATc2 were not differentially expressed in endothelial cells (Extended Data Fig. 6h and i). In the human PFC, NFATc2 mRNA was also upregulated in human cortical pericytes/endothelial cells from APOE4-carriers compared to non-carriers via snRNA-seq (Extended Data Fig. 6j), further supporting that NFAT-signaling is elevated in APOE4 pericytes in the human brain.
Inhibition of Calcineurin (CaN) reduces APOE expression and ameliorates Aβ deposition
To determine whether dysregulation NFAT/calcineurin signaling in APOE4 pericytes contributes to up-regulated APOE expression, we inhibited calcineurin signaling in iMCs using well-established CaN inhibitors cyclosporine A (CsA) (2 μM), FK506 (5 μM) , and INCA6 ( 5 μM) (Extended Data Fig. 7a)49. After two weeks, each of the three inhibitors significantly reduced APOE expression in APOE4/4 iMCs as measured by qRT-PCR (Fig. 5a). CaN inhibition did not significantly reduce constitutively expressed proteins such as PGK1, HPRT, and GAPDH, suggesting that APOE down-regulation is not due to cellular death or global transcriptional repression (Extended Data Fig. 7b). APOE3/4 heterozygous iMCs also exhibited a significant reduction of APOE mRNA expression when treated with each of the three CaN inhibitors (Fig. 5b). CaN inhibition reduced intracellular APOE protein measured by immunofluorescence in both APOE4/4 homozygous and APOE3/4 heterozygous iMCs (Extended Data Fig. 7c and d). Likewise, CsA significantly reduced the concentration of soluble APOE protein in iMC media measured by ELISA (Fig 5c).
Fig. 5. Inhibition of Calcineurin reduces APOE expression and ameliorates Aβ deposition.
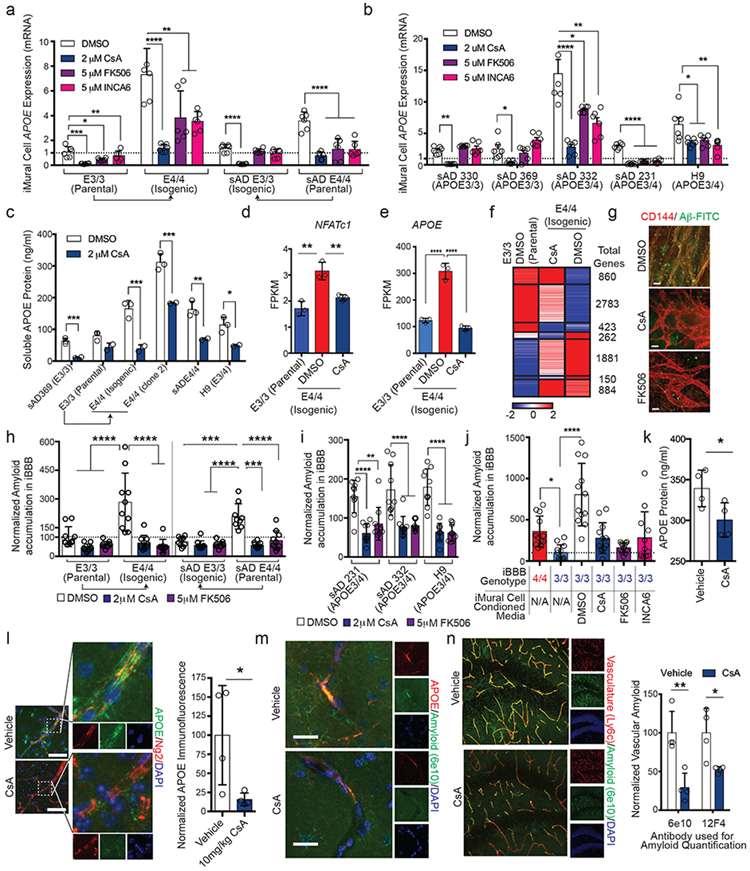
a and b Expression of APOE in isogenic (a) and heterozygous (b) iMural cells after two weeks treatment with DMSO, CsA, FK506 or INCA6. One-way ANOVA (p < 0.0001) with Bonferroni’s multiple comparison. N = 6 RNA samples prepared from independent wells. Center values are means and error bars are SD. (a) For CsA: E3/3, p = 0.0002; E4/4, p = 4.52 e-005; sADE3/3, p = 1.41 e-006; sADE4/4, p = 4.717 e-006. For FK506: E3/3, p = 0.006; E4/4, p =0.018; sADE3/3, p =0.142; sADE4/4, p = 0.0005. For INCA6: E3/3, p = 0.226; E4/4, p = 0.002; sADE3/3, p = 0.052; sADE4/4, p = 0.0001. (b) For CsA: sAD330, p = 384 e-006; sAD369, p = 0.006; sAD332, p =0.0004; sAD231, p = 2.17 e-008. H9, p = 0.025. For CsA: sAD330, p = 0.021; sAD369, p = 0.387; sAD332, p = 0.029; sAD231, p = 8.08 e-008. H9, p = 0.046. For CsA: sAD330, p = 0.57; sAD369, p = 0.095; sAD332, p = 0.008; sAD231, p = 5.6 e-007. H9, p = 0.015. c, Soluble APOE protein is significantly reduced following two-week treatment with calcineurin inhibitor CsA. APOE concentration in iMural cell conditioned media was quantified using ELISA from three separated biological replicates. Center value is mean and error bars are SD. Two-sided Multiple Student t-tests. Discovery determined using FDR method with Benjamini and Hochberg with Q = 1%. sAD369, p = 0.004; E3/3, p = 0.06; E4/4, p = 0.008; E4/4 clone 2, p = 0.007; sAD E4/4, p = 0.015; H9, p = 0.035. d and e, Expression of NFATc1 (d) and APOE (e) is down-regulated in iMural cells by CsA treatment. Bars are mean value from 3 biological replicates One-way ANOVA For NFATc1, E3/3 v E4/4 DMSO p = 0.0012; E4/4 DMSO v E4/4 CsA, p = 0.0068. For APOE, p < 0.0001) with Bonferroni’s multiple comparison Center values are mean expression from RNA prepared from 3 separate wells and error bars are SD f, Heat map depicting differentially expressed genes between isogenic APOE3/3 iMural cells treated with DMSO and APOE4/4 iMural cells treated with DMSO, or 2 μM CsA. Genes and organized by hierarchical clustering using Spearmann’s Rank correlation with average linkage. Boxes outline genes clustering together. The total genes for each cluster are presented on the right side of the heatmap depicted values are mean normalized counts from 3 independent biological replicates g, Representative images of E4/4 iMural cells treated with DMSO, CsA, or FK506 for two weeks and then exposed to 20 nM Aβ-FITC for 96 hours. Experiments were repeated at least 3 times (Scale bar = 10 μm) h, Quantification of amyloid accumulation in iBBBs treated with DSMO, CsA, or FK506. iBBBs were pre-treated with chemicals for two weeks and then exposed to 20 nM Aβ for 96 hours. Center values are mean and error across 10 iBBBs for each condition. Significance determined via One-way ANOVA (p < 0.0001) with Bonferroni’s multiple comparison. E3/3 DMSO v E4/4 DMSO, p < 0.0001; E4/4 DMSO v E4/4 CsA, p < 0.0001; E4/4 DMSO v E4 FK506, p p < 0.0001; sADE3/3 v sADE4/4, p = 0.0001; sADE4/4 DMSO v sADE3/3 CsA and FK506, p < 0.0001; sADE4/4 DMSO v sADE4 CsA, p 0.0003; sADE4/4 DMSO v sADE4/4 FK506, < 0.0001. i, Quantification of amyloid accumulation in APOE3/4 heterozygous iBBBs treated with DSMO, CsA, or FK506. iBBBs were pre-treated with chemicals for two weeks and then exposed to 20 nM Aβ for 96 hours. Center values and error bars are mean and SD amyloid accumulation across 10 iBBBs for each condition. Significance determined via One-way ANOVA (p < 0.0001) with Bonferroni’s multiple comparison. For sAD231: DMSO v CsA, p < 0.0001; DMSO v FK506, p = 0.0023. For sAD332: DMSO v CsA, p < 0.0001; DMSO v FK506, p < 0.0001. For H9: DMSO v CsA, p < 0.0001; DMSO v FK506, p < 0.0001. j, Quantification of Aβ accumulation in iBBBs treated with conditioned media from APOE4/4 iMural cells that were treated with calcineurin inhibitors for one at least week prior media harvesting. Center values and error bars are mean and SD amyloid accumulation across 12 iBBBs for each condition. One-way ANOVA (p < 0.0001) with Bonferroni’s multiple comparisons compared to E3/3. E3/3 v: E3/DMSO, p < 0.0001; E3/CsA, p = 0.3413; E3/FK506 > 0.9999; E3/INCA6, p = 0.3112. k, APOE protein concentration in the hippocampus of mice treated with either cyclosporine A or vehicle. APOE was measured by ELISA. Each dot represents mean APOE concentration from one mouse. Center value are means from 4 independent wells. Error bars are SD. Unpaired two-tailed t test (p = 0.0456). l, Representative image and quantification of immunostaining for APOE in cortical pericytes from APOE4 KI x 5xFAD mice treated with cyclosporine A or vehicle. Unpaired two-tailed t test (p = 0.0427). Center values are means from four mice. Error bars are SD. m, Representative image of concurrent reduction of vascular APOE protein and amyloid following a three-week treatment with CsA. This experiment was repeated in 4 mice with similar results. n, Representative images and quantification of vascular amyloid in the hippocampus following treatment of 6-month-old APOE4KI x 5XFAD female mice with either vehicle or CsA for three weeks. Amyloid was detected and quantified with two independent anti-amyloid antibodies (6e10 and 12F4). Center values are means from four mice for each condition. Error bars are SD. This experiment was repeated twice with similar results. Unpaired two-tailed t test (6e10, p = 0.0055; 12F4, p = 0.0242). (Scale Bars = 25 μm).
Global RNA-sequencing revealed that CsA treatment of iMCs reduced expression of NFATc1 to a comparable level observed in APOE3/3 DMSO treated iMCs (Fig. 5d). Decreased NFATc1 correlated with reduced expression of APOE in APOE4 iMCs (Fig. 5e). CsA treated APOE4/4 iMCs exhibited a transcriptional profile closer to APOE3/3 MCs (Fig. 5f). CsA led to upregulation of 860 genes that exhibited similar expression levels to APOE3/3 DMSO-treated iMCs that are involved in RNA processing and peptide synthesis (Fig. 5f; Extended Data Fig. 6e). 2,783 genes exhibited moderate up regulation in response to CsA reaching intermediate expression levels that were in between APOE3/3 and APOE4/4 iMCs. GO analysis categorized these genes to be involved in intracellular protein transport, cellular catabolic processes, and macromolecule localization (Extended Data Fig. 7e). CsA-treatment also led to down-regulation of 1881 genes involved in GTPase activity and neural tube closure (Fig. 5f). Spearman’s rank correlation analysis demonstrated that CsA-treated iMCs exhibited more transcriptional similarity (0.937) to APOE3 iMCs than DMSO-treated APOE4/4 iMCs (0.889) suggesting that inhibition of CaN in APOE4 iMCs broadly imparts transcriptional changes that increase similarity of APOE4 MCs to APOE3 MCs.
To examine whether CaN inhibition can also reduce APOE4-mediated amyloid, we treated two isogenic pairs of iBBBs with CsA or FK506 for two weeks and subsequently added 20 nM of Aβ1-40-/42-FITC for 96 hours. Both CsA and FK506 treatment led to significant reductions in amyloid accumulation in two-independent APOE4/4 iBBBs compared to their isogenic APOE3/3 controls (Fig. 5g and h). In APOE3/4 heterozygous iBBBs CaN inhibition also significantly reduced amyloid deposition (Fig. 5i). Similarly, conditioned media from APOE4/4 iMCs treated with DMSO caused a significant increase in amyloid deposition in the E3/3 iBBB (Fig. 5j). In contrast, media harvested from APOE4/4 iMCs treated with CsA, FK506, or INCA6 resulted in significantly reduced amyloid accumulation (Fig. 5j).
To examine whether these findings can be applied in vivo to reduce disease pathology, we first prepared cortical slice cultures from the APOE4KI mice, treated them with CsA or FK506 for 1 week and subsequently exposed them to Aβ−FITC for 96 hours. CsA or FK506-treated cortical slices exhibited significantly less accumulation than cortical slice treated with DMSO (Extended Data Fig. 7f-h). We next isolated primary brain pericytes from APOE4KI mice50 and subsequently treated them with DMSO, CsA or FK506 for two weeks. Primary brain pericytes isolated from APOE4KI mice down-regulated APOE mRNA expression in response to CsA and FK506 treatment (Extended Data Fig. 7i). We next employed 6-month-old APOE4KI mice crossed to the 5XFAD mice and treated these mice with CsA (10 mg/kg) for three weeks via intraperitoneal injection. CsA treatment significantly reduced soluble APOE concentration in the hippocampus measured by ELISA (Fig. 5k). APOE protein staining was also reduced surrounding Ng2-positive cortical and hippocampal pericytes of CsA-treated APOE4KIx5XFAD mice (Fig. 5l; Extended Data Fig. 7j). Co-staining for 6e10 and APOE showed that reduced APOE protein occurred simultaneously with reduced amyloid (Fig. 5m). CsA-treated mice had significantly reduced vascular amyloid when measured by two independent anti-amyloid antibodies (Fig. 5n and Extended Data Fig. 7k). This demonstrates that CaN/NFAT inhibition can reduce pericyte APOE levels and vascular amyloid in vivo.
Discussion
Here, we developed and validated a human in vitro model of the BBB. While the iBBB recapitulates numerous molecular and physiological features of the in vivo BBB there are clear differences that will benefit from future studies incorporating additional physiological aspects of the BBB and improving the fidelity of iPSC-derived vascular cells51. This study revealed that NFAT-mediated upregulation of APOE in human pericytes underlies the pathogenic effects of APOE4 in CAA. We pinpoint that APOE and NFAT are dysregulated in human pericytes in the PFC and hippocampus of APOE4 carriers. We establish that chemical inhibition of CaN in APOE4 iMCs reduces APOE mRNA and protein, and leads to reduced vascular amyloid acculmulation. In vivo administration of CaN/NFAT inhibitors to APOE4 AD mice also markedly reduced APOE expression and vascular amyloid. Interestingly, patients chronically administered CsA or FK506 have long been observed to have significantly lower incidence of dementia compared to the general population52. Our results provide new insight into these observations and highlight APOE and Calcineurin/NFAT-signaling as potential targets in APOE4-mediated CAA and AD.
Methods
Cell lines and differentiation
All hESC and hiPSC were maintained in feeder-free conditions in mTeSR1 medium (Stem Cell Technologies) on Matrigel coated plates (BD Biosciences). iPSC lines were generated by the Picower Institute for Learning and Memory iPSC Facility. CRISPR/Cas9 genome editing was performed as previously described38. All iPSC and hESC lines used in this study are listed in Supplementary Table 1. ESC/iPSC were passaged at 60-80% confluence using 0.5mM EDTA solution for 5 minutes and reseeding 1:6 onto matrigel-coated plates.
BEC Differentiation from iPSC
BEC differentiation was adapted from Qian et al., 201717. Human ESC/iPSC’s were disassociated to single cell via Accutase and reseeded at 35*103/cm2 onto matrigel coated plates in mTeSR1 supplemented with 10 μM Y27632 (Stem Cell Technologies). For the next two days, media was replaced with mTesR1 medium daily. On the third day, the medium as changed to DeSR1 medium (DMEM/F12 with Glutamax (Life Technologies) Supplemented with 0.1 mM B-mercaptoethanol, 1X MEM-NEAA, 1X penicillin-streptomycin and 6 μM CHIR99021 (R&D Systems). The following 5 days the medium was changed to DeSR2 (DMEM/F12 with Glutamax (Life Technologies) Supplemented with 0.1 mM B-mercaptoethanol, 1X MEM-NEAA, 1X penicillin-streptomycin and B-27 (Invitrogen)) and changed every day. After 5 days of DeSR2, the medium was changed to hECSR1 Human Endothelial SFM (ThermoFisher) supplemented with B-27, 10 μM retinoic acid and 20 ng/mL bFGF. The BEC’s were then split using Accutase and reseeded with hECSR1 supplemented with 10 μM Y27632. The BECs were then maintained through hECSR2 medium (hECSR1 medium lacking RA+bFGF).
Mural Cell Differentiation Protocol
Mural Cell differentiation was adapted from Patsch et al., 201518 and Kumar et al., 201720. iPSC’s were disassociated to single cell via Accutase and reseeded onto Matrigel-coated plates at 40,000 cells/cm2 in mTeSR1 media supplemented with 10 μM Y27632. On day one media was changed to N2B27 media (1:1 DMEM:F12 with Glutamax and Neurobasal Media (Life Technologies) supplemented with B-27, N-2, and penicillin-streptomycin) with 25 ng/ml BMP4 (Thermo Fisher PHC9531) and 8 μM CHIR99021. On day 4 and 5 medium was changed to N2B27 Supplemented with 10 ng/mL PDGF-BB (Pepprotech, 100-14B) and 2 ng/mL Activin A (R&D Systems, 338-AC-010). Mural Cells were then maintained in N2B27 media until co-cultured.
NPC Differentiation Protocol
NPCs were differentiated using dual SMAD inhibition and FGF2 supplementation as described in Chambers et al., Nat. Biotech 200936.
Astrocyte Differentiation Protocol
Astrocytes were differentiated as described in TCW, J et al., 201719. NPC’s were cultured with Neurobasal NPC Medium (DMEM/F12+GlutaMAX, Neurobasal Media, N-2 Supplement, B-27 Supplement, 5mL GlutaMAX, 10mL NEAA, 10mL penicillin-streptomycin) supplemented with bFGF (20ng/mL). Astrocyte differentiation was induced using astrocyte medium (AM) (Sciencell, 1801). AM was changed every other day and cells passaged at a 1:3 split when 90% confluent.
iBBB permeability studies
BECs were enzymatically dissociated by Accutase for 5 minutes following differentiation from iPSC’s. BECs were resuspended with hECSR1 supplemented with 10 μM Y27632 onto 24 well Matrigel-coated transwell polyester membrane cell culture inserts (0.4 μm pore size)(Corning, 29442-082) at a density of 500,000-1,000,000 cells/cm2 to achieve a confluent monolayer. 24 hours after seeding pericytes, astrocytes or MEFS were seeded on top of the BECs at a density of 50,000 cells/cm2. Permeability assays were completed when TEER values plateaued with minimum values >1000 Ohms/cm2 for two consecutive days, typically 6 days post-seeding. 4 kDa, 10 kDa, and 70 kDa labeled with fluorescein isothiocyanate (Sigma, 46944, FD10S, 46945), Transferrin (ThermoFisher T-13342), Alexa Fluor 555 Cadaverine (ThermoFisher a30677), BSA (ThermoFisher A34786) were mixed with media and a standard curve was generated. 600μL Fresh media was added to the bottom of the transwell, 100μL dye and media were added to the top. Permeability assays were conducted at 37°C for 1 hour. Media from the bottom of the transwell chamber was collected and analyzed via plate reader. For Efflux transporter Assays, cells were pre-incubated with 10μM rhodamine 123 (ThermoFisher, R302) and Hoechst dye, 5μM reversine 121, or 5 μM KO143 (Cayman Chemical 15215) for one hour at 37°C.
3D Cultures
1 × 10⁶ BECs/ml, and 2 × 10⁵ Astrocytes/ml and 2 × 10⁵ pericytes/ml were mixed together and encapsulated in Matrigel supplemented with 10% FBS, 10 ng/ml PDGF-BB, 10 ng/ml VEGF, and 10 ng/ml bFGF. Matigel cell solution was then seeded onto glass bottom culture dish. Matrigel was allowed to solidify for 40 minutes at 37˚ C and then grown in complete Astrocyte Media (SciCell) supplemented 10 ng/ml VEGFA. After two weeks VEGFA was withdrawn and iBBBs were subsequently cultured in astrocyte media only. 3D cultures matured for 1 month prior to experimentation and analysis. For imaging experiments, 3D cultures were fixed with 4% PFA overnight at 4˚C, washed and blocked for 24 hours each, then incubated with primary and secondary antibodies overnight at 4˚C each followed by a minimum of 48 hours washing.
Amyloid Beta accumulation
Amyloid accumulation was determined using both neuronal cell conditioned media and 20 nM recombinant labeled Hilyte fluor 488 β–amyloid (1-40) (Anaspec, AS-60491-01) and β–amyloid (1-42) (Anaspec, AS-60479-01) resuspended in PBS. Aβ accumulation for each cell line and experimental permutation was determined from 2D cultures containing all three cells types containing same ratio of cells as 3D experiments. Total area positive for Aβ was divided by the total number of nuclei and normalized to experimental controls. At least four images for each biological replicate were analyzed and for each condition at least three biological replicates were employed. 2D quantifications were corroborated by 3D imaging and analysis.
Immunofluorescence staining and APOE Immuno-depletion
Cells were washed with PBS and fixed for 15 minutes with 4% PFA (Electron Microscopy Sciences 15714-S). Samples were then washed with PBS three times for five minutes followed by a permeabilization in PBST for 30 minutes. Cells were blocked in PBST (0.1% Triton X-100) containing 5% Normal Donkey Serum (Millipore S30) and 0.05% sodium azide. Primary antibody staining was done overnight at 4°C. Primary and secondary antibodies are listed in Supplementary Table 1. Cells were washed three times for 5 minutes with PBST and incubated an hour at room temperature with their secondary antibody. For immunodepleting experiments, APOE was immunodepleted from pericyte conditioned media by incubating conditioned media with 5 μg of anti-APOE or non-specific IgG control antibodies overnight at 4˚C. Antibodies were then removed with magnetic protein A/G beads.
Western blot and Elisa lysis preparation
Cells were washed with PBS and then dissociated using Accutase. Cells were then counted using a hemocytometer with trypan blue and normalized to total cell number. Cells were then washed twice with PBS and lysed with RIPA buffer. Samples were resolved on 4-20% precast polyacrylamide gels (Bio-Rad 4561095). Protein was transferred onto PVDF membranes and blocked with TBST (50 mM Tris, 150 mM NaCl, 0.1% Tween 20) and 5% Milk for one hour at room temperature. Samples were probed overnight at 4°C on shaking incubator with the indicated primary antibodies. Soluble APOE was quantified from media condition by pericytes for 48 hours using APOE ELISA kit (ThermoFisher, EHAPOE). Uncropped western blot images are provided in the source data.
RNA analysis of iPSC-derived cell lines
Total RNA was isolated using Trizol and zymogen RNA-direct spin column treated with DNAse on column of 30 minutes prior to washing and elution. For RT-PCRs, 500 ng of total RNA was reverse transcribed into cDNA with iScript (BioRad). Expression was quantified by SsoFast EvaGreen supermix (BioRad). For RNAsequencing, extracted total RNA was subject to QC using an Advanced Analytical-fragment Analyzer before library preparation using Illumina Neoprep stranded RNA-seq library preparation kit. Libraries were pooled for sequencing using Illumina HiSeq2000 or NextSeq500 platforms at the MIT Biomicro Center. The raw fastq data were aligned to human hg19 assembly using STAR 2.4.0 RNA-seq aligner53. Mapped RNA-seq reads covering the edited APOE3/4 site were used to validate data genotypes. Gene raw counts were generated from the mapped data using feature Counts tool54. The mapped reads were also processed by Cufflinks2.255 with hg19 reference gene annotation to estimate transcript abundances. Gene differential expression test between APOE3 and APOE4 groups of each cell type was performed using Cuffdiff module with adjusted q-value < 0.05 for statistical significance. Geometric method was chosen as the library normalization method for Cuffdiff. Color-coded scatterplots were used to visualize group FPKM values for differentially expressed genes and other genes.
Single-nucleus RNA-sequencing and Human post-mortem tissue staining
Human hippocampal single-nuclei transcriptomic data profiled as part of The Religious Orders Study and Rush Memory and Aging Project56 (https://www.synapse.org/#!Synapse:syn3219045) was analyzed for computational identification and extraction of pericyte and endothelial single-cell transcriptomes. Putative pericyte and endothelial cells were identified by annotating groups of clustering cells presenting enriched expression of either pericyte or endothelial markers. Identified cells formed disjointed cell groups that did not display enrichment of neuronal, oligodendrocyte, oligodendrocyte progenitors, microglia or astrocyte markers. Cell type annotation was conducted using ACTIONet computational framework (http://compbio.mit.edu/ACTIONet/), considering curated gene marker sets reported in (Wang et al. 2018)57. A total of 614 putative endothelial and 4,523 putative pericyte cells with detected expression of either APOE, NFATC1, or NFATC2 were detected and considered for analysis. Corresponding gene counts are reported in (Supplementary table 1). Differential expression for APOE and NFAT genes in APOE4 vs. non-carrier cells was measured using a two-sided Wilcoxon rank sum test, considering cells with detected expression for the genes. snRNA-seq of prefrontal cortex from (Mathys et al., 2019)57 was analyzed further to identify putative pericytes and endothelial cells by extracting a cluster of cells specifically enriched with expression of pericyte markers. Identified cells (n=495 cells). Human post-mortem tissues were stained as described in (Mathys et al., 2019)40 with the exception that hippocampal sections which had been imbedded in paraffin and, therefore, xylene deparaffination and re-hydration steps preceded the staining protocol.
In vivo administration of cyclosporine A.
All experiments were performed according to the Guide for the Care and Use of Laboratory Animals and were approved by the National Institute of Health and the Committee on Animal Care at Massachusetts Institute of Technology. 5XFAD mice were obtained from The Jackson Laboratory (34848-JAX) and APOE4KI were obtained from Taconic. 5XFAD and APOE4KI mice were crossed for at least eight generations. Cylcosporine A was prepared 1 mg/ml in olive oil and injected interperitoneally at a concentration of 10 mg/kg into 6-month-old female mice daily for three weeks. Animals were anaesthetized with gaseous isoflurane and transcardially perfused with ice-cold phosphate-buffered saline (PBS). Brains were dissected out and split sagittally. One hemisphere was frozen, and one was post-fixed in 4% paraformaldehyde at 4°C overnight. The fixed hemisphere was sliced at a thickness of 40 μM using a Leica vibratome. Slices were blocked for two hours at room temperature and then incubated with primary antibody overnight at 4 C, subsequently washed five times for ten minutes in PBS, and incubated with secondary antibody and Hoechst (1:10000) for two hours at room temperature. Slices were then washed five times for ten minutes in PBS then mounted for imaging. Researchers performing imaging, quantification, and analysis were blind to experimental group of each mouse and unblinded only following analysis.
Isolation of primary mouse brain pericytes
Primary brain pericytes were isolated from 6 to 8 week old APOE4 knock-in mice as previously described in 58 Chapter 32. Primary brain pericytes were subsequently expanded for at least two passages and then treated with 2.5 μM cyclosporine A or 5 μM FK506 for two weeks. Gene expression was analyzed by RT-qPCR for human APOE and normalized to mouse GAPDH.
Statistics
Statistics was performed using GraphPad Prism 6.0. Correction for multiple comparison were included when needed. The number of replicates, and tests employed are detailed in the figure legends.
Extended Data
Extended Fig. 1. Characterization of human iPSC-derived cells.
a and b iPSC-derived brain endothelial cells stained with CD144 (VE-Cadherin), CD31 (PECAM), ZO1 and GLUT1. These experiments were repeated at least 4 times with similar results. c and d, iPSC-derived astrocytes stained with GFAP, S100β and AQP4. e and f Comparative expression analysis of genes in iPSC-derived astrocytes from RNA-sequencing that are reported to be the most differentially upregulated in these experiments were repeated at least 4 times with similar results. e, fibroblasts and f, oligodendrocytes when compared to astrocytes from In vivo data in Vanlandewijck et al., 2018. Astrocytes are from 6 independent bulk RNA-sequencing g-i iPSC-derived mural cells stained with CD13, SM22, NG2, and SMA. These experiments were repeated at least 2 times with similar results. j. Comparative expression analysis of the top differentially upregulated genes in pericytes compared to smooth muscle cells (SMCs) from In vivo data in Vanlandewijck et al., 2018. iMCs are from 6 independent bulk RNA-sequencing. Expression is represented as FPKM values from bulk RNA-sequencing. Center values are mean and error bars are SD k, Comparative expression analysis of the top differentially upregulated genes in SMCs compared to pericytes from In vivo data in Vanlandewijck et al., 2018. iMCs are from 6 independent bulk RNA-sequencing. Expression is represented as FPKM values from bulk RNA-sequencing Center values are mean and error bars are SD l, Expression of the top three differentially upregulated genes in pericytes compared to fibroblasts. m, Expression of the top three differentially upregulated genes in fibroblasts compared to pericytes from In vivo data in Vanlandewijck et al., 2018. iMCs are from 6 independent bulk RNA-sequencing. Center values are mean and error bars are SD. n, Expression of mural cells and mesenchymal marker genes in iPSC-derived mural cells. For e, f, j, k, l, m, differential gene lists are based on analysis provided shown as average counts compared to FPKM from bulk RNA-sequencing of iPSC-derived astrocytes and mural cells. Center value and error bars are means and SD from RNA prepared from 6 independent wells. o, Identification of In vivo Brain Endothelial, Pericyte, and SMC cluster via marker gene expression from single-nucleus RNA-sequencing of the human post-mortem hippocampus from 82 individuals. p, iPSC-derived mural cells express markers of in vivo human brain pericytes. Center values and error bars are means and SD from independent RNA prepared from 3 separate wells. q, Global hierarchical clustering of transcriptomes (13,338 genes) demonstrates that iPSC-derived mural cells cluster with in vivo human hippocampal pericytes. Clustering was performed by average correlation with simple linkage.
Extended Fig. 2. Characterization of human iBBB.
a, Three-dimensional vascular network of endothelial cells stained with CD144 scale bar = 200 μm. b, one week after formation iMCs labeled with SM22 are homogeneously dispersed and rudimentary vessels started forming. After two weeks endothelial vessels formed and iMCs have homed to perivascular space. c, Astrocytes are dispersed throughout iBBB cultures. Experiments in a-c were repeated at least 3 times. d, mRNA expression of AQP4 in each cell type alone, pair-wise and combined. One-way ANOVA with Bonferroni’s multiple comparison. **, p = 0.0013, 0.002, 0.0035, and 0.0076 for BECs, iMCs, Astrocytes, and BECs + iMCs respectively. ****, p < 0.0001. Center values and error bars are means and SDs from 6 independent RNA isolations. e, iBBB without astrocytes do not stain for AQP4 (green). In iBBBs with astrocytes AQP4 densely stains along endothelial vessels. f, Immunostaining for LAMA4 showing that Matrigel does not contain LAMA4 however iBBB cultures remodel basement membrane surrounding endothelial vessels to contain LAMA4. Experiments in e-f were repeated at least 3 times. g, PLVAP mRNA expression is upregulated in BECs from iBBB cultures compared to BECs cultured alone. Center values and error bars are mean and SD from RNA harvested from six independent wells. h, PLVAP mRNA expression is downregulated in BECs from iBBB upon removal of VEGFA from culture media. Center values and error bars are mean and SD from RNA harvested from six independent wells. Two-sided unpaired student t-test p < 0.0001. i, iBBB cultured in trans-well format express high levels of BBB marker CLDN5 (green) and ZO1 (red). Experiments in e-f were repeated at least 2 times. j, Polarization of ABCG2 was measured by Hoechst transport for both a BECs monolayer and the iBBB from the apical to the basolateral surface and vice versa. Samples treated with the ABCG2 specific inhibitor KO143 were normalized to each respective non-inhibitor treated sample. Stars represent significance determined by two-sided multiple student’s t-test (FDR = 0.01; p = 0.0011) Center values and error bars are mean and SD from 6 independent transwells.
Extended Figure 3. Validation of the iBBB as a model for CAA.
a, iBBBs generated from a familial AD patient iPSC with duplication of the APP gene (APP1.1) do not inherently have higher amyloid levels than non-AD controls (AG09173). b, iBBBs generated from iPSCs with a familial AD-associated mutation (M146I) in the PSEN1 gene do not inherently have higher amyloid levels than its non-AD isogenic control. Experiments in a and b were repeated at least 3 times. c, Media conditioned by neuronal cells derived from familial AD patient has significantly higher Aβ(1–42). Two-sided Student t-test (p = 0.0022) Center values and error bars are mean and SD from 3 independent wells. d, Representative images depicting that iBBBs derived from APOE3/4 individuals exhibit high levels of amyloid accumulation relative to iBBBs generated from APOE3/3 individuals. e and f, Representative images depicting that iBBBs derived from isogenic APOE3/3 and APOE4/4 individuals exhibit high levels of amyloid accumulation assay with anti-amyloid antibody Thioflavin T (f) and 12F4 (e). Experiments in d-f were repeated at least 3 times. g and h, Representative images and quantification of amyloid accumulation in isogenic iBBBs exposed to 20 nM Aβ-FITC for 1–40 and 1–42 isoforms. The total area positive for amyloid was divided by total nuclei and then normalized to the mean amyloid/nuclei from all E3/3 samples such that the mean of E3/E3 is set to 100% for each isoform. Students t-test, 1–40 p = 0.0044; 1–42 p > 0.00001. Experiments in were repeated at least 3 times. Center values and error bars are means and SD from 12 independent iBBBs. i and j, Normalized amyloid accumulation in isogenic iMCs and BECs mono-culture for each APOE genotype. Two-sided Students t-test, iMural cells, p = 0.0002; BECs p = 0.0118. Center values and error bars are means and SD from 12 independent wells.
Extended Fig. 4. APOE4 Pericytes Increase CAA pathology in iBBB.
a, Quantification of Aβ accumulation in deconstructed iBBBs. B/iMC/A3 and B/iMC/A4 indicate all APOE3/3 and APOE4/4 iBBBs respectively where B = BECs only, B/A = BECs and astrocytes, and B/iMC = BECs and iMural cells. Analysis was performed by One-way ANOVA with Bonferroni’s post-hoc analysis (p < 0.0001). Center values and error bars are means and SD from 5 independent iBBBs. B/iMCA3 v B/iMCA4, p = 0.0005; B/iMCA4 v: B3, p = 0.0001; B4, p = 0.0001; B/A3, p = 0.0064; B/A4, p = 0.0001; B/iMC3, p = 0.0026; B/iMC/A3 v B/iMC4, p < 0.0001. b, Exposing APOE4/4 astrocytes to APOE4/4 iMural cell conditioned media significantly increases amyloid accumulation compared APOE3/3 pericyte conditioned media. Unpaired two-sided Student t test, p = 0.0001. Center values and error bars are means and SD from 4 iBBBs. c, GO analysis from Toppfun (statistics described at https://toppgene.cchmc.org/enrichment.jsp) depicting biological processes associated with up-regulated and down-regulated genes. From RNA extracted from 3 independent wells of iMCs for each genotype.
Extended Fig. 5. APOE expression is selectively elevated in APOE4 pericytes.
a, Quantification and representative image of APOE protein expression in brain vascular pericytes (NG2-positive cells) and non-pericytes (NG2-negative) cells in APOE4 knock-in mouse. Two-sided Student t test, p < 0.0001 Scale bar = 50 um. Center values and error bars are means from 150 APOE-positive cells for each genotype. b, anti-APOE antibody (Abcam, ab52607) is specific for human APOE protein and does not react with mouse Apoe protein or other proteins present in wild-type mouse hippocampus as reported by the manufacturer. The staining was repeated using 3 different mice c and d, Expression of APOE in isogenic iMural cells (c) and astrocyte (d) measured by RNA sequencing each condition represents three biological replicates pericyte, q = 0.0003 astrocyte, q = 0.0006 statistics performed by Dseq2, Center values and error bars are mean and SD from RNA prepared from 3 independent wells for each genotype. e Violin plots depicting APOE expression in pericytes/endothelial cells isolated from post-mortem prefrontal cortex of APOE4-carriers (n = 7) compared to non-carriers (n = 18). Differential expression was measured using a two-tailed Wilcoxon rank sum test, considering cells with detected expression of APOE (p = 0.0026). f, Images and quantification of APOE protein expression in post-mortem human prefrontal cortex from APOE4 carriers and non-carriers. Unpaired two-tailed t test (p = 0.023). Center values and error bars are mean and SD from staining of 4 prefrontal cortex sections from 4 different individuals. g, Differential plot of representative maker genes showing that pericytes and endothelial cells isolated from human hippocampus segregated into distinct cellular clusters (n = 82 individuals). h, Violin plots depicting APOE expression in endothelial cells isolated from post-mortem hippocampus APOE4-carriers (n = 16) compared to non-carriers (n = 46). Differential expression was measured using a two-tailed Wilcoxon rank sum test, considering cells with detected expression of APOE. Center lines are mean and dashed line are SD. i, Images and quantification of APOE protein expression α-SMA positive SMC in post-mortem human hippocampus from APOE4 carriers and non-carriers. Unpaired two-tailed t test (p = 0.5814). Center values are mean and SD of hippocampal sections from 6 individuals for each genotype. j, Western blot of APOE and GAPDH protein in a isogenic iPSC line in which the APOE gene was truncated via CRISPR-editing to yield a line that does not express of APOE protein and therefore is termed APOEKO line. The experiment was repeated at least 3 time with similar results.
Extended Fig. 6. NFAT/Calcineurin signaling is selectively elevated in APOE4 pericytes.
a, Increasing the soluble APOE concentration through the addition of recombinant APOE protein to iBBB culture increases amyloid accumulation. One-way ANOVA with Bonferroni’s post-hoc analysis. Center values and error bars are mean and SD from 4 independent iBBBs for each condition. One-way ANOVA with Bonferroni’s multiple comparison test. APOE3/3 (Parental) V: APOE4/4 (Isogenic), p = 0.02; E3/3 + rAPOE3, p = 0.0034; E3/3+ rAPOE4, p = 0.0144. b and c, Representative western blot and quantification depicting nuclear NFATc1 expression in isogenic APOE3 and APOE4 iMCs. Unpaired student t test, p = 0.0254. Experiment was repeated 3 times with similar results. (c) Center values and error bars are mean and SD from 3 independent lysate preparations for each genotype. d, Expression of calcineurin catalytic subunits measured by RNAseq. PPP3CA (q = 0.0003); PPP3CC (q = 0.0188). Analysis from DSEQ2. Center values and error bars are mean expression and SD of RNA prepared from 3 independent wells for each genoptype. e, Expression of negative Regulators of Calcineurin genes (RCANs) measured by RNAseq. RCAN2 (q = 0.0003); RCAN3 (q = 0.0123). ). Analysis from DSEQ2. Center values and error bars are mean expression and SD of RNA prepared from 3 independent wells for each genoptype. f, Expression of DYRKs kinases known to phosphorylate NFAT measured by RNAseq. DYRK4 (q = 0.0003). Analysis from DSEQ2. Center values and error bars are mean expression and SD of RNA prepared from 3 independent wells for each genoptype. g, Expression of predicted NFAT response gene, VCAM1 and ACTG2, in iMural cells. Expression is quantified by qRT-PCR and normalized to the average of E3/3 cells. Significance determined by One-way ANOVA (p < 0.0001) with Bonferroni’s multiple comparison. For VCAM1 E3/3 (Parental) v: E4/4 (Isogenic), p < 0.0001; H9, p < 0.0001; 231, p = 0.0152; 332, p < 0.0001. For ACTG2 E3/3 (Parental) v: E4/4 (Isogenic), p = 0.0006; H9, p = 0.0108; 231, p = 0.0076; 332, p < 0.0001. Center values and error bars are mean expression and SD of RNA prepared from 4 independent wells for each cell line. h and i, Violin plots depicting NFATC1 (h) and NFATC2 (i) expression in pericytes isolated from post-mortem prefrontal cortex of APOE4-carriers (n = 16) compared to non-carriers (n = 46). Differential expression was measured using a two-tailed Wilcoxon rank sum test, considering cells with detected expression of APOE. Center lines are mean and dashed line are SD. j and k, Violin plots depicting NFATC2 expression in endothelial cells isolated from post-mortem prefrontal cortex of APOE4-carriers (n = 7 compared to non-carriers (n = 18). Differential expression was measured using a two-tailed Wilcoxon rank sum test, considering cells with detected expression of APOE (p = 0.035). Center lines are mean and dashed line are SD.
Extended Fig. 7. Inhibiting NFAT/Calcineurin signaling reduces APOE expression and CAA pathology.
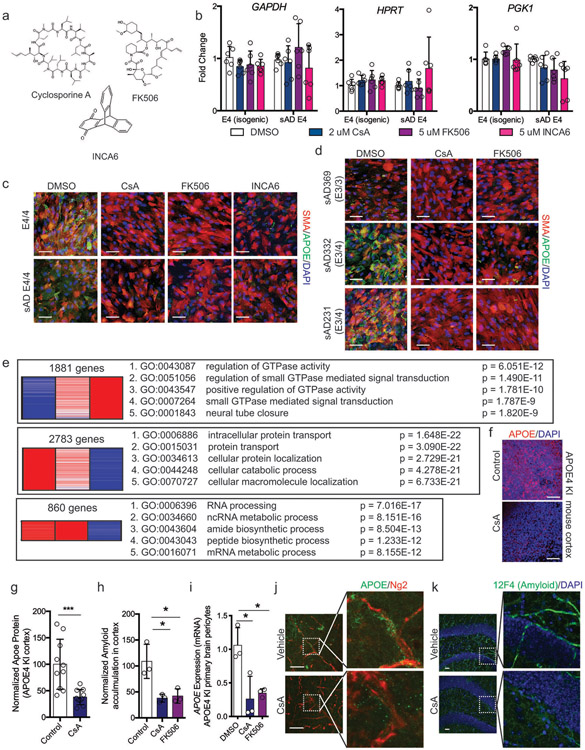
a, Chemical structures of Cyclosporine A (CsA), FK506, and INCA6 showing highly dissimilar structures. b, Expression of PGK1, HPRT, and GAPDH in pericytes after two weeks with DMSO, CsA, FK506 or INCA6. One-way ANOVA (p < 0.0001) with Bonferroni’s multiple comparison. Center values and error bars are mean expression and SD of RNA prepared from 4 independent wells for each cell line. c and d, Representative immunofluorescence imaging of APOE protein staining in pericytes after two weeks of treatment with chemicals. Scale bar, 50 μm. Experiments were repeated at least 3 times with similar results. e DEGs and associated GO terms for up-regulated and down-regulated genes in E3 and E4 CsA-treated pericyte from RNA-sequencing of RNA prepared from 3 independent wells for each condition. DEGs were determined by DSEQ2 and GO analysis was performed with Toppfun. f and g, Representative imaging and quantification depicting APOE protein expression in the APOE4KI mouse cortical slices following treatment with cyclosporine A (CsA) for one week. Unpaired, two tailed t test (p = 0.0009). Experiments were repeated with similar results using at least 3 slice preparations for each condition. Center values and error bars are mean intensity and SD from 12 independent measurements. h, Quantification of amyloid APOE4KI mouse cortical slices treated with either CsA or FK506 for one week and then exposed to 20 nM Ab for 48 hours. One-way ANOVA (p = 0.0105) with Bonferroni’s multiple comparison. Control v: CsA, p = 0.0188; FK506, p = 0.0245. Center values and error bars are mean and SD from slices prepared from 3 different mice. i, APOE mRNA expression in primary pericytes isolated from brain microvasculature of APOE4 knock-in mice treated with DMSO, Cyclosporine A, or FK506. One-way ANOVA (p = 0.0139) with Bonferroni’s multiple comparison. For DMSO v: CsA, p = 0.0221; FK506, p = 0.0367. Center values and error bars are mean and SD from pericytes prepared from 3 different mice. j, Representative image of immunostaining for APOE in hippocampal pericytes from APOE4 KI x 5xFAD mice treated with cyclosporine A or vehicle for one week. k, Representative images of vascular amyloid in the hippocampus following treatment of 6-month-old APOE4KI x 5XFAD female mice with either vehicle or CsA. Amyloid was detected and quantified with two independent anti-amyloid antibodies (6e10 and 12F4). These experiments were repeated 2 times with similar results.
Supplementary Material
Supplementary Video 1 iPSC-derived Brain endothelial cells in the iBBB stained for VE-Cadherin shown in green.
Supplementary Video 2 The iBBB with endothelial cells stained for ZO-1 shown in red and iMCs stained with SM22 shown in green.
Supplementary Video 3 The iBBB with endothelial cells stained with VE-Cadherin shown in red, Astrocytes stained with S100b in blue and Aquaporin 4 shown in green.
Supplementary Video 4 APOE4/4 iBBBs accumulate more amyloid than isogenic APOE3/3 iBBBs.
Acknowledgements
We thank J. Penny, W.C. Huang, Y.M. Yang, and P. Narayan for critically reading the manuscript, J.Z. Young, J. Ray, V. Buggia-Prevot, C. Fernandez, The Neurodegenerative Consortium, and all Tsai lab members for helpful discussions, A. Marco for expertise and support with microscopy, J. Seo for expertise and guidance with western blotting, and Y. Zhou and E. McNamara, P. Curtis, and T. Garvey for administrative support. This work was supported by The Robert A. and Renee E. Belfer Family Foundation to L.-H.T., Cure Alzheimer’s Fund to L.-H.T. and MK, RF1 AG062377 to L-HT and MK, RF1 AG048056,The NIH Common Fund’s Library of Integrated Network-based Cellular Signatures (LINCS) program by U54HG008097 to L.-H.T. and J. Jaffe (Broad Institute), P30AG10161, R01AG15819, R01AG17917, U0161356 to DAB, UG3NS115064 to L.-H.T. and JWB. M.B.V. is supported by the HHMI Hannah Gray Postdoctoral Fellowship. J.W.B was in part supported by The Glenn Foundation for Medical Research and American Federation for Aging Research Postdoctoral Fellowship during this work.
Footnotes
Competing financial interest
L-H. Tsai and J. Blanchard filed a patent application on the iBBB technology (PCT/US2020/014572). There are no competing finical interests.
Data Availability
All requests for raw and analyzed data and materials are promptly reviewed by the Massachusettes Institute of Technology, Technology Licensing Office to verify if the request is subject to any intellectual property or confidentiality obligations. Patient-related data not included in the paper were generated as part of clinical trials and may be subject to patient confidentiality. Any data and materials that can be shared will be released via a Material Transfer Agreement. All raw and analyzed sequencing data can be found at the NCBI Sequence Read Archive (accession number: GSE125869).
Work Cited
- 1.Andreone BJ, Lacoste B & Gu C Neuronal and vascular interactions. Annu. Rev. Neurosci 38, 25–46 (2015). [DOI] [PMC free article] [PubMed] [Google Scholar]
- 2.Zlokovic BV Neurovascular mechanisms of Alzheimer's neurodegeneration. Trends Neurosci. 28, 202–208 (2005). [DOI] [PubMed] [Google Scholar]
- 3.Iadecola C The Neurovascular Unit Coming of Age: A Journey through Neurovascular Coupling in Health and Disease. Neuron 96, 17–42 (2017). [DOI] [PMC free article] [PubMed] [Google Scholar]
- 4.Vemuri P et al. Vascular and amyloid pathologies are independent predictors of cognitive decline in normal elderly. Brain 138, 761–771 (2015). [DOI] [PMC free article] [PubMed] [Google Scholar]
- 5.Ransohoff RM How neuroinflammation contributes to neurodegeneration. Science 353, 777–783 (2016). [DOI] [PubMed] [Google Scholar]
- 6.Nation DA et al. Blood-brain barrier breakdown is an early biomarker of human cognitive dysfunction. Nat. Med 1 (2019). doi: 10.1038/s41591-018-0297-y [DOI] [PMC free article] [PubMed] [Google Scholar]
- 7.Ringman JM et al. Clinical Predictors of Severe Cerebral Amyloid Angiopathy and Influence of APOE Genotype in Persons With Pathologically Verified Alzheimer Disease. JAMA Neurol 71, 878–883 (2014). [DOI] [PMC free article] [PubMed] [Google Scholar]
- 8.Scheltens P, Neurology JGNR 2012. Dementia in 2011: microbleeds in dementia—singing a different ARIA. nature.com [DOI] [PubMed] [Google Scholar]
- 9.Iadecola C The Pathobiology of Vascular Dementia. Neuron 80, 844–866 (2013). [DOI] [PMC free article] [PubMed] [Google Scholar]
- 10.Greenberg SM, Rebeck GW, Vonsattel JPG, Isla TG & Hyman BT Apolipoprotein E ϵ4 and cerebral hemorrhage associated with amyloid angiopathy. Ann. Neurol 38, 254–259 (1995). [DOI] [PubMed] [Google Scholar]
- 11.Premkumar DR, Cohen DL, Hedera P, Friedland RP & Kalaria RN Apolipoprotein E-epsilon4 alleles in cerebral amyloid angiopathy and cerebrovascular pathology associated with Alzheimer’s disease. Am. J. Pathol 148, 2083 (1996). [PMC free article] [PubMed] [Google Scholar]
- 12.Shinohara M et al. Impact of sex and APOE4 on cerebral amyloid angiopathy in Alzheimer's disease. Acta Neuropathol. 132, 225–234 (2016). [DOI] [PMC free article] [PubMed] [Google Scholar]
- 13.Janzer RC & Raff MC Astrocytes induce blood-brain barrier properties in endothelial cells. Nature 325, 253–257 (1987). [DOI] [PubMed] [Google Scholar]
- 14.Armulik A et al. Pericytes regulate the blood?brain barrier. Nature 468, 557–561 (2010). [DOI] [PubMed] [Google Scholar]
- 15.Daneman R, Zhou L, Kebede AA & Barres BA Pericytes are required for blood-brain barrier integrity during embryogenesis. Nature 468, 562–566 (2010). [DOI] [PMC free article] [PubMed] [Google Scholar]
- 16.The Molecular Constituents of the Blood–Brain Barrier. Trends Neurosci. 38, 598–608 (2015). [DOI] [PMC free article] [PubMed] [Google Scholar]
- 17.Qian T et al. Directed differentiation of human pluripotent stem cells to blood-brain barrier endothelial cells. Sci Adv 3, e1701679 (2017). [DOI] [PMC free article] [PubMed] [Google Scholar]
- 18.Patsch C et al. Generation of vascular endothelial and smooth muscle cells from human pluripotent stem cells. Nat. Cell Biol 17, 994–1003 (2015). [DOI] [PMC free article] [PubMed] [Google Scholar]
- 19.TCW J et al. An Efficient Platform for Astrocyte Differentiation from Human Induced Pluripotent Stem Cells. Stem Cell Reports 9, 600–614 (2017). [DOI] [PMC free article] [PubMed] [Google Scholar]
- 20.Kumar A et al. Specification and Diversification of Pericytes and Smooth Muscle Cells from Mesenchymoangioblasts. Cell Rep 19, 1902–1916 (2017). [DOI] [PMC free article] [PubMed] [Google Scholar]
- 21.Armulik A, Genové G & Betsholtz C Pericytes: Developmental, Physiological, and Pathological Perspectives, Problems, and Promises. Dev Cell 21, 193–215 (2011). [DOI] [PubMed] [Google Scholar]
- 22.Attwell D, Mishra A, Hall CN, O’Farrell FM & Dalkara T What is a pericyte?:. Journal of Cerebral Blood Flow & Metabolism (2015). doi: 10.1177/0271678X15610340 [DOI] [PMC free article] [PubMed] [Google Scholar]
- 23.Vanlandewijck M et al. A molecular atlas of cell types and zonation in the brain vasculature. Nature 554, 475–480 (2018). [DOI] [PubMed] [Google Scholar]
- 24.He L et al. Single-cell RNA sequencing of mouse brain and lung vascular and vessel-associated cell types. Scientific Data 2018 5 5, 180160 (2018). [DOI] [PMC free article] [PubMed] [Google Scholar]
- 25.Bonomini F, Francesca B & Rezzani R Aquaporin and blood brain barrier. Curr Neuropharmacol 8, 92–96 (2010). [DOI] [PMC free article] [PubMed] [Google Scholar]
- 26.Gautam J, Zhang X & Yao Y The role of pericytic laminin in blood brain barrier integrity maintenance. Sci. Rep 6, 36450 (2016). [DOI] [PMC free article] [PubMed] [Google Scholar]
- 27.O'Brown NM, Pfau SJ & Gu C Bridging barriers: a comparative look at the blood–brain barrier across organisms. Genes & Development 32, 466–478 (2018). [DOI] [PMC free article] [PubMed] [Google Scholar]
- 28.Urich E, Lazic SE, Molnos J, Wells I & Freskgård P-O Transcriptional Profiling of Human Brain Endothelial Cells Reveals Key Properties Crucial for Predictive In Vitro Blood-Brain Barrier Models. PLoS ONE 7, e38149 (2012). [DOI] [PMC free article] [PubMed] [Google Scholar]
- 29.Zhao Z, Nelson AR, Betsholtz C & Zlokovic BV Establishment and Dysfunction of the Blood-Brain Barrier. Cell 163, 1064–1078 (2015). [DOI] [PMC free article] [PubMed] [Google Scholar]
- 30.Strickland LA et al. Plasmalemmal vesicle-associated protein (PLVAP) is expressed by tumour endothelium and is upregulated by vascular endothelial growth factor-A (VEGF). J. Pathol 206, 466–475 (2005). [DOI] [PubMed] [Google Scholar]
- 31.Srinivasan B et al. TEER Measurement Techniques for In Vitro Barrier Model Systems:. Journal of Laboratory Automation 20, 107–126 (2015). [DOI] [PMC free article] [PubMed] [Google Scholar]
- 32.Deli MA, Ábrahám CS, Kataoka Y & Niwa M Permeability Studies on In Vitro Blood–Brain Barrier Models: Physiology, Pathology, and Pharmacology. Cell Mol Neurobiol 25, 59–127 (2005). [DOI] [PMC free article] [PubMed] [Google Scholar]
- 33.Seetharaman S, Barrand MA, Maskell L & Scheper RJ Multidrug resistance-related transport proteins in isolated human brain microvessels and in cells cultured from these isolates. Journal of Neurochemistry 70, 1151–1159 (1998). [DOI] [PubMed] [Google Scholar]
- 34.Zhang Y et al. An RNA-sequencing transcriptome and splicing database of glia, neurons, and vascular cells of the cerebral cortex. J. Neurosci 34, 11929–11947 (2014). [DOI] [PMC free article] [PubMed] [Google Scholar]
- 35.Israel MA et al. Probing sporadic and familial Alzheimer's disease using induced pluripotent stem cells. Nature 482, 216–220 (2012). [DOI] [PMC free article] [PubMed] [Google Scholar]
- 36.Chambers SM et al. Combined small-molecule inhibition accelerates developmental timing and converts human pluripotent stem cells into nociceptors. Nat Biotechnol 30, 715–720 (2012). [DOI] [PMC free article] [PubMed] [Google Scholar]
- 37.Shi Y, Kirwan P & Livesey FJ Directed differentiation of human pluripotent stem cells to cerebral cortex neurons and neural networks. Nat Protoc 7, 1836–1846 (2012). [DOI] [PubMed] [Google Scholar]
- 38.Lin Y-T et al. APOE4 Causes Widespread Molecular and Cellular Alterations Associated with Alzheimer's Disease Phenotypes in Human iPSC-Derived Brain Cell Types. Neuron (2018). doi: 10.1016/j.neuron.2018.05.008 [DOI] [PMC free article] [PubMed] [Google Scholar]
- 39.Xu Q et al. Profile and regulation of apolipoprotein E (ApoE) expression in the CNS in mice with targeting of green fluorescent protein gene to the ApoE locus. J. Neurosci 26, 4985–4994 (2006). [DOI] [PMC free article] [PubMed] [Google Scholar]
- 40.Mathys H et al. Single-cell transcriptomic analysis of Alzheimer’s disease. Nature 1, 1 (2019). [DOI] [PMC free article] [PubMed] [Google Scholar]
- 41.Fryer JD et al. Apolipoprotein E Markedly Facilitates Age-Dependent Cerebral Amyloid Angiopathy and Spontaneous Hemorrhage in Amyloid Precursor Protein Transgenic Mice. J. Neurosci 23, 7889–7896 (2003). [DOI] [PMC free article] [PubMed] [Google Scholar]
- 42.Kim J et al. Haploinsufficiency of Human APOE Reduces Amyloid Deposition in a Mouse Model of Amyloid-β Amyloidosis. J. Neurosci 31, 18007–18012 (2011). [DOI] [PMC free article] [PubMed] [Google Scholar]
- 43.Maloney B, Ge Y-W, Alley GM & Lahiri DK Important differences between human and mouse APOE gene promoters: limitation of mouse APOE model in studying Alzheimer's disease. Journal of Neurochemistry 103, 1237–1257 (2007). [DOI] [PubMed] [Google Scholar]
- 44.Reese LC & Taglialatela G A role for calcineurin in Alzheimer's disease. Curr Neuropharmacol 9, 685–692 (2011). [DOI] [PMC free article] [PubMed] [Google Scholar]
- 45.Gwack Y et al. A genome-wide Drosophila RNAi screen identifies DYRK-family kinases as regulators of NFAT. Nature 441, 646–650 (2006). [DOI] [PubMed] [Google Scholar]
- 46.Mulero MC, Aubareda A, Schlüter A & Pérez-Riba M RCAN3, a novel calcineurin inhibitor that down-regulates NFAT-dependent cytokine gene expression. Biochim. Biophys. Acta 1773, 330–341 (2007). [DOI] [PubMed] [Google Scholar]
- 47.Lee MY, Garvey SM, Ripley ML & Wamhoff BR Genome-wide microarray analyses identify the protein C receptor as a novel calcineurin/nuclear factor of activated T cells-dependent gene in vascular smooth muscle cell phenotypic modulation. Arterioscler. Thromb. Vasc. Biol 31, 2665–2675 (2011). [DOI] [PMC free article] [PubMed] [Google Scholar]
- 48.Orr AW, Hastings NE, Blackman BR & Wamhoff BR Complex regulation and function of the inflammatory smooth muscle cell phenotype in atherosclerosis. J. Vasc. Res 47, 168–180 (2010). [DOI] [PMC free article] [PubMed] [Google Scholar]
- 49.Kapturczak MH, Meier-Kriesche HU & Kaplan B Pharmacology of calcineurin antagonists. Transplant. Proc 36, 25S–32S (2004). [DOI] [PubMed] [Google Scholar]
- 50.Boroujerdi A, Tigges U, Welser-Alves JV & Milner R in Cerebral Angiogenesis 383–392 (Humana Press, New York, NY, 2014). doi: 10.1007/978-1-4939-0320-7_31 [DOI] [Google Scholar]
- 51.Stebbins MJ et al. Human pluripotent stem cell-derived brain pericyte-like cells induce blood-brain barrier properties. Sci Adv 5, eaau7375 (2019). [DOI] [PMC free article] [PubMed] [Google Scholar]
- 52.Taglialatela G, Rastellini C & Cicalese L Reduced Incidence of Dementia in Solid Organ Transplant Patients Treated with Calcineurin Inhibitors. J. Alzheimers Dis 47, 329–333 (2015). [DOI] [PMC free article] [PubMed] [Google Scholar]
- 53.Dobin A et al. STAR: ultrafast universal RNA-seq aligner. Bioinformatics 29, 15–21 (2013). [DOI] [PMC free article] [PubMed] [Google Scholar]
- 54.Liao Y, Smyth GK, Bioinformatics WS 2013. featureCounts: an efficient general purpose program for assigning sequence reads to genomic features ∣ Bioinformatics ∣ Oxford Academic. academic.oup.com doi: 10.1093/bioinformatics/btt656","inLanguage":"en","copyrightHolder':’Oxford [DOI] [PubMed] [Google Scholar]
- 55.Trapnell C et al. Differential gene and transcript expression analysis of RNA-seq experiments with TopHat and Cufflinks. Nat Protoc 7, 562–578 (2012). [DOI] [PMC free article] [PubMed] [Google Scholar]
- 56.Bennett DA et al. Religious Orders Study and Rush Memory and Aging Project. Journal of Alzheimer's Disease 64, S161–S189 (2018). [DOI] [PMC free article] [PubMed] [Google Scholar]
- 57.Wang J et al. Gene expression distribution deconvolution in single-cell RNA sequencing. Proc. Natl. Acad. Sci. U.S.A 115, E6437–E6446 (2018). [DOI] [PMC free article] [PubMed] [Google Scholar]
- 58.Cerebral Angiogenesis. (Humana Press, New York, NY: ). [Google Scholar]
Associated Data
This section collects any data citations, data availability statements, or supplementary materials included in this article.
Supplementary Materials
Supplementary Video 1 iPSC-derived Brain endothelial cells in the iBBB stained for VE-Cadherin shown in green.
Supplementary Video 2 The iBBB with endothelial cells stained for ZO-1 shown in red and iMCs stained with SM22 shown in green.
Supplementary Video 3 The iBBB with endothelial cells stained with VE-Cadherin shown in red, Astrocytes stained with S100b in blue and Aquaporin 4 shown in green.
Supplementary Video 4 APOE4/4 iBBBs accumulate more amyloid than isogenic APOE3/3 iBBBs.
Data Availability Statement
All requests for raw and analyzed data and materials are promptly reviewed by the Massachusettes Institute of Technology, Technology Licensing Office to verify if the request is subject to any intellectual property or confidentiality obligations. Patient-related data not included in the paper were generated as part of clinical trials and may be subject to patient confidentiality. Any data and materials that can be shared will be released via a Material Transfer Agreement. All raw and analyzed sequencing data can be found at the NCBI Sequence Read Archive (accession number: GSE125869).