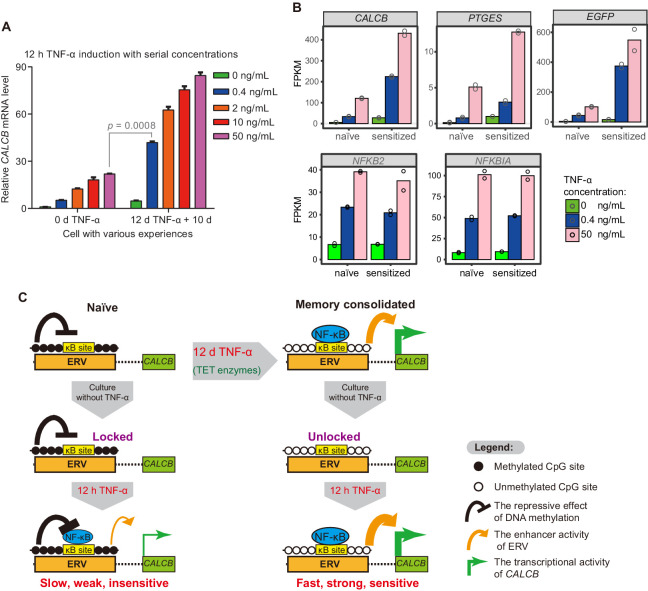
Figure 7. The memory consolidated cells are highly sensitive to low-dose TNF-α induction.
(A) RT-qPCR results show the CALCB transcriptional level of naïve cells and of cells that had experienced 12 days of TNF-α treatment following 12 hr of 0.4 ng/mL, 2 ng/mL, 10 ng/mL, and 50 ng/mL TNF-α treatments. The cells were cultured in TNF-α-free media for 10 days before receiving a second TNF-α stimulation. GAPDH is used as the internal control. Data are shown as mean ± SD from two independent experiments. Two-tailed t-test. (B) Expression levels (in FPKM) of EGFP, CALCB, and PTGES for naïve cells and memory consolidated cells in response to 12 hr TNF-α induction with various TNF-α concentrations. NFKB2 and NFKBIA, two TNF-α induced genes with no memory effect, are shown for comparison. Data are shown as the mean from two independent experiments. (C) Model illustration for the co-option of an ERV into the transcriptional memory module of CALCB in response to TNF-α. Memory consolidation offers faster, stronger, and more sensitive subsequent induction.

