

Abstract
Materials and Methods
Clinicopathological data of 185 patients with NPC treated at Nanfang Hospital of Southern Medical University between January 2013 and December 2014 were retrospectively analyzed. SPSS statistical software was used to analyze the clinicopathological data related to radiotherapy efficacy. Three patients who achieved complete remission and three with disease progression after CRT were selected. Differentially expressed genes (DEGs) were screened via mRNA microarray analysis of primary diagnostic endoscopy specimens.
Results
The peripheral blood leukocyte count, platelet count, and EBV-DNA copy number in NPC patients who were resistant to radiotherapy were higher than those in NPC patients who were sensitive to radiotherapy. The RobustRankAggreg (RRA) analysis method identified 392 DEGs, and the 66 most closely related genes among the DEGs were identified from the PPI network.
Conclusion
The results of this study indicate that screening for DEGs and pathways in NPC using integrated in silico analyses can help identify a series of genetic and clinical signatures for NPC patients treated with neoadjuvant chemotherapy followed by concurrent chemoradiotherapy.
1. Introduction
Nasopharyngeal carcinoma (NPC) is a highly malignant tumor originating from the epithelium; this disease shows a specific ethnic and geographical distribution [1]. NPC is prevalent among South and East Asian populations [2]. Lymph node and distant metastasis can occur early during disease progression without any obvious symptoms. More than 70% of NPC patients have locally advanced disease upon confirmation of their diagnosis. Improvements in treatment methods and implementation of comprehensive treatment strategies have substantially increased the 5-year survival rate of early-stage NPC patients to approximately 85% at present [3, 4]. Radiotherapy is an essential component of the treatment of nondisseminated disease with curative intent, and its application in conjunction with chemotherapy prolongs survival [5]. Because NPC is sensitive to radiotherapy and the nasopharynx has a unique anatomical position, the comprehensive treatment of NPC is mainly radical radiotherapy [6]. Although local control of NPC has improved significantly due to advances in radiotherapy and comprehensive treatments, some patients do not benefit from radiotherapy due to the radiation resistance caused by local recurrence and distant metastasis [7]. Moreover, a poor response to chemoradiotherapy is related to substantial adverse effects and high medical costs.
In the era of personalized medicine, individualized radiotherapy guided by biomarkers and/or combination therapy has begun to emerge [8]. Many studies have evaluated whether incorporating other clinical factors and molecular biomarkers into the current anatomical staging system can better predict survival because this system is insufficient in predicting the prognosis or therapeutic effect [9]. This type of research mainly focuses on the specific genetic characteristics relating to the diagnosis, prognosis, or prediction of treatment response [10]. Therefore, establishing a model to predict the survival outcome of patients with locally advanced NPC will help identify the patients who would benefit most from intensity-modulated radiation therapy (IMRT). The aim of this study is to explore the relevant clinical factors or sensitivity predictors of chemoradiotherapy, which will help guide the selection of individualized treatment options for NPC patients, improve the curative effect, and avoid ineffective or excessive treatment.
2. Methods
2.1. Patient and Specimen Selection
2.1.1. Patient Selection
Clinicopathological data of 185 patients with NPC from Nanfang Hospital of Southern Medical University between January 2013 and December 2014 were retrospectively analyzed. The inclusion criteria were as follows: (1) biopsy-proven NPC, (2) initial treatment with no previous antitumor therapies, and (3) stage I to IVb NPC according to the 2010 edition of the American Joint Committee on Cancer (AJCC) staging system. Other eligibility criteria included a Karnofsky score > 70, age 18–70 years old, and normal electrocardiography (ECG), complete blood count, and liver and renal function results. The baseline examination included nasopharynx and neck MRI, chest and upper abdomen enhanced CT, and whole-body bone scanning. The protocol was approved by the ethics committee of Nanfang Hospital NFEC-2018-013 and implemented in accordance with the principles of the Declaration of Helsinki. All participants provided informed consent.
2.1.2. Specimen Selection
Three patients with complete remission and three with disease progression after CRT were selected (Table 1). The principle of specimen selection was as follows. (1) Resistant group: three months after the end of radiotherapy and chemotherapy, no obvious regression of the tumor was confirmed by imaging, and the pathology confirmed tumor residue. (2) Sensitive group: three months after the end of radiotherapy and chemotherapy, the tumor responded completely or partially to the treatment as confirmed by imaging and pathology. The endoscopic specimens obtained from the first diagnosis were used for the mRNA microarray.
Table 1.
Patient information for mRNA microarrays.
| Sample | Gender | Age | T stage | N stage | M stage | TNM stage |
|---|---|---|---|---|---|---|
| 1∗ | Male | 61 | 1 | 1 | 0 | III |
| 2∗ | Female | 28 | 4 | 1 | 0 | IVa |
| 3∗ | Female | 34 | 3 | 2 | 0 | IVa |
| 4∗∗ | Female | 48 | 2 | 2 | 0 | IVa |
| 5∗∗ | Male | 37 | 2 | 1 | 0 | III |
| 6∗∗ | Female | 34 | 4 | 1 | 0 | IVa |
∗sensitive group; ∗∗ resistant group.
2.1.3. Therapeutic Method
(1) Chemotherapy: stage I patients received concurrent radiotherapy and chemotherapy while stage II-IVb patients received induction chemotherapy (IC) and concurrent chemotherapy. IC consisted of paclitaxel+fluorouracil (TP) or cisplatin+fluorouracil (PF) regimens. Two cycles of chemotherapy were repeated every three weeks, followed by concurrent radiotherapy (RT) and cisplatin administration (40 mg/m2) weekly on weeks 7 through 14. (2) Radiotherapy: IMRT was used in radical radiotherapy, and the target area was defined according to the ICRU [11] 71 and 83 [12] recommendations and the international consensus guidelines [13]. Reductions in nasopharyngeal and neck masses were examined by MRI or CT three months after treatment. RECIST 1.1 criteria were used to evaluate treatment efficacy [14]. A complete response (CR) was defined by the disappearance of all lesions, with nodes measuring <10 mm and the EBV-DNA copy number reduced to a normal level. An increase of ≥20% from the nadir or baseline was defined as progressive disease (PD). A decrease of at least 30% in the sum of diameters of target lesions in relation to the baseline sum diameters was defined as partial response (PR). Stable disease (SD) was defined as any result between PR and PD. Patients with either CR or PR were classified as the sensitive group while those with SD and PD were classified as the resistant group. The nasopharyngeal biopsy is required to confirm the residual in SD and PD patients
2.2. Customized mRNA Microarrays
The gene expression profile was obtained by an Affymetrix Human U133 Plus 2.0 chip. Total RNA was extracted and purified using RecoverAllTM Total Nucleic Acid Isolation (Cat. #AM1975, Ambion, Austin, TX, US) following the manufacturer's instructions. The initial sample of the chip experiment was the total RNA. Total RNA was examined on a NanoDrop ND-2000 spectrophotometer and an Agilent Bioanalyzer 2100 (Agilent Technologies, Santa Clara, CA, US). The qualified RNA could be used for subsequent chip experiments. No RNA degradation or DNA mixing occurred when at least two distinct bands representing 28S and 18S ribosomal RNA were available on the electrophoretogram. At least 2 micrograms of the sample is usually needed before purification. The total RNA was amplified, labeled, and purified using an Ovation FFPE WTA System (Cat. #3403, NuGEN, San Carlos, CA, US) and FL-Ovation™ cDNA Biotin Module V2 (Cat. #4200, NuGEN) following the manufacturer's instructions to obtain biotin-labeled cRNA. Array hybridization and washing were performed using a GeneChip® Hybridization, Wash and Stain Kit (Cat. #900720, Affymetrix, Santa Clara, CA, US) in a Hybridization Oven 645 (Cat. #00-0331-220V, Affymetrix) and a Fluidics Station 450 (Cat. #00-0079, Affymetrix) following the manufacturer's instructions. The slides were scanned by a GeneChip® Scanner 3000 (Cat. #00-00212, Affymetrix) and Command Console Software 4.0 (Affymetrix) with default settings. Raw data were normalized by the MAS 5.0 algorithm, Gene Spring Software 12.6.1 (Agilent Technologies, Santa Clara, CA, US).
2.3. mRNA Microarray Sorting and Analysis
The linear microarray data model (limma) package [15] in R language was used to screen the differentially expressed genes (DEGs) between the radiosensitive group and the resistant group. Differentially expressed genes (DEGs) were screened according to the fold change (FC) compared with the control values, and those with FC ≥ 2 and p value <0.05 according to the t-test were considered DEGs. Then, GO analysis and KEGG enrichment pathway analysis were performed on the obtained differential genes. Details about the in silico analyses are provided in the supplementary information (available here).
2.3.1. Statistical treatment
The SPSS 22.0 statistical software was used to analyze the continuous variables as the mean ± standarddeviation. The statistics are expressed as percentages, and the χ2 test and t-test were used for significance tests. A p value of <0.05 was considered statistically significant.
3. Results
3.1. Characteristics of Clinical Data
The sensitive group included 124 patients with an average age of 46.1 years, and the resistant group included 61 patients with an average age of 46.1 years. No significant differences in gender ratio, age distribution, smoking history, or drinking history between the two groups were found. The T staging and N staging of the resistant group were significantly higher than those of the sensitive group (p = 0.001, 0.005, respectively). No significant difference was found in the probability of metastasis between the two groups before treatment (p = 0.577). The results showed that the proportion of differentiated tumors in the resistant group was significantly higher than that in the sensitive group (p = 0.01) (Table 2).
Table 2.
Basic clinical data.
| Items | Sensitive group | Resistant group | p value |
|---|---|---|---|
| Sex | |||
| Male | 87 (70.2%) | 49 (80.3%) | 0.16 |
| Female | 37 (29.8%) | 12 (19.7%) | |
| Age | 46.1 ± 11.5 | 46.1 ± 10.8 | 0.98 |
| Smoking | 47 (37.9%) | 29 (47.5%) | 0.27 |
| Drinking | 11 (8.9%) | 8 (13.1%) | 0.44 |
| Family history | 23 (18.5%) | 13 (21.3%) | 0.695 |
| Tumor differentiation | |||
| Differentiated | 4 (3.3%) | 8 (14.3%) | 0.01 |
| Undifferentiated | 119 (96.7%) | 48 (85.7%) | |
| T staging | |||
| T1 | 16 (12.9%) | 3 (4.9%) | 0.001 |
| T2 | 25 (20.2%) | 6 (9.8%) | |
| T3 | 45 (36.3%) | 15 (24.6%) | |
| T4 | 38 (30.6%) | 37 (60.7%) | |
| N staging | |||
| N0 | 9 (7.3%) | 11 (18.0%) | 0.005 |
| N1 | 34 (27.4%) | 5 (8.2%) | |
| N2 | 76 (61.3%) | 40 (65.6%) | |
| N3 | 5 (4.0%) | 5 (8.2%) | |
| M staging | |||
| Mx | 4 (3.2%) | 2 (3.3%) | 0.577 |
| M0 | 116 (93.5%) | 55 (90.2%) | |
| M1 | 4 (3.2%) | 4 (6.6%) |
3.2. Analysis of Hematological Examination and Treatment Plan before Chemoradiotherapy
The level of EBV DNA in the resistant group was significantly higher than that in the sensitive group (resistant group vs. sensitive group = 14.24 ± 35.86 × 10⁴copies/mlvs. 2.08 ± 8.04 × 10⁴copies/ml, p = 0.028). A total of 132 patients received induction chemotherapy: 87 in the sensitive group and 45 in the resistant group. No noticeable difference was observed in the proportion of patients receiving induction chemotherapy between the two groups. A total of 104 patients in the sensitive group received concurrent chemotherapy during radiotherapy, as did 41 patients in the resistant group. No significant difference was found in the cumulative dose of cisplatin between the two groups (sensitive group 138.62 ± 98.533mg, resistant group 113.28 ± 105.13mg, p = 0.110), and no significant difference was found in the number of patients with a cumulative dose of cisplatin > 200mg/m2 between the two groups. A total of 107 patients received adjuvant chemotherapy, and no significant difference was found in the proportion of adjuvant chemotherapy and the cumulative dose of cisplatin between the two groups.
All patients were assessed for nasopharyngeal lesion regression within 1 year after treatment. The response rate of radiotherapy and chemotherapy in the sensitive group was 98.4% (122/124). In the resistant group, 49.2% (30/61) of the lesions shrunk after the treatment. Among them, 83.3% (25/30) of the patients had an in situ recurrence of nasopharyngeal tumors within 2 years, and 13.3% (4/30) had an in situ recurrence of nasopharyngeal tumors within 3 years. Two patients were reexamined in the external hospital after treatment, and the case data of the other hospital indicated that the nasopharyngeal tumor had recurred. However, the imaging data after treatment could not be provided, and the curative effect was not evaluated. Twenty-eight patients experienced distant metastasis during observation, including 13 cases of metastasis in the sensitive group and 15 cases in the resistant group. The statistical analysis showed that the proportion of distant metastases was higher in the resistant group than in the sensitive group, and this difference was significant (p = 0.016) (Table 3).
Table 3.
Adjuvant examinations and treatment options prior to chemoradiotherapy.
| Items | Sensitive group | Resistant group | p value |
|---|---|---|---|
| Leukocyte count, G/L | 6.95 ± 1.96 | 8.02 ± 2.35 | 0.01 |
| Neutrophil count, G/L | 4.41 ± 1.65 | 5.3 ± 1.99 | 0.01 |
| Percentage of neutrophils, % | 62.58 ± 8.95 | 65.62 ± 9.66 | 0.037 |
| Platelet count, G/L | 249.89 ± 68.96 | 281.25 ± 70.53 | 0.005 |
| EBV antibody | |||
| Positive | 56 (60.9%) | 20 (57.1%) | 0.840 |
| Negative | 36 (39.1%) | 15 (42.9%) | |
| EBV-DNA copy numbers 104 copies/ml | 2.08 ± 8.04 | 14.24 ± 35.86 | 0.028 |
| Time from diagnosis to RT | 17.09 ± 35.771 | 32.33 ± 34.942 | 0.011 |
| Cumulative dose of cisplatin in concurrent chemotherapy | 138.62 ± 98.533 | 113.28 ± 105.13 | 0.110 |
| Cumulative dose of cisplatin in concurrent chemotherapy (>200 mg/m2) | 31 (30.4%) | 11 (21.2%) | 0.255 |
| Distant metastasis | |||
| Yes | 13 (10.5%) | 15 (24.6%) | 0.016 |
| No | 111 (89.5%) | 46 (75.4%) |
3.3. Results of the Gene Chip Data Analysis
3.3.1. DEGs between Two Groups
The expression microarray results are listed in Figure 1. The microarray results identified 392 differentially expressed genes between the two groups: 92 downregulated genes and 300 upregulated genes. Figure 2 shows the differential expression of multiple genes between the two groups included in the microarray. Figure 3 shows the cluster heat map of the top 200 DEGs.
Figure 1.

Standardization of gene expression. The blue bar represents the data before normalization, and the red bar represents the normalized data. The abscissa represents each sample, and the ordinate represents the quantity of expression.
Figure 2.

DEGs between two sets of samples. The upregulated genes (red dots) were selected based on FC > 2.0 and a corrected p value of <0.05. The downregulated genes (green dots) were screened based on an FC ≤ −2.0 and a corrected p value of <0.05. Genes with no significant difference in the expression are indicated by the black spot. Abbreviation: FC: fold change.
Figure 3.

Hierarchical clustering heat map of DEGs screened based on a ∣foldchange | >2.0 and a corrected p value <0.05. The upregulated genes (red) were screened based on an FC > 2.0 and a corrected p value of <0.05. The downregulated genes (green) were screened based on an FC ≤ −2.0 and a corrected p value of <0.05. Genes with no significant difference in the expression are indicated by black boxes. Gray indicates that the signal intensity of the gene was not sufficiently high to be detected. Abbreviation: FC: fold change.
3.3.2. GO Term Enrichment Analysis of DEGs
The results of the gene ontology analysis of DEGs include three parts: biological processes, molecular functions, and cellular components (Figure 4). Table 4 shows the results of the gene ontology enrichment analysis of DEGs in NPC. In the biological process group, the DEGs were mainly concentrated in pathways relating to the immune response, blood microparticles, negative regulation of cell proliferation, positive regulation of early endosome to late endosome transport, establishment of epithelial cell apical/basal polarity, inflammatory response, T cell receptor signaling pathway, regulation of cytokine secretion, MyD88-dependent Toll-like receptor signaling pathway, positive regulation of T cell proliferation, defense response to virus, integrin-mediated signaling pathway, regulation of cell shape, protein localization to organelle, detection of triacyl bacterial lipopeptide, positive regulation of innate immune response, regulation of cytoskeleton organization, platelet activation, regulation of cell size, intracellular pH reduction, Toll-like receptor TLR1:TLR2 signaling pathway, cellular response to triacyl bacterial lipopeptide, and positive regulation of type I interferon production. In the molecular function group, the DEGs were mainly enriched in protein binding and voltage-gated ion channel activity. In the cell composition group, the DEGs were mainly enriched in the apical part of the cell, microvillus, membrane-to-membrane docking, Golgi cisterna membrane, endoplasmic reticulum, intracellular environment, membrane, endocytic vesicle lumen, filopodium, filopodium assembly, nucleoplasm, Toll-like receptor 1-Toll-like receptor 2 protein complex, microvillus membrane, extracellular matrix organization, ruffle membrane, Golgi-associated vesicle membrane, and TCR signalosome. These results show that most DEGs are significantly enriched in protein binding, the nucleoplasm, the membrane, the intracellular environment, and the endoplasmic reticulum.
Figure 4.
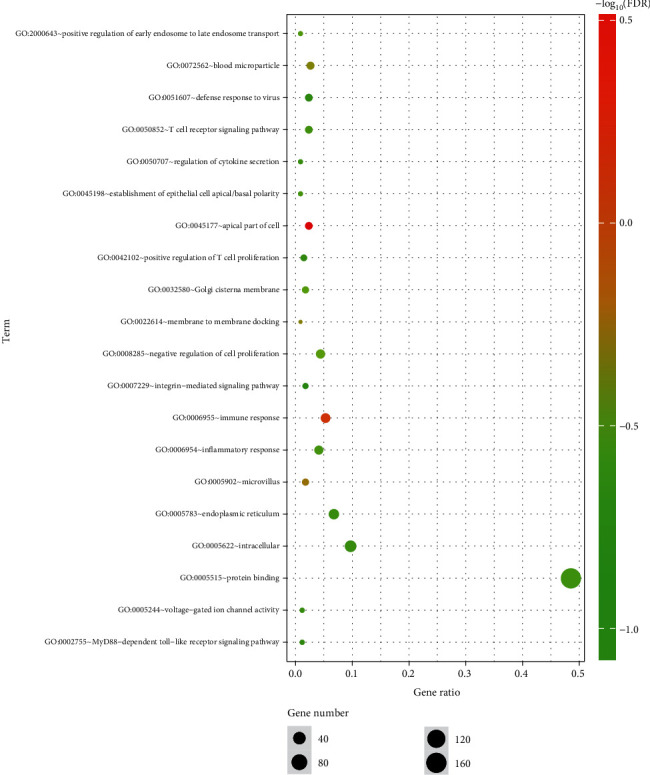
GO enrichment analysis of DEGs. Notes: The number of genes (“count”) divided by the number of total genes is the gene ratio. The size of the dots represents the number of core genes, and the color indicates the adjusted p. Only pathways with an adjusted p < 0.05 were enriched.
Table 4.
GO analysis of DEGs associated with NPC.
| Term | Description | Count | p value |
|---|---|---|---|
| GO:0045177 | Apical part of the cell | 8 | 0.000206 |
| GO:0006955 | Immune response | 18 | 0.000551 |
| GO:0005902 | Microvillus | 6 | 0.002229 |
| GO:0022614 | Membrane-to-membrane docking | 3 | 0.00255 |
| GO:0072562 | Blood microparticle | 9 | 0.003304 |
| GO:0008285 | Negative regulation of cell proliferation | 15 | 0.005509 |
| GO:2000643 | Positive regulation of early endosomal to late endosomal transport | 3 | 0.006912 |
| GO:0032580 | Golgi cisterna membrane | 6 | 0.007681 |
| GO:0045198 | Establishment of epithelial cell apical/basal polarity | 3 | 0.008792 |
| GO:0006954 | Inflammatory response | 14 | 0.009314 |
| GO:0050852 | T cell receptor signaling pathway | 8 | 0.01067 |
| GO:0050707 | Regulation of cytokine secretion | 3 | 0.013148 |
| GO:0005515 | Protein binding | 165 | 0.013285 |
| GO:0005783 | Endoplasmic reticulum | 23 | 0.015217 |
| GO:0005622 | Intracellular environment | 33 | 0.015487 |
| GO:0005244 | Voltage-gated ion channel activity | 4 | 0.015554 |
| GO:0002755 | MyD88-dependent Toll-like receptor signaling pathway | 4 | 0.016183 |
| GO:0042102 | Positive regulation of T cell proliferation | 5 | 0.016355 |
| GO:0051607 | Defense response to virus | 8 | 0.018434 |
| GO:0007229 | Integrin-mediated signaling pathway | 6 | 0.022738 |
| GO:0016020 | Membrane | 48 | 0.026775 |
| GO:0071682 | Endocytic vesicle lumen | 3 | 0.026816 |
| GO:0008360 | Regulation of cell shape | 7 | 0.026966 |
| GO:0033365 | Protein localization to organelle | 3 | 0.027197 |
| GO:0030175 | Filopodium | 5 | 0.027746 |
| GO:0046847 | Filopodium assembly | 3 | 0.030498 |
| GO:0035354 | Toll-like receptor 1-Toll-like receptor 2 protein complex | 2 | 0.032006 |
| GO:0005654 | Nucleoplasm | 58 | 0.032009 |
| GO:0042495 | Detection of triacyl bacterial lipopeptide | 2 | 0.032252 |
| GO:0045089 | Positive regulation of innate immune response | 3 | 0.033949 |
| GO:0031528 | Microvillus membrane | 3 | 0.037025 |
| GO:0051493 | Regulation of cytoskeleton organization | 3 | 0.037543 |
| GO:0030168 | Platelet activation | 6 | 0.039723 |
| GO:0008361 | Regulation of cell size | 3 | 0.041276 |
| GO:0030198 | Extracellular matrix organization | 8 | 0.041455 |
| GO:0032587 | Ruffle membrane | 5 | 0.043625 |
| GO:0030660 | Golgi-associated vesicle membrane | 3 | 0.044525 |
| GO:0036398 | TCR signalosome | 2 | 0.047624 |
| GO:0051452 | Intracellular pH reduction | 2 | 0.047987 |
| GO:0038123 | Toll-like receptor TLR1:TLR2 signaling pathway | 2 | 0.047987 |
| GO:0071727 | Cellular response to triacyl bacterial lipopeptide | 2 | 0.047987 |
| GO:0032481 | Positive regulation of type I interferon production | 4 | 0.049991 |
3.3.3. KEGG Pathway Analysis of DEGs
The DEGs obtained in the microarray were analyzed by the online analysis database KOBAS 3.0 (http://kobas.cbi.pku.edu.cn/). Table 5 and Figure 5 show the most significant enrichments of DEGs from the KEGG analysis. The signaling pathways of DEGs were mainly enriched in the PI3K-Akt signaling pathway, tuberculosis, Epstein-Barr virus infection, phagosomes, cytokine-cytokine receptor interactions, inflammatory bowel disease (IBD), legionellosis, influenza A, leishmaniasis, and antigen processing and presentation.
Table 5.
KEGG pathway analysis of DEGs associated with NPC.
| Pathway | ID | Gene count | p value | Corrected p value | Genes |
|---|---|---|---|---|---|
| Inflammatory bowel disease (IBD) | hsa05321 | 7 | 2.46E-06 | 0.000487 | STAT6, HLA-DQB1, IL21R, TLR2, IL2RG, NFKB1, IL1A |
| Tuberculosis | hsa05152 | 9 | 2.85E-05 | 0.002826 | HLA-DQB1, IL10RA, ATP6AP1, TLR1, TLR2, NFKB1, FCGR2A, CTSS, IL1A |
| Phagosome | hsa04145 | 8 | 6.66E-05 | 0.004396 | HLA-DQB1, ITGAV, ATP6AP1, TAP2, TLR2, FCGR2A, CTSS, THBS3 |
| Legionellosis | hsa05134 | 5 | 0.000138 | 0.00684 | CXCL2, PYCARD, HSPA6, TLR2, NFKB1 |
| PI3K-Akt signaling | hsa04151 | 11 | 0.000187 | 0.007419 | NRAS, ITGAV, TLR2, GNB4, IL2RG, NFKB1, THBS3, GHR, CSF1R, COL4A5, DDIT4 |
| Epstein-Barr virus infection | hsa05169 | 8 | 0.000402 | 0.012426 | POLR2H, POLR3F, FGR, IL10RA, PSMC1, HSPA6, NFKB1, HLA-DQB1 |
| Cytokine-cytokine receptor interaction | hsa04060 | 9 | 0.000488 | 0.012426 | TNFSF13B, IL10RA, IL21R, IL2RG, CXCL11, IL1A, GHR, CSF1R, CXCL2 |
| Leishmaniasis | hsa05140 | 5 | 0.000502 | 0.012426 | HLA-DQB1, TLR2, NFKB1, FCGR2A, IL1A |
| Antigen processing and presentation | hsa04612 | 5 | 0.00063 | 0.013854 | HLA-DQB1, TAP2, HSPA6, CTSS, KLRC1 |
| Influenza A | hsa05164 | 7 | 0.000849 | 0.016811 | HLA-DQB1, PYCARD, HSPA6, RSAD2, NFKB1, NXF1, IL1A |
Figure 5.

KEGG pathway analysis of DEGs in NPC. Notes: The number of genes (“count”) divided by the number of total genes is the gene ratio. The size of the dots represents the number of core genes, and the color indicates the adjusted p value. Only pathways with an adjusted p < 0.05 were enriched.
3.3.4. Analysis of DEGs in NPC Using a PPI Network
Using the STRING database [16] (http://string-db.org) to construct a protein-protein interaction (PPI) network, we obtained 392 DEGs, including 300 upregulated genes and 92 downregulated genes. After pruning away the orphaned and loosely connected nodes, an interactome network of DEGs was constructed, as shown in Figure 6. The 66 hub genes, including 55 upregulated genes and 11 downregulated genes, showing the most significant interaction are listed in Table 6.
Figure 6.

PPI network. Notes: The more proteins interact with each other, the larger the dot is, indicating that the more central the network is, the more critical and important the role is. Red indicates upregulated genes, and green indicates downregulated genes. Abbreviation: PPI: protein–protein interaction.
Table 6.
Hub genes in NPC by PPI network.
| Hub genes | Gene names |
|---|---|
| Upregulated genes | ANApc16, MSN, FSMC1, ATAD2B, FYTTD1, TAGLN2, Tnfsf13B, TLR1, cdKN3, CTBp1, wipf1, NF-KB1, Spsb1, TLR2, NRAS, CXCL2, STAT6, VHL, LCP2, IL10RA, CTSS, HSPA6, FCGR2A, NRIp1 (RIP140), THOC5, Il1A, RAp2A, RNF139, CXCL11, VSIG4, DTX3L (BBAP), IRAK3 (IRAKM), ms4a7, HIST1H2Ac, FGR, PDE4B, F2RL2, FPR3, RSAD2, SUPT16H, GIMAP4, RNF19B, LrRc57, p2RY13, SLAmF8, CIQB, CSFIR, GNAT2, VCAMI, ASPN, GNB4, GBP5, PApsS1, TLR10, and NXF1 |
| Downregulated genes | HACE1, NEDD8, Nup35, POLR2H, HPX, HP, APOA1, HRG, GC, TRIM45, EZR |
Abbreviation: PPI: protein-protein interaction.
4. Discussion
NPC is a malignant tumor that is very sensitive to radiation, and its sensitivity can differ depending upon the degree of tumor differentiation. A lower degree of differentiation indicates a higher sensitivity to radioactivity. In China, especially in south China, the most common pathological type is the nonkeratinized undifferentiated type (WHO type II) [17], which is very sensitive to radiation. However, many studies have shown that radiotherapy can not only kill the tumors but also change the expression level of many genes and proteins [18, 19]. These changes can reduce the sensitivity of the tumor to radiation and thus lead to radiation resistance. Radiotherapy resistance is the main cause of failure in the treatment of nasopharyngeal carcinoma [20]. Therefore, exploring the molecular mechanism of radiotherapy resistance of nasopharyngeal carcinoma is very important in improving the effects of radiotherapy and improving the prognosis of patients with nasopharyngeal carcinoma.
Among the 185 patients included, 61 patients with NPC had poor curative effects or local recurrence in the short term. Comparing the differentiation of tumors in the two groups, the proportion of differentiation types in the resistant group was higher than that in the sensitive group (14.3% vs. 3.3% in the resistant group, p = 0.01). This result again suggests that more differentiated tumors are less sensitive to radiotherapy. Epstein-Barr virus infection is very common in NPC patients. Mutirangura [21] in 1997 and LO [22] in 1999 found that the positive rate of EBV-DNA and the copy number were significantly higher in the sera of NPC patients than in the sera of healthy controls. Subsequent studies confirmed that the positive rate and level of EBV-DNA detection in nasopharyngeal cancer patients with recurrence or metastasis (the median quantitative concentration of EBV in the recurrence or metastasis group was 32350 copies/ml) were significantly higher than those in patients who achieved clinical remission. In the sensitive group, the median concentration of EBV-DNA was 0 copies/ml (p = 0.01) [23]. During follow-up, the researchers found that plasma EBV-DNA levels were elevated in patients with recurrent nasopharyngeal cancer approximately six months before the onset of clinical symptoms. Similar to our results, the EBV level in the blood of the nasopharyngeal-cancer-resistant group was significantly higher than that of the sensitive group: the median concentration of EBV in the resistant group was 142,400 copies/ml compared with 20,800 copies/ml in the sensitive group (p = 0.028). Therefore, we speculated on whether EBV infection and the EBV-DNA copy number are associated with radiosensitivity in NPC.
According to the current theory regarding the molecular biology of cancer, the radiosensitivity of cancer cells may be regulated by a complex network. Differences in any link in such a system, such as a mutation or a difference in expression in a single gene, may affect radiosensitivity. At present, although the research on radiosensitivity has been extensive, most studies have examined only one or a limited number of genes and their expression products. To further understand the molecular mechanism of radiosensitivity of cancer cells, simultaneously detecting the expression of several genes related to this network is necessary. Gene chip technology provides a semiquantitative analysis of a large number of genes at the whole-genome level. It can compare differences in gene expression among different samples at the same time, reveal new genes, and analyze gene interaction networks through a clustering analysis and functional enrichment. Therefore, gene chip technology is widely used in research on a variety of cancers, such as cholangiocarcinoma [24], colorectal cancer [25], breast cancer [26], and pancreatic cancer [27]. However, the identification of DEGs and hub genes will help us better understand the molecular mechanism of NPC progression and consequently develop more biomarkers, which will be helpful for the study of the early diagnosis and treatment of NPC [28, 29]. However, the gene research in NPC mainly focuses on the occurrence, development, recurrence, and metastasis of NPC [30, 31]. Few similar studies on radiation resistance have been published.
In this study, we used the gene expression profile technology of an mRNA microarray to obtain a large number of DEGs and then used molecular biology information technology for data processing to identify molecular markers that can predict the efficacy of CRT. The results identified 392 DEGs, including 300 upregulated genes and 92 downregulated genes. The DEGs in NPC were analyzed by GO functional annotation, which showed that most DEGs are significantly enriched in protein binding, the nucleoplasm, membranes, intracellular environment, and the endoplasmic reticulum. Thus, the differential genes may be mainly related to cells. At present, many studies have shown that the radiosensitivity is closely related to the cell cycle [32].
The signaling pathways of DEGs determined by the KEGG signal pathway analysis were mainly enriched in the PI3K-Akt signaling pathway, tuberculosis, Epstein-Barr virus infection, phagosomes, cytokine-cytokine receptor interactions, inflammatory bowel disease (IBD), legionellosis, influenza A, leishmaniasis, and antigen processing and presentation. The PI3K-Akt signaling pathway is closely related to tumorigenesis and cancer progression. Many studies have been published on the relationship between the PI3K-Akt signaling pathway and nasopharyngeal carcinoma. They include, for example, how microRNA-29 targets FGF2 and inhibits the proliferation, migration, and invasion of nasopharyngeal carcinoma cells via the PI3K/AKT signaling pathway; CHL1 suppresses tumor growth and metastasis in nasopharyngeal carcinoma by repressing the PI3K/AKT signaling pathway via interaction with Integrin β1 and Merlin [33]; and microRNA-29 targets FGF2 and inhibits the proliferation, migration, and invasion of nasopharyngeal carcinoma cells via the PI3K/AKT signaling pathway [34]. Therefore, the PI3K/Akt signaling pathway plays an important role in the occurrence, development, recurrence, and metastasis of nasopharyngeal carcinoma. In this study, we found that the differentially expressed genes were mainly enriched in the PI3K Akt signaling pathway, warranting further study.
Using the STRING database to construct a PPI network, we obtained 66 hub genes, including 55 upregulated genes and 11 downregulated genes. The mechanisms and functions of these genes and their roles in the radiotherapy resistance of NPC should be further studied.
For a long time, research on improving the effect of radiotherapy has been focused on cancer cells; however, in recent years, research has focused on the tumor microenvironment (TME). As a result, most of the classical radiobiology dogma fails to consider the effect of radiotherapy on the TME, and the reaction of radiotherapy to the TME may be very important for the success or failure of the treatment. Therefore, the attempt to combine radiotherapy with new biological targeted therapy is usually based on the potential to enhance cancer cell death induced by radiotherapy rather than on the potential to enhance radiosensitization by influencing TME. Many strategies have been proposed to overcome the radiation resistance of tumor cells, but little research has been conducted on the TME-mediated mechanisms of radiation resistance and how to circumvent these mechanisms [35]. In recent years, radiation therapy and the immune microenvironment have become popular research topics [36, 37]. In this study, the results of the gene chip analysis showed that the genes differentially sensitive and insensitive to CRT in NPC were associated with the immune microenvironment, including the immune response, T cell receptor signaling pathway, positive regulation of T cell proliferation, positive regulation of the innate immune response, Toll-like receptor TLR1:TLR2 signaling pathway, TCR signalosomes, and intracellular pH reduction. However, how these different genes affect the efficacy of preoperative chemoradiotherapy is unclear; further basic scientific and clinical research studies are needed.
5. Conclusion
The peripheral blood leukocyte count, platelet count, and EBV-DNA copy number were higher in patients with NPC who were resistant to radiotherapy than in those who were sensitive to radiotherapy. The results of this study show that bioinformatics analyses of gene chip data can help us to identify and screen a series of gene characteristics related to NPC sensitivity to radiotherapy and chemotherapy. The genes involved in the mechanism of radiosensitivity in NPC patients are closely related to platelet aggregation, inflammatory factors, and EBV infection pathways, which will be of great clinical value in the future. Monitoring and controlling the cytokines related to inflammation and immunity can prevent and delay the occurrence and development of tumors to a certain extent. Additional follow-up studies should explore the relevant factors or predictive indicators of chemoradiotherapy sensitivity, which will help guide the selection of individualized treatment options for NPC patients, improve the curative effect, and avoid ineffective or excessive treatment.
Some limitations to this study exist. We analyzed a series of differential genes of radiotherapy resistance in nasopharyngeal carcinoma; however, due to time and financial constraints, we did not conduct subsequent functional verification. Further molecular biological experiments are required to confirm the function of the identified genes associated with NPC.
Acknowledgments
This work was supported by the Clinical Research Startup Program of Southern Medical University by High-level University Construction Funding of Guangdong Provincial Department of Education (LC2019ZD008); the Clinical Research Startup Program of Nanfang Hospital (2018CR021); the National Natural Science Foundation of China (Grant Nos. 81602685 and 81672992); the Science and Technology Projects in Guangdong Province (Grant Nos. 2018-1201-SF-0019); the Health & Medical Collaborative Innovation Project of Guangzhou City, China (201803040003); the Natural Science Foundation of Guangdong Province (Grant No. 2017A030313486); and the Natural Science Foundation of Fujian Province (Grant No. 2017J01245).
Contributor Information
Longhua Chen, Email: chenlh5461@163.com.
Jian Guan, Email: guanjian5461@163.com.
Data Availability
The data used to support the findings of this study are available from the corresponding author upon request.
Conflicts of Interest
We declare no competing interests.
Authors' Contributions
JG and LC designed this study. YD, JG, LC, TX, and HP were involved in the treatment and management of the patients. YD, LY, YW, MC, and MY were involved in the conception of the manuscript. YD, YZ, LZ, and MY were involved in the drafting of the manuscript or critical revision of the manuscript for important intellectual content. All authors reviewed the manuscript and approved the final version. Yongmei Dai, Yue Zhang, and Mi Yang contributed equally to this work.
Supplementary Materials
DEGs between the sensitive and resistant groups. GO and KEGG pathway enrichment analyses. Protein-protein interaction (PPI) network integration.
References
- 1.Xu M., Yao Y., Chen H., et al. Genome sequencing analysis identifies Epstein-Barr virus subtypes associated with high risk of nasopharyngeal carcinoma. Nature Genetics. 2019;51(7):1131–1136. doi: 10.1038/s41588-019-0436-5. [DOI] [PMC free article] [PubMed] [Google Scholar]
- 2.Tian Y. M., Tian Y. H., Zeng L., et al. Prognostic model for survival of local recurrent nasopharyngeal carcinoma with intensity-modulated radiotherapy. British Journal of Cancer. 2014;110(2):297–303. doi: 10.1038/bjc.2013.715. [DOI] [PMC free article] [PubMed] [Google Scholar]
- 3.Zhang L.-N., Gao Y.-H., Lan X.-W., Tang J., OuYang P.-Y., Xie F.-Y. Effect of taxanes-based induction chemotherapy in locoregionally advanced nasopharyngeal carcinoma: a large scale propensity-matched study. Oral Oncology. 2015;51(10):950–956. doi: 10.1016/j.oraloncology.2015.07.004. [DOI] [PubMed] [Google Scholar]
- 4.Zhang Y. W., Chen L., Bai Y., Zheng X. Long-term outcomes of late course accelerated hyper-fractionated radiotherapy for localized esophageal carcinoma in Mainland China: a meta-analysis. Diseases of the Esophagus. 2011;24(7):495–501. doi: 10.1111/j.1442-2050.2010.01173.x. [DOI] [PubMed] [Google Scholar]
- 5.Pastor M., Lopez Pousa A., del Barco E., et al. SEOM clinical guideline in nasopharynx cancer (2017) Clinical and Translational Oncology. 2018;20(1):84–88. doi: 10.1007/s12094-017-1777-0. [DOI] [PMC free article] [PubMed] [Google Scholar]
- 6.You R., Cao Y. S., Huang P. Y., et al. The changing therapeutic role of chemo-radiotherapy for loco-regionally advanced nasopharyngeal carcinoma from two/three-dimensional radiotherapy to intensity-modulated radiotherapy: a network meta-analysis. Theranostics. 2017;7(19):4825–4835. doi: 10.7150/thno.21815. [DOI] [PMC free article] [PubMed] [Google Scholar]
- 7.Guo Y., Zhang Y., Zhang S. J., Ma Y. N., He Y. Comprehensive analysis of key genes and microRNAs in radioresistant nasopharyngeal carcinoma. BMC Medical Genomics. 2019;12(1):p. 73. doi: 10.1186/s12920-019-0507-6. [DOI] [PMC free article] [PubMed] [Google Scholar]
- 8.Hirst D. G., Robson T. Molecular biology: the key to personalised treatment in radiation oncology? British Journal of Radiology. 2010;83(993):723–728. doi: 10.1259/bjr/91488645. [DOI] [PMC free article] [PubMed] [Google Scholar]
- 9.Chen Y. P., Chan A. T. C., Le Q. T., Blanchard P., Sun Y., Ma J. Nasopharyngeal carcinoma. The Lancet. 2019;394(10192):64–80. doi: 10.1016/S0140-6736(19)30956-0. [DOI] [PubMed] [Google Scholar]
- 10.Chibon F. Cancer gene expression signatures - the rise and fall? European Journal of Cancer. 2013;49(8):2000–2009. doi: 10.1016/j.ejca.2013.02.021. [DOI] [PubMed] [Google Scholar]
- 11.Berthelsen A. K., Dobbs J., Kjellén E., et al. What’s new in target volume definition for radiologists in ICRU Report 71? How can the ICRU volume definitions be integrated in clinical practice? Cancer Imaging. 2007;7(1):104–116. doi: 10.1102/1470-7330.2007.0013. [DOI] [PMC free article] [PubMed] [Google Scholar]
- 12.Bley C. R., Meier V. S., Besserer J., Schneider U. Intensity-modulated radiation therapy dose prescription and reporting: sum and substance of the International Commission on Radiation Units and Measurements Report 83 for veterinary medicine. Veterinary Radiology & Ultrasound. 2019;60(3):255–264. doi: 10.1111/vru.12722. [DOI] [PubMed] [Google Scholar]
- 13.Lin L., Lu Y., Wang X. J., et al. Delineation of neck clinical target volume specific to nasopharyngeal carcinoma based on lymph node distribution and the international consensus guidelines. International Journal of Radiation Oncology • Biology • Physics. 2018;100(4):891–902. doi: 10.1016/j.ijrobp.2017.11.004. [DOI] [PubMed] [Google Scholar]
- 14.Eisenhauer E. A., Therasse P., Bogaerts J., et al. New response evaluation criteria in solid tumours: Revised RECIST Guideline (version 1.1) European Journal of Cancer. 2009;45(2):228–247. doi: 10.1016/j.ejca.2008.10.026. [DOI] [PubMed] [Google Scholar]
- 15.Smyth G. K. Linear models and empirical Bayes methods for assessing differential expression in microarray experiments. Statistical Applications in Genetics and Molecular Biology. 2004;3(1):1–25. doi: 10.2202/1544-6115.1027. [DOI] [PubMed] [Google Scholar]
- 16.Szklarczyk D., Morris J. H., Cook H., et al. The STRING database in 2017: quality-controlled protein-protein association networks, made broadly accessible. Nucleic Acids Research. 2017;45(D1):D362–D368. doi: 10.1093/nar/gkw937. [DOI] [PMC free article] [PubMed] [Google Scholar]
- 17.Wei K. R., Xu Y., Liu J., Zhang W. J., Liang Z. H. Histopathological classification of nasopharyngeal carcinoma. The Asian Pacific Journal of Cancer Prevention. 2011;12(5):1141–1147. [PubMed] [Google Scholar]
- 18.Huang T., Yin L., Wu J. Research on radiation sensitization effect of microrna and clinical perspectives in nasopharyngeal carcinoma. Journal of Clinical Otorhinolaryngology, Head, and Neck Surgery. 2015;29(17):1574–1576. [PubMed] [Google Scholar]
- 19.Zhang Y., Zuo Y., Guan Z., et al. Salinomycin radiosensitizes human nasopharyngeal carcinoma cell line Cne-2 to radiation. Tumor Biology. 2016;37(1):305–311. doi: 10.1007/s13277-015-3730-6. [DOI] [PubMed] [Google Scholar]
- 20.Lee A. W. M., Ma B. B. Y., Ng W. T., Chan A. T. C. Management of nasopharyngeal carcinoma: current practice and future perspective. Journal of Clinical Oncology. 2015;33(29):3356–3364. doi: 10.1200/jco.2015.60.9347. [DOI] [PubMed] [Google Scholar]
- 21.Mutirangura A., Tanunyutthawongese C., Pornthanakasem W., et al. Genomic alterations in nasopharyngeal carcinoma: loss of heterozygosity and Epstein-Barr virus infection. British Journal of Cancer. 1997;76(6):770–776. doi: 10.1038/bjc.1997.460. [DOI] [PMC free article] [PubMed] [Google Scholar]
- 22.Lo Y. M., Chan L. Y., Lo K. W., et al. Quantitative analysis of cell-free Epstein-Barr virus DNA in plasma of patients with nasopharyngeal carcinoma. 1999;59(6):1188–1191. [PubMed] [Google Scholar]
- 23.Lo Y. M., Chan L. Y., Chan A. T., et al. Quantitative and temporal correlation between circulating cell-free Epstein-Barr virus DNA and tumor recurrence in nasopharyngeal carcinoma. 1999;59(21):5452–5455. [PubMed] [Google Scholar]
- 24.Jusakul A., Cutcutache I., Yong C. H., et al. Whole-genome and epigenomic landscapes of etiologically distinct subtypes of cholangiocarcinoma. Cancer Discovery. 2017;7(10):1116–1135. doi: 10.1158/2159-8290.CD-17-0368. [DOI] [PMC free article] [PubMed] [Google Scholar]
- 25.Beyes S., Andrieux G., Schrempp M., et al. Genome-wide mapping of DNA-binding sites identifies stemness-related genes as directly repressed targets of SNAIL1 in colorectal cancer cells. Oncogene. 2019;38(40):6647–6661. doi: 10.1038/s41388-019-0905-4. [DOI] [PubMed] [Google Scholar]
- 26.Gillet J. P., Schneider J., Bertholet V. Microarray expression profiling of ABC transporters in human breast cancer. Cancer Genomics & Proteomics. 2006;3(2):97–106. [PubMed] [Google Scholar]
- 27.Pogue-Geile K. L., Mackey J. A., George R. D., et al. A new microarray, enriched in pancreas and pancreatic cancer cDNAS to identify genes relevant to pancreatic cancer. 2004;1:371–386. [PubMed] [Google Scholar]
- 28.Zhang J. Z., Wu Z. H., Cheng Q. Screening and identification of key biomarkers in nasopharyngeal carcinoma: evidence from bioinformatic analysis. Medicine. 2019;98(48, article e17997) doi: 10.1097/md.0000000000017997. [DOI] [PMC free article] [PubMed] [Google Scholar]
- 29.Jiang X., Feng L., Dai B., Li L., Lu W. Identification of key genes involved in nasopharyngeal carcinoma. Brazilian Journal of Otorhinolaryngology. 2017;83(6):670–676. doi: 10.1016/j.bjorl.2016.09.003. [DOI] [PMC free article] [PubMed] [Google Scholar]
- 30.Yuan L., Liu Z. H., Lin Z. R., Xu L. H., Zhong Q., Zeng M. S. Recurrent FGFR3-TACC3 fusion gene in nasopharyngeal carcinoma. Cancer Biology & Therapy. 2014;15(12):1613–1621. doi: 10.4161/15384047.2014.961874. [DOI] [PMC free article] [PubMed] [Google Scholar]
- 31.Chung G. T. Y., Lung R. W. M., Hui A. B. Y., et al. Identification of a recurrent transformingUBR5–ZNF423fusion gene inEBV‐associated nasopharyngeal carcinoma. The Journal of Pathology. 2013;231(2):158–167. doi: 10.1002/path.4240. [DOI] [PMC free article] [PubMed] [Google Scholar]
- 32.Xu M., Tian G. L., Hao C. C., Shi M., Zha D. J., Liang K. Microrna-29 targets Fgf 2 and inhibits the proliferation, migration and invasion of nasopharyngeal carcinoma cells via Pi3k/Akt signaling pathway. European Review for Medical and Pharmacological Sciences. 2020;24(13):p. 7199. doi: 10.26355/eurrev_202007_21849. [DOI] [PubMed] [Google Scholar]
- 33.Chen J., Jiang C., Fu L., et al. CHL1suppresses tumor growth and metastasis in nasopharyngeal carcinoma by repressing Pi3k/Akt signaling pathway via interaction with Integrin Β1 and Merlin. International Journal of Biological Sciences. 2019;15(9):1802–1815. doi: 10.7150/ijbs.34785. [DOI] [PMC free article] [PubMed] [Google Scholar]
- 34.Xu M., Tian G. L., Hao C. C., Shi M., Zha D. J., Liang K. Microrna-29 targets FGF2 and inhibits the proliferation, migration and invasion of nasopharyngeal carcinoma cells via Pi3k/Akt signaling pathway. European Review for Medical and Pharmacological Sciences. 2019;23(12):5215–5222. doi: 10.26355/eurrev_201906_18186. [DOI] [PubMed] [Google Scholar]
- 35.Barker H. E., Paget J. T. E., Khan A. A., Harrington K. J. The tumour microenvironment after radiotherapy: mechanisms of resistance and recurrence. Nature Reviews Cancer. 2015;15(7):409–425. doi: 10.1038/nrc3958. [DOI] [PMC free article] [PubMed] [Google Scholar]
- 36.Kordbacheh T., Honeychurch J., Blackhall F., Faivre-Finn C., Illidge T. Radiotherapy and anti-Pd-1/Pd-L1 combinations in lung cancer: building better translational research platforms. Annals of Oncology. 2018;29(2):301–310. doi: 10.1093/annonc/mdx790. [DOI] [PubMed] [Google Scholar]
- 37.Weichselbaum R. R., Liang H., Deng L., Fu Y. X. Radiotherapy and immunotherapy: a beneficial liaison? Nature Reviews Clinical Oncology. 2017;14(6):365–379. doi: 10.1038/nrclinonc.2016.211. [DOI] [PubMed] [Google Scholar]
Associated Data
This section collects any data citations, data availability statements, or supplementary materials included in this article.
Supplementary Materials
DEGs between the sensitive and resistant groups. GO and KEGG pathway enrichment analyses. Protein-protein interaction (PPI) network integration.
Data Availability Statement
The data used to support the findings of this study are available from the corresponding author upon request.