

Abstract
Trauma brain injury (TBI) is the most common cause of death and disability in young adults. A method to determine the probability of survival (Ps) in trauma called iterative random comparison classification (IRCC) was developed and its performance was evaluated in TBI. IRCC operates by iteratively comparing the test case with randomly chosen subgroups of cases from a database of known outcomes (survivors and not survivors) and determines the overall percentage match. The performance of IRCC to determine Ps in TBI was compared with two existing methods. One was Ps14 that uses regression and the other was predictive statistical diagnosis (PSD) that is based on Bayesian statistic. The TBI database contained 4124 adult cases (mean age 67.9 years, standard deviation 21.6) of which 3553 (86.2%) were survivors and 571 (13.8%) were not survivors. IRCC determined Ps for the survivors and not survivors with an accuracy of 79.0 and 71.4%, respectively, while the corresponding values for Ps14 were 97.4% (survivors) and 40.2% (not survivors) and for PSD were 90.8% (survivors) and 50% (not survivors). IRCC could be valuable for determining Ps in TBI and with a suitable database in other traumas.
Keywords: Bayes methods, iterative methods, medical image processing, statistical analysis, brain, biomechanics, computerised tomography, injuries, neurophysiology, diseases, regression analysis, paediatrics
Keywords: iterative random comparison classification, trauma brain injury, young adults, IRCC, survivors, Ps14, TBI database, traumatic brain injury probability, survival assessment, adult cases
1. Introduction
Traumatic brain injury (TBI) can be defined as temporary or permanent impaired brain function or other evidence of brain injury caused by an external mechanical force, such as penetration by a projectile, blast waves, raid acceleration or deceleration impact [1]. It is the most common cause of death and disability in young adults in the developed world, with the UK head injury being around 1.4 million cases per year alone [2]. From the pathophysiology view, TBI is associated with a continuum of primary and secondary injury processes. Primary injury is characterised by irreversible structural damage sustained at the time of the impact (e.g. contusion or shearing) whereas the secondary injury processes include metabolic, excitotoxic and inflammatory responses [3, 4].
Knowledge of probability of survival (Ps) is valuable in healthcare as it can provide an indication of the likelihood of the patient surviving a trauma sustained through body injuries. The information can assist in situations such as [5]: (i) triage, i.e. setting priorities to treat patients; (ii) prognostic evaluation, i.e. prediction and management of injury outcomes; and (iii) research and audit management, i.e. comparing patient groups on injury outcomes and examine the effects of treatments.
As part of determining Ps in traumas, anatomical and physiological assessments of the patient's medical condition are carried out. The resulting data are then interpreted and processed in models to determine Ps. The Ps model developed in this study was named iterative random comparison classification (IRCC), its principle and operation are described in the following sections. It analyses the patient's age, respiration rate (RR), pulse (heartbeats) rate (PR), systolic blood pressure (SBP), abbreviated injury scale (AIS) and Glasgow coma score (GCS). An analysis of the relevance of these measures in determining Ps has been reported [6]. RR, PR and SBP are important indicators of medical condition in injuries. Age can be related to mortality in traumas, for example, orthopaedic trauma in older people is associated with mortality that is significantly greater than the young [7]. Sex (male/female) was not included in IRCC as there were differences in conclusions of studies related to its relevance in determining Ps.
There are a number of trauma scoring models, and a comparison of models can be found in studies such as [8]. The AIS, first introduced in 1971, is a widely used anatomical injury severity assessment system [9]. It had several updates and its 1990 version classifies >2000 injury types into nine body regions, consisting of the head, face, neck, abdomen, spine, upper extremities, lower extremities, and external [10]. An injury in AIS is scored in an ordinal scale from 1 (minor injury) to 6 (maximum injury, possibly lethal). The maximum AIS score is used to describe the overall severity in patients with multiple injuries but the approach had been reported to not correlate linearly with a probability of death [11]. The injury severity score (ISS) was introduced to allow anatomical injuries from multiple sites to be combined [12]. ISS has a range of 1–75 and is calculated by grouping the nine AIS described body regions into six (head or neck, face, chest, abdominal or pelvic contents, extremities or pelvic girdle, and external) and then summing the squares of the highest AIS values for three most severely injured body regions [13].
In order to assess the level of consciousness, GCS was introduced by Jennett and Teasdale [14] and since then it has been used in assessing various traumatic injuries including TBI [15, 16]. In GCS, the extent of eye opening, verbal response and motor response are assessed as indicated in Table 1. The GCS is the sum of these three assessments. The eye-opening is related to the arousal mechanism of the brainstem, verbal response assesses the integration of cerebral cortex and brainstem and the motor response is associated with the integrity of cerebral cortex and spinal cord [17]. GCS is between 3 (most severe) and 15 (least severe) when all its three components are considered. When assessing TBI, GCS of 8 or less, represents a significant neurological injury and typically abnormal neuroimaging (e.g. skull fracture, traumatic intracranial haemorrhage, or cerebral contusion) [16, 18]. Scores 9 to 12 represent moderate severity and are associated with prolonged loss of consciousness, abnormal neuroimaging, and neurological deficit [16]. The scores over 12 are associated with a mild TBI. Factors such as hypoxia, hypotension and alcohol intoxication can affect GCS and so the patient should be resuscitated and reversible causes corrected before GCS assessment [2]. The speed for timely measurement of GCS components in emergencies can also be an issue [19].
Table 1.
Glasgow coma scale (GCS) components
| Best motor response (M score) | Best verbal response (V score) | Eye opening (E score) |
|---|---|---|
| moves limb to command (6) | oriented (5) | spontaneous (4) |
| localises to painful stimulus (5) | confused (4) | open to speech (3) |
| withdraws from painful stimulus (4) | inappropriate words (3) | open to pain (2) |
| abnormal flexion response (3) | incomprehensible words (2) | none (1) |
| abnormal extension response (2) | no verbal (1) | — |
| no motor response (1) | — | — |
Another physiological trauma assessment system is called the revised trauma score (RTS). It incorporates GCS, SBP and respiratory rate measures. Its index is determined by summing the results from the values of its three measures and multiplying them by their corresponding weights [20].
2. Methods to determine Ps
There exist a number of methods to determine Ps. A method that uses anatomical and physiological scoring systems to determine Ps for adults sustaining injuries from blunt and penetrating mechanisms is trauma and injury severity score (TRISS) [21]. It combines age, RTS and ISS using
| (1) |
where i = 1 is for blunt mechanism and i = 2 is for penetrating mechanism, is a constant for mechanism i, is the coefficient associated with age and mechanism i, is the coefficient associated with RTS and mechanism i, is the coefficient associated with ISS and mechanism i. RTS is
| (2) |
where is the coefficient associated with RR, is the coefficient associated with SBP, and is the coefficient associated with GCS. TRISS has some limitations that include the effects of calibrating its coefficients in determining Ps [22], variable inter-relationships interactions and strong linear assumptions between the predictor variable and survival outcome [21, 23].
In 2004, the Trauma Audit and Research Network (TARN) [24] proposed a Ps model called Ps04. This model uses age, sex, ISS and GCS and intubation. In 2014, Ps14 model was introduced by incorporating the Charlson Comorbidity Index (CCI) [25] to assess pre-existing medical conditions (PMCs). To predict Ps in Ps14, age, sex, GCS and intubation and PMC parameters are considered by
| (3) |
where e = 2.718282 and b is defined as the linear combination of the regression coefficients and the parameters of the related cases from the database. Ps14 determines the percentage of Ps for a new trauma case by performing a retrospective comparison with trauma cases of similar profile on TARN database. For example, if Ps = 65% then 65 out of 100 survivors in the database matched the test case and 35 cases did not.
In an earlier study, we reported a method of determining Ps based on predictive statistical diagnosis (PSD) [26]. PSD's principle is based on Bayesian statistic which is a well-establish method of data classification. PSD performed better as a whole than Ps14 in determining Ps. The Ps results obtained using PSD, Ps14 and IRCC are compared in Section 5.
3. Methodology
The TBI data used in this study were obtained from TARN. The data were fully anonymised prior to processing to ensure ethics confirmation, and the study had Sheffield Hallam University Ethics approval. A description of the data was provided in an earlier study [26], however, they are summarised here for completeness. TARN provided a subset of their very large database that contained TBI cases. Only adult cases with full information about age, RR, pulse rate (PR), SBP, GCS, AIS, and already calculated Ps14 values were selected for this study. The cases aged <17 years were not included in the study as their injury survival profiles were considered to be significantly different to the adults and thus including them in the same model would have made the interpretation of the results more complex. Furthermore, the number of not surviving children with TBI in the data set was insufficient for setting up an accurate model. All patients in the study had either neuroimaging or autopsy and the findings of these including brain swelling and intracranial bleeding were incorporated in the AIS scores. A summary indicating sex, age and number of the cases included in the study is provided in Table 2.
Table 2.
Information summary for the TBI cases (total 4124) included in the study (SD = standard deviation, S = survivors, NS = not survivors)
| Sex | Age (years) | Injury outcomes | |||
|---|---|---|---|---|---|
| Male | Female | Mean | SD | S | NS |
| 2488 (60.3%) | 1636 (39.7%) | 67.9 | 21.6 | 3553 (86.2%) | 571 (13.8%) |
A calibration set consisting of roughly two-third of randomly selected TBI cases (number = 2676) was created and used to calibrate the IRCC. The remaining cases formed the validation set (number = 1448) and were used to determine IRCC's performance on the cases not included in the calibration set. Given the total number of cases available, this provided a suitable partition to calibrate the IRCC and to validate it on the remaining cases. The age statistics for cases included in the validation set is summarised in Table 3. IRCC was implemented in Matlab© while data analysis was performed using SPSS© statistical package.
Table 3.
Age (in years) statistical summary for cases in the validation set
| Parameter | All subjects (n = 1448) | Survivors (n = 1224) | Not survivors (n = 224) |
|---|---|---|---|
| mean | 68.2 | 66.0 | 80.3 |
| median | 75.1 | 71.6 | 83.7 |
| mode | 87.5 | 87.5 | 85.7 |
| standard deviation | 21.2 | 21.7 | 13.6 |
| variance | 450.7 | 469.5 | 176.1 |
| range | 86.2 | 86.2 | 77.2 |
| minimum | 17.0 | 17.0 | 21.8 |
| maximum | 103.2 | 103.2 | 99.0 |
4. Operation of IRCC
In this section, the principle behind the operation of IRCC is described and method of its implementation is explained.
4.1. IRCC principle
The principle behind the IRCC operation is an iterative comparison of trauma parameters (age, SBP, RR, PR, GCS and AIS) of a case whose Ps is being assessed, against randomly selected subgroups of cases with known outcomes (survivors and not survivors) from the database of trauma cases and determining the percentage match after completion of the required number of iterations. The justification behind IRCC and its operation are explained in more detail in the following parts.
The justification for the manner of IRCC operation is initially provided. Each trauma parameter had significant within-group (survivors and not survivors) variations. This meant that comparing the case being assessed against the complete database of known cases in a single test would not have provided the best prediction for the two possible outcomes. This point is illustrated in Table 4 where trauma parameters of all cases (total 4124) in the database are averaged across 3553 survivors (86.2% of cases) and 571 not survivors (13.8% of cases).
Table 4.
Mean and standard deviation (STD) of trauma parameters for TBI cases (S = survivors, NS = not survivors)
| Parameters | Outcomes | Mean | STD |
|---|---|---|---|
| age (years) | S | 65.75 | 21.96 |
| NS | 81.13 | 12.91 | |
| AIS | S | 4.25 | 0.72 |
| NS | 4.74 | 0.53 | |
| GCS | S | 14.34 | 7.07 |
| NS | 11.16 | 8.49 | |
| systolic blood pressure, mmHg | S | 144.33 | 26.84 |
| NS | 155.90 | 34.01 | |
| respiration rate, bpm | S | 17.72 | 3.72 |
| NS | 18.57 | 5.49 | |
| pulse (heart) rate, bpm | S | 81.30 | 18.18 |
| NS | 84.15 | 21.30 |
The Euclidean distance (ED) between the means of the trauma parameters of survivors and not survivors is
| (4) |
where , , , , , , , , , , and are mean age, AIS, GCS, SBP, RR and PR for survivors and not survivors, respectively. For the values indicated in Table 4, ED = 19.74. However, when the averages for the parameters are considered for randomly selected subgroups (group size = 6, justification for using this size is provided in the next section) are considered, the difference between the survivors and not survivors becomes significantly more prominent. This is illustrated in Table 5 where the averages are shown for three randomly selected subgroups.
Table 5.
Average and standard deviation of trauma parameters for TBI cases for three randomly selected subgroups (A, B and C). Each subgroup consists of six survivors (S) and six not survivors (NS).
| Parameters | S/NS | Subgroup A | Subgroup B | Subgroup C | |||
|---|---|---|---|---|---|---|---|
| Mean | STD | Mean | STD | Mean | STD | ||
| age (years) | S | 79.60 | 8.05 | 46.92 | 21.69 | 43.53 | 26.73 |
| NS | 69.98 | 23.70 | 80.43 | 19.90 | 88.48 | 10.04 | |
| AIS | S | 4.17 | 0.98 | 3.67 | 0.82 | 4.17 | 0.41 |
| NS | 4.50 | 0.84 | 4.83 | 0.41 | 5.00 | 0.00 | |
| GCS | S | 14.67 | 0.52 | 14.17 | 1.60 | 13.50 | 1.64 |
| NS | 9.17 | 5.04 | 12.33 | 2.25 | 8.83 | 5.53 | |
| systolic blood pressure, mmHg | S | 157.83 | 22.35 | 131.17 | 22.87 | 134.17 | 22.99 |
| NS | 141.33 | 21.20 | 185.17 | 32.60 | 168.33 | 32.18 | |
| respiration rate, bpm | S | 21.20 | 2.56 | 18.17 | 3.92 | 17.83 | 2.71 |
| NS | 16.83 | 3.97 | 18.67 | 4.50 | 18.83 | 1.83 | |
| pulse (heart) rate, bpm | S | 85.17 | 23.34 | 76.83 | 19.53 | 81.83 | 24.29 |
| NS | 87.33 | 20.18 | 84.17 | 13.50 | 88.83 | 16.13 | |
The corresponding EDs for the means of the trauma parameters for survivors and not survivors for the three subgroups A, B and C determined from Table 5 are 20.47, 64.01 and 57.10, respectively. The overall mean of these three EDs is 47.19. This shows (47.19 − 19.74)/19.74 × 100 = 139.06% increase in the differentiation of survivors and not survivors.
4.2. IRCC operation
The flowchart shown in Fig. 1 outlines the operation of the IRCC. IRCC relies on iteratively comparing the trauma parameters for the case being examined against randomly selected subgroups of known outcomes (survivors and not survivors) and then determining the overall percentage match. Initially, each trauma parameter was individually normalised between 0 and 1 by using the maximum and minimum values for the parameter. The formula used for this purpose was
| (5) |
Fig. 1.
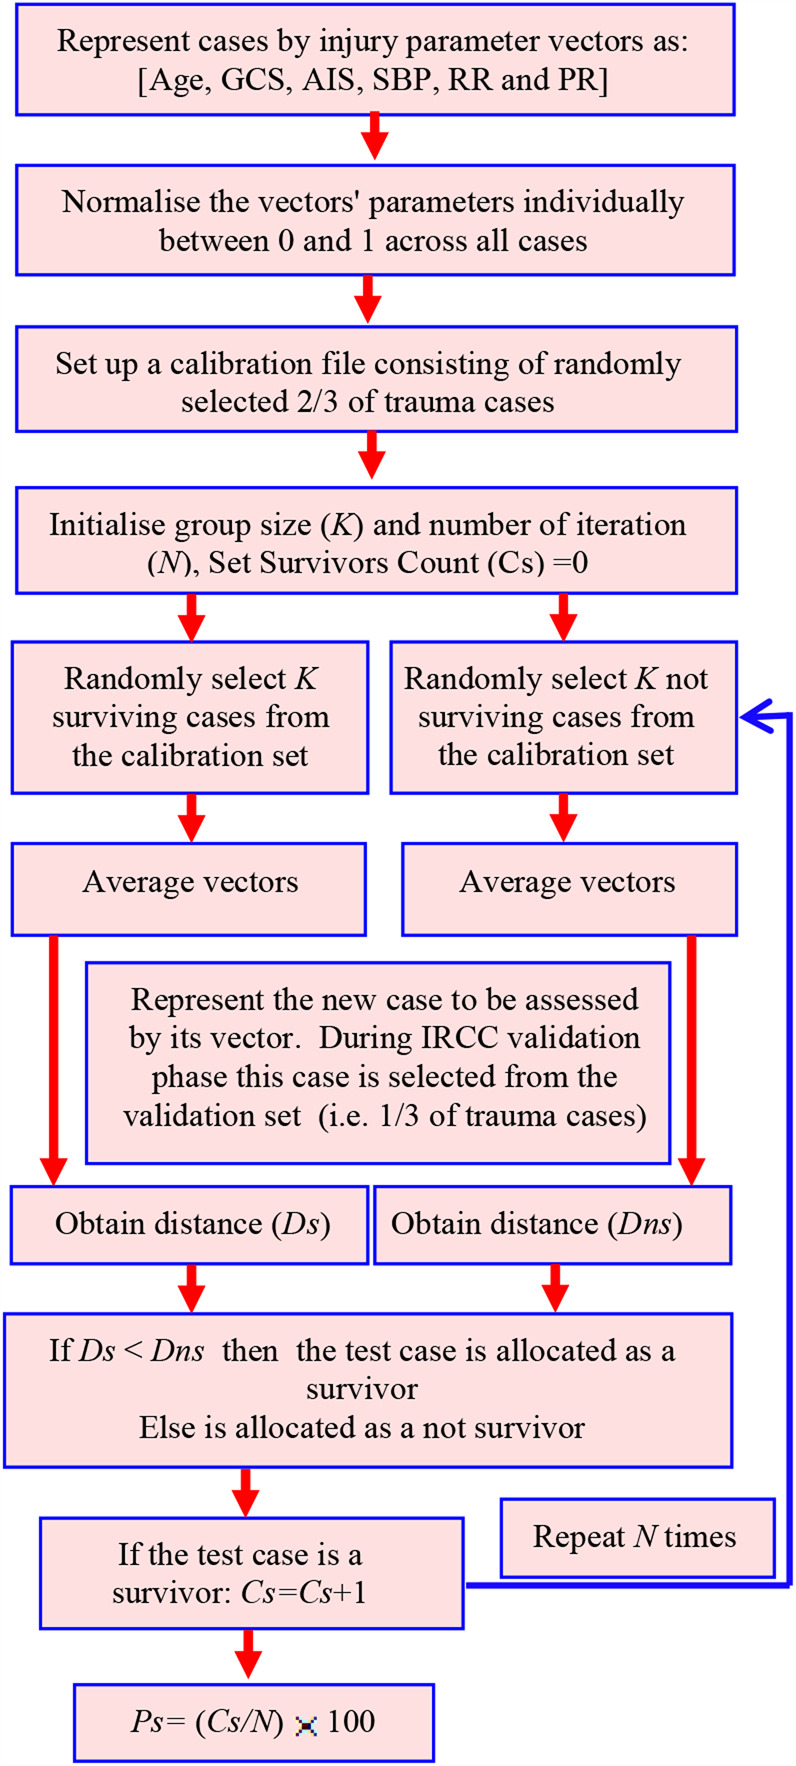
Flowchart of the IRCC operation
This normalisation was performed so that the parameters with a larger range (such as SBP) did not dominate those with smaller ranges (such as AIS) when the IRCC operations were performed. A calibration file consisting of randomly selected two-third of the trauma cases and a test file consisting of the remaining one-third trauma cases were created. The IRCC was initialised by selecting the comparison group size (K) and the desired number of iterations. The survivors' count number (Cs), i.e. number of identified matches between the test case and known survivors, was set to 0. In order to determine the optimum number of iterations and group size, these two parameters were varied in IRCC and its Ps prediction outcomes for survivors and not survivors in the calibration data set were determined as shown in Fig. 2. The results indicated that 50 iterations with group size K = 6 provided the highest Ps predication level and these values were used for the remaining analysis.
Fig. 2.

Plots to determine suitable values for the number of
a Iterations
b Cases in the subgroups (horizontal axes are not linear)
At each iteration, K survivors and K not survivors were randomly selected from the calibration file. The values of their parameters (age, SBP, RR, PR, GCS and AIS) were correspondingly averaged. This led to the averaged parameter vectors
where the subscripts ‘sa’ and ‘na’ represent average values for the injury parameters of the survivors and not survivors, respectively. The vector for the test case was obtained from the validation file. This was represented by
where the subscript ‘t’ signifies a test case. The test case in the development phase is from the validation file to allow the performance of the method to be established but thereafter it could be a case with the unknown outcome (survivor or not survivor) to be assessed. The Euclidian distance (Ds) between the vectors of the test case (Vt) and that for K averaged survivors (Vs) was obtained. Similarly, the Euclidian distance (Dns) between the vectors of the test case (Vt) and that for K averaged not survivors (Vn) was obtained.
The values Ds and Dns were compared and if Ds < Dns then the survivors count (Cs) was incremented by 1. This was repeated for the specified number of iterations (N). The Ps (as percentage) is calculated by
| (6) |
5. Results and discussion
Table 6 provides the results for determining %Ps for cases included in the validation set. The results obtained using IRCC were compared to those from Ps14 (which were already available from the provided TARN database) and PSD (which were determined in an earlier study [26]). Ps14 uses a range of 0–100 to represent %Ps, with a value higher than 50 considered as a survivor, otherwise a not survivor. For consistency with Ps14, we have used the same representation in expressing Ps.
Table 6.
Comparison of IRCC performance accuracy in determining Ps against Ps14 and PSD. Cases used were from the validation set consisting of 1224 survivors (S) and 224 not survivors (NS)
| Parameter | Ps14 | PSD | IRCC | |||
|---|---|---|---|---|---|---|
| Outcome | S | NS | S | NS | S | NS |
| %Ps | 97.4% | 40.2% | 90.8% | 50.0% | 79. 0% | 71.4% |
| average overall accuracy | (90.4 + 40.2)/2 = 68.8% | (90.8 + 50.0)/2 = 70.4% | (79.0 + 71.2) = 75.2% | |||
The accuracy (percentage of correctly identified) for determining Ps for IRCC was 79.0% for survivors and 71.4% for not survivors. Compared to Ps14, there is a reduction of 18.4% for survivors’ prediction but an increase of 31.2% for not survivors. Comparing IRCC with PSD there is a reduction of 11.4% for survivors’ prediction but an increase of 21.4% for not survivors’ prediction. Although IRCC shows a reduction in identification accuracy for survivors as compared with Ps14 and PSD, it shows the highest overall accuracy and a large increase in accuracy for detecting not survivors.
The imbalance between the number of survivors and not survivors in the calibration data set may have affected IRCC performance. Overall there were 3553 survivors and 571 not survivors. As two-third of the cases were included in the calibration file, the numbers for survivors and not survivors in that file were 2369 and 381, respectively. This indicates for every not survivor there are about six survivors. There may be other factors influencing the accuracy of IRCC in correctly determining Ps. For example, the current version of IRCC does not use any weighting for its trauma measures. It is possible that the trauma measures had unequal significance in determining Ps and thus weighting them accordingly would have improved its performance.
In order to establish the consistency of IRCC in determining Ps, the complete data set of TBI cases were randomly partitioned to the calibration and validation sets three times and the IRCC's performance were re-tested on the revised calibration and validation data sets. Each time, two-third of the cases were included in the calibration file and one-third in the test file. The associated results are provided in Table 7. The average (across the three tests) accuracy for IRCC's in determining Ps was 76.5% for survivors and 71.5% for not survivors. These values are comparable to the IRCC results in Table 6, confirming that although there are small variations in performance across the tests, IRCC's overall performance remains consistently better than Ps14 and PSD.
Table 7.
IRCC prediction accuracy for determining Ps based on different random validation cases extracted from the same data set
| Test number | IRCC performance: (%accuracy) | |
|---|---|---|
| Survivor | Not survivor | |
| i | 79. 0 | 71.4 |
| ii | 72.3 | 73.2 |
| iii | 78.3 | 70.0 |
| Mean | 76.5 | 71.5 |
The purpose of this study was not to explore the strength and weaknesses of Ps14, but instead to present a new method of determining Ps. Ps14 was used as the main method for comparison with IRCC as it is a known and well-established method and its values were already available to us as part of the TARN data set. More recently an amended version of Ps14 called Ps17 has been reported that uses recalculated coefficients as detailed from the TARN site [24]. An augmented version of Ps14 called Ps14n has also been reported that incorporates pupillary reactivity due to its prognostic importance in head injury [27]. These, however, do not invalidate our study as IRCC operates independently to other methods. In future, it would be valuable to compare IRCC with Ps17 and Ps14n. There are factors that may further improve the performance of IRCC. These include a greater balance between the number of not survivors and survivors in the calibration data set. As the selection of cases in the calibration set was random, it is possible that the same not surviving case may have been chosen multiple times from the set in the same test. The likelihood of this occurring for the survivors is less as they formed a much higher population.
Age, RR, PR, SBP, AIS and GCS were used in this study as they are well-established parameters for examining TBI and studies including ours [6] indicated their effectiveness. AIS takes account of the findings of imaging (Computerised Tomography (CT) and Magnetic Resonance Imaging (MRI)). So it is not just physiology but the severity of anatomical injury (AIS) and host vulnerability (age) that have contributed to the model. Sex was not used as part of IRCC input but its effect on IRCC performance could be explored in future.
ED was used for determining similarity in this study as it is a commonly used measure, easy to compute and works well with data sets with compact clusters. There are, however, numerous other possible distance measures [28]. These include Mahalanobis, Chord, Manhattan, average distance, cosine measure, Czekanowski coefficient, Canberra metric and Pearson coefficient. In this study, the effectiveness of other distance measures were not examined but it could be valuable to evaluate them in future studies.
AIS is a measure of the severity of TBI. The emergency department arrival GCS is considered a good prognostic measure for TBI also [29]. Change over time is also prognostic but is usually not available in registry databases. The extent IRCC could correctly predict Ps for mild to severe TBI cases was not explored in this study. This was because partitioning the non-survivors would have resulted in a relatively small number of cases in the subgroups that in turn would have negatively affected the method's accuracy. With a larger number of non-survivors this would be valuable to perform.
IRCC as compared with PSD and Ps14 has higher accuracy in predicting non-survivors but a lower accuracy in predicting survivors. Both sensitivity and specificity are important when determining Ps. False negative predictions that a patient will die when in fact could survive (resulting in poor sensitivity) is an important consideration because it relates to a direct waste of life. On other hand, false positive (resulting in poor specificity) may result in trying too hard in a hopeless situation where resources could be better focused on other patients.
An advantage of IRCC is the ease of implementation. Although TBI was considered in this study IRCC is adaptable to other traumas.
6. Conclusion
In this study, a new method called IRCC was developed to determine the Ps in TBIs. The method compared the case being assessed with randomly selected subgroups of cases with known outcomes (survivors and not survivors) and through a number of iterations, it determined the percentage match. The performance of IRCC was compared with two methods of determining Ps called Ps14 and a method that uses Bayesian statistics (called predictive statistical diagnosis, PSD). The averaged prediction of IRCC for survivors and non-survivors was higher than those provided by Ps14 and PSD. IRCC provided a higher prediction accuracy for non-survivors while PSD and Ps14 gave a higher prediction accuracy for survivors. IRCC could be a useful tool for determining Ps and has a number of positive features that include ease of implementation. Its performance may be further improved by using a larger number of non-survivors in its calibration data set.
7. Acknowledgments
The authors are grateful for the ongoing support TARN provided for the study by allowing access to their trauma injury database and for the very valuable discussions. In particular, the authors are very grateful to Antoinette Edwards (Executive Director), Maralyn Woodford (Director of Strategy), Gemma Reed (Executive Assistant) and Phil Hammond (Injury Coding Supervisor) for their great assistance. The authors declare no conflict of interest.
8 References
- 1.Escobedo L.V.S., Habboushe J., Kaafarani H., et al. : ‘Traumatic brain injury: a case-based review’, World. J. Emerg. Med., 2013, 4, pp. 252–259 (doi: 10.5847/wjem.j.issn.1920-8642.2013.04.002) [DOI] [PMC free article] [PubMed] [Google Scholar]
- 2.Dinsmore J.: ‘Traumatic brain injury: an evidenced-based review of management’, Contin. Educ. Anaesthesia, Critical Care & Pain, 2013, 13, (6), pp. 189–195 (doi: 10.1093/bjaceaccp/mkt010) [Google Scholar]
- 3.McGinn M.J., Povlishock J.T.: ‘Pathophysiology of traumatic brain injury’, Neurosurg. Clin. N Am., 2016, 27, pp. 397–407 (doi: 10.1016/j.nec.2016.06.002) [DOI] [PubMed] [Google Scholar]
- 4.Puntis M., Smith M.: ‘Critical care management of adult traumatic brain injury’, Anaesthesia and Intensive Care Medicine, Elsevier, 2017, 18, (5), pp. 233–238 (doi: 10.1016/j.mpaic.2017.02.008) [Google Scholar]
- 5.Fani-Salek M.H., Totten V.Y., Terezakis S.A.: ‘Trauma scoring systems explained’, Emerg. Med., 1999, 11, (3), pp. 155–166 (doi: 10.1046/j.1442-2026.1999.00039.x) [Google Scholar]
- 6.Saleh M., Saatchi R., Burke D.: ‘Analysis of the influence of trauma injury factors on the probability of survival’, Int. J. Biol. Biomed. Eng., 2017, 11, pp. 88–96 [Google Scholar]
- 7.Herron J., Hutchinson R., Lecky F., et al. : ‘The impact of major orthopaedic trauma: an analysis of the United Kingdom Trauma audit research network database’, Bone Joint J., 2017, 99-B, (12), pp. 1677–1680 (doi: 10.1302/0301-620X.99B12.BJJ-2016-1140.R2) [DOI] [PubMed] [Google Scholar]
- 8.Dillon D., Wang W., Bouamra O.: ‘A comparison study of the injury score models’, Eur. J. Trauma, 2006, 6, pp. 538–547 (doi: 10.1007/s00068-006-5102-9) [Google Scholar]
- 9.Gennarelli T.A., Wodzin E.: ‘AIS 2005: a contemporary injury scale’, Injury, 2006, 37, pp. 1083–1091 (doi: 10.1016/j.injury.2006.07.009) [DOI] [PubMed] [Google Scholar]
- 10.Stevenson M., Segui-Gomez M., Lescohier I., et al. : ‘An overview of the injury severity score and the new injury severity score’, Inj. Prev., 2001, 7, pp. 10–13 (doi: 10.1136/ip.7.1.10) [DOI] [PMC free article] [PubMed] [Google Scholar]
- 11.Wisner D.H.: ‘History and current status of trauma scoring systems’, Arch. Surg., 1992, 127, pp. 111–117 (doi: 10.1001/archsurg.1992.01420010133022) [DOI] [PubMed] [Google Scholar]
- 12.Baker S.P., O'Neill B., Haddon W., et al. : ‘The injury severity score: a method for describing patients with multiple injuries and evaluating emergency care’, J. Trauma, 1974, 14, pp. 187–196 (doi: 10.1097/00005373-197403000-00001) [PubMed] [Google Scholar]
- 13.Stoner H.B., Barton R.N., Little R.A., et al. : ‘Measuring the severity of injury’, Br. Med. J., 1977, 2, pp. 1247–1249 (doi: 10.1136/bmj.2.6097.1247) [DOI] [PMC free article] [PubMed] [Google Scholar]
- 14.Jennett B., Teasdale G.: ‘Aspects of coma after severe head injury’, Lancet, 1977, 1, pp. 878–881 (doi: 10.1016/S0140-6736(77)91201-6) [DOI] [PubMed] [Google Scholar]
- 15.Chung P., Khan F.: ‘Traumatic brain injury (TBI): overview of diagnosis and treatment’, J Neurol Neurolphysiol., 2013, 5, pp. 182–192 [Google Scholar]
- 16.Marshall M.S., Riechers R.G.: ‘Diagnosis and management of moderate and severe traumatic brain injury sustained in combat’, Mil. Med., 2012, 177, pp. 76–85 (doi: 10.7205/MILMED-D-12-00142) [DOI] [PubMed] [Google Scholar]
- 17.Zuercher M., Ummenhofer W., Baltussen A., et al. : ‘The use of Glasgow Coma scale in injury assessment: a critical review’, Brain Inj., 2009, 23, pp. 371–384 (doi: 10.1080/02699050902926267) [DOI] [PubMed] [Google Scholar]
- 18.Geocadin R.: ‘Traumatic brain injury’, In Bhardwaj A., Mirski M., Ulatowski J., Totowa N.J. (Eds): ‘Handbook of neuro critical care' (Humana Press, New York, NY, USA, 2004), pp. 73–89 [Google Scholar]
- 19.Lesko M.M., Jenks T., O'Brian S.J., et al. : ‘Comparing model performance for survival prediction using total Glasgow coma scale and its components in traumatic brain injury’, J. Neurotrauma, 2013, 30, pp. 17–22 (doi: 10.1089/neu.2012.2438) [DOI] [PubMed] [Google Scholar]
- 20.Champion H.R., Sacco W.J., Copes W.S., et al. : ‘Revision of the trauma score’, J. Trauma, 1989, 29, pp. 623–629 (doi: 10.1097/00005373-198905000-00017) [DOI] [PubMed] [Google Scholar]
- 21.Schluter P.J.: ‘The trauma and injury severity score (TRISS) revised’, Injury, 2011, 42, pp. 90–96 (doi: 10.1016/j.injury.2010.08.040) [DOI] [PubMed] [Google Scholar]
- 22.Domingues C.A., Nogueira L.S., Settervall C.H.S., et al. : ‘Performance of trauma and injury severity score (TRISS) adjustments: an integrative review’, Rev. Esc. Enferm. USP, 2015, 49, pp. 138–146 (doi: 10.1590/S0080-623420150000700020) [DOI] [PubMed] [Google Scholar]
- 23.Siritongtaworn P., Opasanon S.: ‘The use of trauma score-injury severity score (TRISS) at Siriraj Hospital: how accurate is it?’, J. Med. Assoc. Thail., 2009, 92, pp. 1016–1021 [PubMed] [Google Scholar]
- 24.TARN, Trauma Audit and Research Network (TARN): ‘The TARN Probability of Survival Model’. Available at https://www.tarn.ac.uk/Content.aspx?ca=4&c=3515 accessed 03 May 2019
- 25.Charlson M.E., Charlson R.E., Peterson J.C., et al. : ‘The Charlson comorbidity index is adapted to predict costs of chronic disease in primary care patients’, J. Clin. Epidemiol., 2008, 6, pp. 1234–1240 (doi: 10.1016/j.jclinepi.2008.01.006) [DOI] [PubMed] [Google Scholar]
- 26.Saleh M., Saatchi R., Lecky F., et al. : ‘Predictive statistical diagnosis to determine the probability of survival in adult subjects with traumatic brain injury’, Technologies, 2018, 6(2)(41), pp. 1–16. Available at https://www.mdpi.com/2227-7080/6/2/41 [Google Scholar]
- 27.Lawrence T., Helmy A., Bouamra O., et al. : ‘Traumatic brain injury in England and Wales: prospective audit of epidemiology, complications and standardised mortality’, BMJ Open, 2016, 6, (11), pp. 1–8. Available at https://bmjopen.bmj.com/content/6/11/e012197 (doi: 10.1136/bmjopen-2016-012197) [DOI] [PMC free article] [PubMed] [Google Scholar]
- 28.Cha S.H.: ‘Comprehensive survey on distance/similarity measures between probability density functions’, Int. J. Math. Models Methods Appl. Sci., 2007, 4, (1), pp. 300–307 [Google Scholar]
- 29.Osler T., Cook A., Glance L.G., et al. : ‘The differential mortality of glasgow coma score in patients with and without head injury’, Injury, 2016, 47, (9), pp. 1879–1885 (doi: 10.1016/j.injury.2016.04.016) [DOI] [PubMed] [Google Scholar]