

Abstract
The sacrum is a key piece of the vertebrate skeleton, since it connects the caudal region with the presacral region of the vertebral column and the hind limbs through the pelvis. Therefore, understanding its form and function is of great relevance in vertebrate ecomorphology. However, it is striking that morphometric studies that quantify its morphological evolution in relation to function are scarce. The main goal of this study is to investigate the morphological evolution of the sacrum in relation to its function in the mammalian order Carnivora, using three‐dimensional (3D) geometric morphometrics. Principal component analysis under a phylogenetic background indicated that changes in sacrum morphology are mainly focused on the joint areas where it articulates with other parts of the skeleton allowing resistance to stress at these joints caused by increasing muscle loadings. In addition, we demonstrated that sacrum morphology is related to both the length of the tail relativised to the length of the body, and the length of the body relativised to body mass. We conclude that the sacrum in carnivores has evolved in response to the locomotor requirements of the species analysed, but in locomotion, each family has followed alternative morphological solutions to address the same functional demands.
Keywords: 3D geometric morphometrics, Carnivorans, evolution, locomotion, sacrum
The sacrum in carnivores has evolved in response to the locomotor requirements of the species analysed, but in locomotion, each family has followed alternative morphological solutions to address the same functional demands.

1. INTRODUCTION
Traditionally, the mammalian order Carnivora has been used to investigate how natural selection influences the morphology of the craniodental and postcranial skeleton in relation to trophic ecology (e.g. Van Valkenburgh, 1988), habitat (e.g. Lewis, 1997), or locomotor adaptations (e.g. Van Valkenburgh, 1985, 1987; Janis and Wilhelm, 1993; Polly, 2010). Moreover, carnivores have been extensively used to investigate modularity and morphological integration (e.g. Goswami, 2006; Goswami and Polly, 2010; Martín‐Serra et al., 2018; Machado et al., 2018; Randau et al., 2019) and form‐function studies (e.g. Wroe et al., 2005; Christiansen and Wroe, 2007).
Over the years, different adaptations towards a hypercarnivorous (e.g. Van Valkenburgh, 1991; Meachen‐Samuels and Van Valkenburgh, 2009a; Figueirido et al., 2011), herbivorous (e.g. Figueirido et al., 2010; Pérez‐Ramos et al., 2019; van Heteren and Figueirido, 2019; Pérez‐Ramos, 2020) and durophagous (e.g. Palmqvist et al., 2003; Tseng, 2008; Tseng and Wang, 2010; Palmqvist et al., 2011; Figueirido et al., 2013) diets have been revealed in the craniodental skeleton. These adaptations are particularly useful for making dietary inferences for extinct taxa (e.g. Figueirido and Soibelzon, 2010). Similarly, the study of the appendicular skeleton has provided important evidence for understanding the influence of natural selection on long bone morphology related to predatory behaviour (Meachen‐Samuels and Van Valkenburgh, 2009b; Figueirido and Janis, 2011; Janis and Figueirido, 2014), habitat preference (Meloro et al., 2013; Figueirido et al., 2016), or locomotor strategies (e.g. Polly, 2008; Samuels et al., 2013; Figueirido et al., 2015; Panciroli et al., 2017; Dunn et al., 2019). These approaches have allowed the inference of locomotor strategies in a wide array of extinct carnivores (Samuels et al., 2013; Figueirido et al., 2015; Martín‐Serra et al., 2016; Panciroli et al., 2017; Dunn et al., 2019).
Recent studies have shown that different patterns of morphological disparity in the limbs of extant and extinct carnivores are associated with both locomotion and substrate use (Martín‐Serra et al., 2014a; Martín‐Serra et al., 2014b). These studies concluded that the evolutionary pattern of the fore and hind limbs is very similar, and that morphological variation in the long bones can be placed along a continuum from more robust to more gracile morphology. This is most probably because of a biomechanical trade‐off between resisting physical stresses and the energetic efficiency required during locomotion, something that is also seen in domestic dogs (Figueirido, 2018). Accordingly, the evolution of the appendicular skeleton in carnivores follows an evolutionary pattern where one phenotype can perform different locomotory functions (Martín‐Serra et al., 2014b). This lack of direct correlation between morphology and specific locomotion (or substrate use) confounds our ability to determine the locomotion of extinct animals. Interestingly, this pattern contrasts with the close relationship between the craniodental skeleton and diet; it is likely that the strong biomechanical and physical constraints imposed by locomotion limit the range of morphological variation in the appendicular skeleton (Martín‐Serra, 2014b). A recent study on morphological integration in limbs (Martín‐Serra et al., 2015) has allowed the exploration of how morphological integration between the fore and hind limb bones is related to different locomotor strategies such as occurs in cursorial and non‐cursorial species. The results indicate that, the appendicular skeleton is more integrated functionally in cursorial species, suggesting that natural selection has modified the developmental integration patterns (Martín‐Serra et al., 2015). However, a noteworthy exception is the evolution of the pelvic girdle in carnivores, probably because it anchors the most important muscles involved in locomotion and it transmits its movement to the body (Martín‐Serra et al., 2018).
The study of the vertebral column in felids has also given important evidence about how natural selection operates in a skeletal system composed by serially homologous units such as the vertebrae (Randau et al., 2016). Increased in body size in felids appears to involve the stabilisation of the presacral column along with the modification of vertebral shape. On the other hand, the stabilisation of the lumbar region is achieved due to the mass increase of the epiaxial muscles. The ecology of felids heterogeneously influences the shape of the vertebral column, which results in modularisation of the vertebrae beyond traditional regionalisation (Randau and Goswami, 2017; Randau et al., 2017).
To date, studies of the postcranial skeleton in mammalian carnivores have focused on the investigation of the fore and hind limbs, pelvis and vertebral column. Studies addressing how the morphology of the sacrum evolves in relation to the function in carnivores are scarce. Except for some studies on domestic dogs for purely clinical purposes (Breit et al., 2002; Ocal et al., 2006) or to quantify the degree of sexual dimorphism in some species (e.g. the red fox [Vulpes vulpes] and the raccoon dog [Nyctereutes procyonoides]) performed by Jurgelėnas (2015), there are no data on the morphological evolution of the sacrum in carnivores. This is surprising because the sacrum is an element of particular interest in studies of functional morphology and evolution of the vertebrate skeleton; it connects different body regions such as the caudal with the presacral regions of the vertebral column, and the hind limbs to the vertebral column through the pelvis (Figure 1). In this study, we explored the evolution of sacrum morphology in carnivores in relation to its function, using 3D geometric morphometrics. Our hypothesis was that sacrum morphology should be, at least in part, shaped by natural selection to adapt organisms towards their particular locomotor strategies and substrate use, due to its key role in the postcranial skeleton connecting different body regions. To test this hypothesis, here: (a) we investigate whether there is a relationship between sacrum shape and size (allometry); (b) we seek to reveal the main morphological variations and to explore the role of locomotory adaptations in ‘shaping’ sacrum morphology; and (c) we explore how the morphology of the sacrum relates to other ecomorphologically variable features such as tail length and body length.
FIGURE 1.
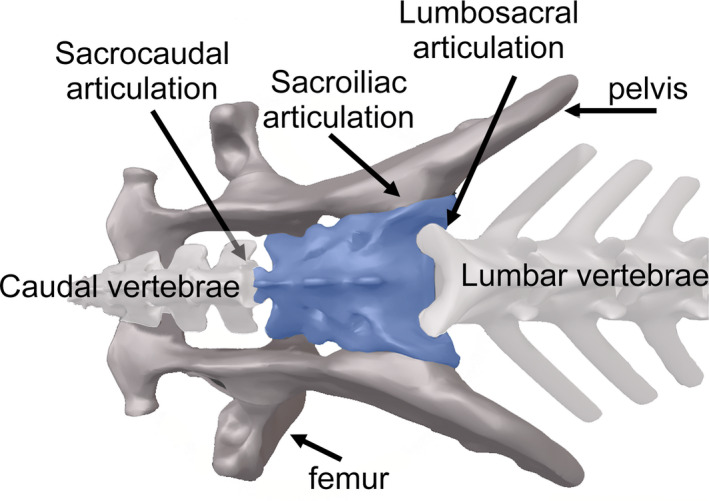
Sacrum connections with different body regions such as the presacral and caudal regions of the vertebral column, as well as with the hind limbs trough the lumbosacral, sacrocaudal and sacroiliac articulations, respectively, in a model of Canis lupus, as an example
2. ANATOMY OF THE CARNIVORAN SACRUM
2.1. Osteology
The sacrum is located between the lumbar and caudal regions of the vertebral column and composed of a variable number of fused vertebrae, ranging between three to five in carnivores (B. Figueirido, personal observation), depending on the species. Moreover, the sacrum participates in the formation of three articulations: the sacroiliac, the lumbosacral and the sacrocaudal (Figure 1). The sacrum is divided into the following set of regions:
Base of sacrum (Figure 2a) is the vertebral body of the first sacral vertebra, and it articulates with the last lumbar, forming the lumbosacral articulation. This area includes different bone portions of particular interest, such as the sacral promontory (i.e. the ventral border of the articular surface) and the two lateral projections identified as the sacral wings or alae (Figure 2c). These wings are fused with the prezygapophysis of the first sacral vertebra in some species (Figure 2c).
Apex of sacrum (Figure 2a) refers to the ventral part of the vertebral body of the last sacral vertebra irrespective of the number of vertebrae.
Sacrum ventral surface (Figure 2a) is the ventral region of the bone with a slightly concave shape. The intermediate (lateral) sacral crests are in this area, which are a consequence of the joining of the different vertebrae that form the sacrum. Moreover, between the two sacral crests, there are always two ventral sacral foramina (Figure 2a), which allow the presence of the sacral nerves and the lateral sacral arteries.
Sacrum dorsal surface (Figure 2c) is the region opposite to the ventral surface, which is longitudinally crossed by the medial sacral crest (Figure 2c).
The medial sacral crest (Figure 2c) is the result of the joining of the different sacral spinous (neural) processes of the vertebrae that compose the sacrum. Therefore, its interior is crossed by the medulla through the sacral canal.
The lateral sacral crests (Figure 2c) are located on both sides of the medial sacral crest, where the dorsal sacral foramina are located. The lateral sacral crests are the result of the fusion of the pre‐ and postzygapophyses of the intermediate sacral vertebrae.
The sacral cornua (Figure 2c) are two bony processes which are the postzygapophyses of the last sacral vertebra, located at the most caudal portion of the lateral sacral crest. Both cornua are separated by the sacral hiatus, which is the intermediate point between both postzygapophyses.
Lateral surface (Figure 2b) are the regions that articulate with the iliac bone forming the sacroiliac articulation. This area is formed by a large ear‐shaped surface called the auricular surface (Figure 2b), and just above this, a coarse area called sacral tuberosity is found (Figure 2b).
FIGURE 2.
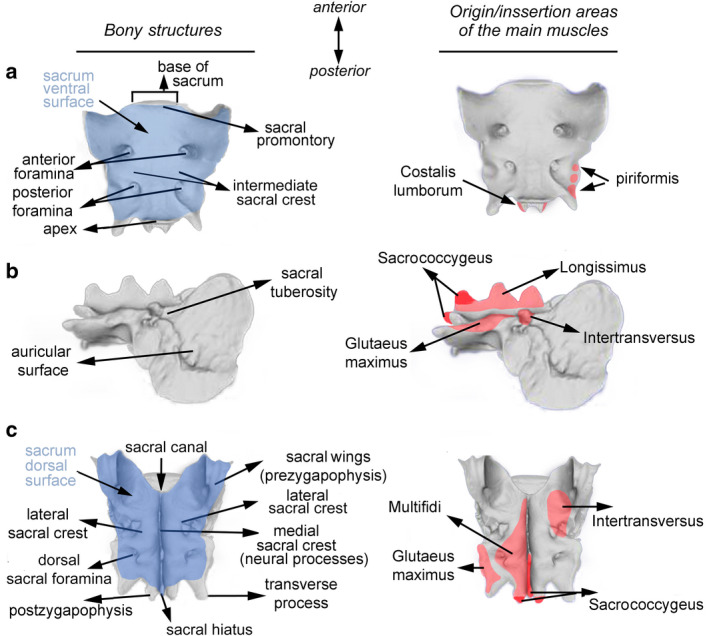
2Anatomy of the carnivoran sacrum represented in a specimen of Canis lupus as an example. Both the skeletal components of the carnivoran sacrum and the insertion areas of the main sacral muscles in ventral (a), lateral (b) and dorsal (c) views are shown
2.2. Myology
The muscles inserted in the sacrum are as follows: the longissimus system, multifidus muscles, intertransverse muscle, piriform muscle, costalis lumborum and gluteus maximus (Figure 2, after Done et al., 2010; Caro‐Munizaga and Concha‐Albornoz, 2014).
The piriform muscle (Figure 2a) is the extensor of the hip articulation and its origin is the latero‐caudal part of the sacrum, it inserts in the greater trochanter of the femur. It acts as an extensor, abductor and rotator of the posterior limb.
The costalis lumborum muscle (Figure 2a) has its origin in the ventral surface of the thoracic vertebrae and the transverse processes of the lumbar vertebrae, and it inserts in the ventral border of the sacral wing and the iliac crest. It acts by fixing the lumbar region of the vertebral column and it extends the lumbar region dorsally.
The longissimus muscle system (Figure 2b) is a prolongation of the sacrocaudal muscles of the thoracic and lumbar regions, where their fasciculi are mostly fused. It is the most important of the epaxial muscles of the vertebral column at an intermediate level along the anterior‐posterior body axis. It runs up the length of the vertebral column, from the sacrum and the ilium to the occipital region. Its most‐caudal point of origin is in the iliac crest, in the pelvic surface of the iliac wing and in the sacral medial crest. The different fasciculi of the muscle originate successively in the vertebral spinous processes. The longissimus muscle system functions as a neck extensor; if it acts unilaterally, it raises the neck obliquely, turning the neck to the side; it also stabilises the neck and extends the vertebral column; if it acts unilaterally, it bends the vertebral column laterally.
The sacrocaudal muscles (Figure 2b) are mostly involved in the tail movement, as they are the posterior prolongation of other muscles associated with the vertebral column (i.e. the longissimus). They are divided into the dorsalis lateralis (extension or elevation), dorsalis medialis (extension or lateral flexion), ventralis lateralis (flexion and lateral movement) and ventralis medialis (flexion and lateral movement). They originate in the spinous process and in the dorsal surface of the postzygapophyses (sacral cornua) of the last sacral vertebra.
The multifidi muscles (Figure 2c) show a segmented disposition, as its numerous fasciculi are inserted on one or two vertebrae, they insert into the mammillary process of the prezygapophyses, or the articular or transverse processes of the fused vertebrae on the lateral crest of the sacrum. They are extended from the sacrum to the second cervical vertebra or axis. The function of these muscles is to stabilise the vertebral column.
The intertransversus muscle (Figure 2b, c) has its origin in the lateral sacral crest and in the transverse processes of the sacral vertebra, its fasciculi decrease progressively until it disappears into the tail. Its function relates to the lateral movement of the tail.
The gluteus maximus muscle (Figure 2b, c) has its origin in the gluteal fascia, in the lateral sacral crest and in the transverse processes of the first caudal vertebrae. It is a hip extensor.
3. MATERIAL AND METHODS
3.1. Sample
The study sample is composed of 3D scanned sacra of 43 species of mammalian carnivores belonging to 12 different families (Table 1; Supplementary Data). Given that the main goal of this study was to investigate the evolution of the sacrum morphology in living carnivores, our sample comprised a wide range of families and ecologies. In an effort to maximize sample size, we used a mixed‐sex sample of a large number of taxa both captive‐ and wild‐reared animals due to the difficulty to find complete spines of the same specimen in collections, as in Lewton et al. (2020). The craniodental and postcranial morphology of captive animals is modified from wild animals (O’Regan and Kitchener, 2005), but captivity does not invalidate interspecific studies contrary to studies based on sexual dimorphism, at least in felids (Hartstone‐Rose et al., 2014). Moreover, although the most common pathologies found in the vertebral column of captive animals are collapsed (or narrowed) disk spaces and disk mineralisation and spondylosis (O’Regan and Kitchener, 2005), this is easily observable in dry vertebrae of very aged animals from the wild too, and they were discarded. Other possible asymmetric changes related to inbreeding were removed mathematically from the specimens (see methods).
TABLE 1.
Species of carnivores analysed in this article. Note that only one specimen per species was analysed
| Species | Family | Abbreviation |
|---|---|---|
| 1. Acinonyx jubatus | Felidae | Ajub |
| 2. Ailuropoda melanoleuca | Ursidae | Amel |
| 3. Ailurus fulgens | Ailuridae | Aful |
| 4. Aonyx cinerea | Mustelidae | Acin |
| 5. Arctictis binturong | Viverridae | Abin |
| 6. Atilax paludinosus | Herpestidae | Apal |
| 7. Canis lupus | Canidae | Clup |
| 8. Caracal caracal | Felidae | Ccar |
| 9. Cuon alpinus | Canidae | Calp |
| 10. Chrysocyon brachyurus | Canidae | Cbra |
| 11. Crocuta crocuta | Hyaenidae | Ccro |
| 12. Cryptoprocta ferox | Eupleridae | Cfer |
| 13. Cynictis penicillata | Herpestidae | Cpen |
| 14. Puma concolor | Felidae | Fcon |
| 15. Felis silvestris | Felidae | Fsil |
| 16.Genetta genetta | Viverridae | Ggen |
| 17.Genetta tigrina | Viverridae | Gtig |
| 18. Herpestes ichneumon | Herpestidae | Hich |
| 19. Hyena hyena | Hyaenidae | Hhye |
| 20. Lycaon pictus | Canidae | Lpic |
| 21. Lutra lutra | Mustelidae | Llut |
| 22. Leptailurus serval | Felidae | Lser |
| 23. Lynx canadensis | Felidae | Lcan |
| 24. Lynx lynx | Felidae | Llyn |
| 25. Meles meles | Mustelidae | Mmel |
| 26. Mustela putorius | Mustelidae | Mput |
| 27. Mustela vison | Mustelidae | Mvis |
| 28. Nasua narica | Procyonidae | Nnas |
| 29. Neofelis nebulosa | Felidae | Nneb |
| 30. Otaria byronia | Otariidae | Obyr |
| 31.Panthera leo | Felidae | Pleo |
| 32. Panthera pardus | Felidae | Ppar |
| 33. Panthera tigris | Felidae | Ptig |
| 34.Paradoxurus hermaphroditus | Viverridae | Pher |
| 35.Phoca vitulina | Phocidae | Pvit |
| 36. Potos flavus | Procyonidae | Pfla |
| 37.Proteles cristatus | Hyaenidae | Pcri |
| 38. Speothos venaticus | Canidae | Sven |
| 39. Suricata suricatta | Herpestidae | Ssur |
| 40. Tremarctos ornatus | Ursidae | Torn |
| 41. Urocyon cinereoargenteus | Canidae | Ucin |
| 42. Ursus arctos | Ursidae | Uarc |
| 43. Ursus maritimus | Ursidae | Umar |
Abbreviation: Abr, species abbreviations.
3.2. Methods
All the sacra analysed were scanned in 3D with a NextEngine surface scanner or using regular computed tomography (CT) scanning. We reduced the resolution of the 3D meshes before the morphometric analyses to a minimal size, but sufficient to preserve all the bony structures and facets that ultimately allow for the digitising of a set of homologous landmarks to perform the morphometric analysis. To do this, we used the software MeshLab (Cignoni et al., 2008).
To recover the sacrum morphology, we digitised 28 homologous landmarks in 3D (Figure 3, Table 2 Supplementary Data) in Landmark software from IDAV (Wiley et al., 2005). These landmarks correspond to meaningful points on the sacrum such as osteological key traits and muscle attachments. The x, y, z coordinates of each landmark were exported into a.txt file for its posterior statistical analysis. Afterwards, these raw coordinates were imported into R environment (R Core Team, 2017) and a Generalised Procrustes analysis (Dryden and Mardia, 1998) was performed using gpagen and bilat.symmetry functions from geomorph package (Adams et al., 2017).
FIGURE 3.

Representation of the 28 landmarks digitised in a sacrum of Canis lupus in dorsal (a), ventral (b), caudal (c), lumbar or anterior (d) and lateral (e, left) views. In (e), it is also shown a latero‐lumbar view (right) for a better explanation of how landmark 19 was digitized. The anatomical criteria followed for landmark digitalisation is in Table 2. Landmarks 20–22 (not shown) of the left side are the symmetric with of 17–19 of the right side, respectively
TABLE 2.
Morphological criteria followed to digitise the 28 homologous landmarks in the carnivoran sacrum
| Landmark | Morphological criteria |
|---|---|
| 1 | Dorsal tip of the of the last sacral vertebra postzygapophysis (left) |
| 2 | Dorsal tip of the of the last sacral vertebra postzygapophysis (right) |
| 3 | Dorsal surface of the lateral crest between the 2nd and 3rd vertebra (left) |
| 4 | Dorsal surface of the lateral crest between the 2nd and 3rd vertebra (right) |
| 5 | Dorsal surface of the lateral crest between the 1st and 2nd vertebra (left) |
| 6 | Dorsal surface of the lateral crest between the 1st and 2nd vertebra (right) |
| 7 | Dorsal tip of the left sacral wing |
| 8 | Dorsal tip of the right sacral wing |
| 9 | Dorsal point of the base |
| 10 | Left point of the base |
| 11 | Ventral point of the base |
| 12 | Right point of the base |
| 13 | Dorsal point of the apex |
| 14 | Left point of the apex |
| 15 | Ventral point of the apex |
| 16 | Right point of the apex |
| 17 | Point of the right lateral surface between the last two vertebrae |
| 18 | Point of the right lateral surface between the 2nd and 3rd vertebrae |
| 19 | Point of the right auricular surface at the level of the dorsal part of the base |
| 20 | Point of the left lateral surface between the last two vertebrae |
| 21 | Point of the left lateral surface between the 2nd and 3rd vertebrae |
| 22 | Point of the left auricular surface at the level of the dorsal part of the base |
| 23 | Most anterodorsal point of the medial crest |
| 24 | Most posterodorsal point of the medial crest |
| 25 | Point between the spinous processes of 1st−2nd vertebrae on the medial crest |
| 26 | Ventral point of the left sacral wing on the pelvic surface |
| 27 | Dorsal point of the left sacral wing on the pelvic surface |
| 28 | Point between the spinous processes of last two vertebrae on the medial crest |
See also Figure 3.
To investigate the phylogenetic influence of the sacrum morphology, as well as to quantify the relationship between its shape and other ecomorphological variables (see below); we built a phylogenetic tree (Figure 4) modified from the study by Nyakatura and Bininda‐Emonds (2012), by removing those species not included in our study using the function drop.tip from the R package ape (Paradis and Schliep, 2019) (Supplementary Data). Branch‐lengths were included in millions of years obtained from the same source. The tree was imported into R as a nexus file to compute the corresponding comparative analyses.
FIGURE 4.

Phylogenetic background and both meristic and morphological variation of the sacrum. (a) Tree topology used in comparative analyses (modified from Nyakatura and Bininda‐Emonds, 2012). (b) the number of sacral vertebrae in each taxa (meristic variation). (c) the lateral and dorsal views of the sacra belonging to one species of each family show morphological variation
To investigate allometric effects, we performed a phylogenetic Procrustes analysis of variance (ANOVA) (procD.pgls function) assessing the covariation of shape and size (Collyer et al., 2015), using the Procrustes coordinates (as a proxy for shape) and the log‐transformed centroid size (Cs) as a proxy for size (Bookstein, 1991). We also extracted the residuals of this regression to explore allometric‐free variation of the sacrum shape using geomorph package (Adams and et al., 2017).
We performed a principal component analysis (PCA) from the covariance matrix of the Procrustes coordinates. Afterwards, we developed a phylomorphospace approach using the phylomorphospace function from phytools package (Sidlauskas, 2008; Revell, 2012). This was to show the phylogenetic filling of the sacrum morphospace defined by those eigenvectors that explain the larger amount of the original variance. To do this, we inferred the ancestral states of the phylogeny (or internal node values) for each eigenvector with a method based on parsimony (squared‐changed parsimony) published by Maddison (1991). Later, the values of the internal nodes were represented in the morphospaces and the branches of the phylogeny (Figure 4). The PCA was also repeated using the allometric‐free residuals obtained previously.
We investigated the role of the ecology in shaping sacrum morphology using a set of phylogenetic Procrustes ANOVA (Collyer et al., 2015), assessing the covariation of the shape with the size, and a set of ecomorphological variables (i.e. ratios between the tail length and body length [rTL] and between the body length and body mass [rBL]), averaging for maximum and minimum values (Table 3), and taking the phylogenetic relationships of the species into account. Moreover, we also tested the association between sacrum shape and the locomotor strategies used by the species sampled. Accordingly, we classified the species into different ecological categories (i.e. cursorial, terrestrial, arboreal and aquatic) modified from Samuels et al. (2013) classification (Table 3). Therefore, while Samuels et al. (2013) used seven locomotory categories, we have unified the semi‐aquatic plus fully aquatic and the semi‐arboreal (scansorial) plus the fully arboreal into more coarse categories of taxa, which are characterized as having the ability to spend time in water or in trees, respectively. Moreover, we also considered the semi‐fossorial taxa just as terrestrial. Our decision to join categories is that our sample size is much smaller compared with Samuels et al. (2013) data.
TABLE 3.
Values of body mass, tail length and body length for the species gathered in this study
| Species | Locomotor behaviour | Tail length (mm) | Body length (mm) | Body mass (kg) |
|---|---|---|---|---|
| A. jubatus | Cursorial | 69.5 [63–76] | 133 [121–145] | 47.5 [36–59] |
| A. melanoleuca | Terrestrial | 13 [10–16] | 150 [120–180] | 97.5 [70–125] |
| A. fulgens | Arboreal | 38.5 [28–49] | 62 [51–73] | 4.5 [3–6] |
| A. cinerea a | Aquatic | 25 [22.5–27.5] | 41.4 [36–46.8] | 3.1 [2.4–3.8] |
| A. binturong | Arboreal | 67 [50–84] | 78.75 [61–96.5] | 14.5 [9–20] |
| A. paludinosus a | Aquatic | 36 [31–41] | 50.05 [51.4–48.7] | 3.25 [2.4–4.1] |
| C. lupus | Cursorial | 43.5 [35–52] | 108.5 [87–130] | 49 [18–80] |
| C. caracal | Terrestrial | 26.75 [19.5–34] | 83.35 [61–105.7] | 13.1 [6.2–20] |
| C. alpinus | Cursorial | 41 [32–50] | 111.75 [88–135.5] | 15 [10–20] |
| C. brachyurus | Cursorial | 44 [38–50] | 105 [95–115] | 25.25 [20.5–30] |
| C. crocuta | Cursorial | 24.5 [22–27] | 142.5 [125–160] | 50 [45–55] |
| C. ferox | Arboreal | 67.5 [65–70] | 79.5 [79–80] | 7.05 [5.5–8.6] |
| C. penicillata | Terrestrial | 22.1 [15–29.2] | 36.25 [26.5–46] | 0.8075 [0.72–0.9] |
| P. concolor b | Arboreal | 78.5 [60–97] | 120.5 [86–155] | 53 [34–72] |
| F. silvestris b | Arboreal | 29.15 [25.7–32.6] | 56.4 [47.3–65.5] | 4.805 [2.35–7.26] |
| G. genetta b | Arboreal | 45.8 [40–51.6] | 49.25 [46.5–52] | 2 [1.4–2.6] |
| G. tigrina b | Arboreal | 42.2 [38.5–45.9] | 50.35 [42.7–58] | 1.75 [1.4–2.1] |
| H. ichneumon | Terrestrial | 52.25 [43.5–61] | 55.5 [50–61] | 3.15 [2.2–4.1] |
| H. hyena | Cursorial | 35 [30–40] | 107.5 [100–115] | 33.5 [26–41] |
| L. pictus | Cursorial | 36.5 [31–42] | 112.75 [84.5–141] | 26.25 [18–34.5] |
| L. lutra a | Aquatic | 41.5 [33–50] | 66 [50–82] | 9.5 [5–14] |
| L. serval | Terrestrial | 29 [20–38] | 75.5 [59–92] | 10.25 [7–13.5] |
| L. canadensis | Terrestrial | 8.85 [5–12.7] | 91.45 [76.2–106.7] | 11.15 [5–17.3] |
| L. lynx | Terrestrial | 19.5 [16–23] | 95 [80–110] | 22 [15–29] |
| M. meles | Terrestrial | 15.85 [11.5–20.2] | 73 [56–90] | 13 [10–16] |
| M. putorius | Terrestrial | 13 [7–19] | 33.25 [20.5–46] | 1.0585 [0.4–1.72] |
| M. vison a | Aquatic | 17.6 [15.2–20] | 36.5 [30–43] | 3.1525 [4.5–1.81] |
| N. narica b | Arboreal | 55 [42–68] | 55.5 [43–68] | 4.55 [3.5–5.6] |
| N. nebulosa | Arboreal | 87.65 [68.6–106.7] | 72.6 [61–84.2] | 17 [11–23] |
| O. byronia | Aquatic | 0 | 2300 [2200–2800] | 247 [144–350] |
| P. leo | Terrestrial | 80.5 [61–100] | 204 [158–250] | 173.5 [122–225] |
| P. pardus b | Arboreal | 81.5 [64–99] | 141 [92–190] | 46 [21–71] |
| P. tigris | Terrestrial | 90.5 [72–109] | 218 [146–290] | 200 [75–325] |
| P. hermaphroditus | Arboreal | 49.5 [33–66] | 56.5 [42–71] | 3.5 [2–5] |
| P. vitulina | Aquatic | 0 | 1850 | 92.5 [55–130] |
| P. flavus | Arboreal | 48 [39–57] | 59 [42–76] | 2.95 [1.4–4.5] |
| P. cristatus | Terrestrial | 25 [20–30] | 67.5 [55–80] | 10 [8–12] |
| S. venaticus | Terrestrial | 13.75 [12.5–15] | 66.25 [57.5–75] | 6.5 [5–8] |
| S. suricatta | Terrestrial | 21.5 [19–24] | 26.75 [24.5–29] | 7.945 [6.2–9.69] |
| T. ornatus b | Arboreal | 10 [10–10] | 160 [130–190] | 117.5 [60–175] |
| U. cinereoargenteus b | Arboreal | 36.15 [28–44.3] | 60 [54–66] | 3.25 [2.5–4] |
| U. arctos | Terrestrial | 13.5 [6–21] | 215 [150–280] | 315 [80–550] |
| U. maritimus a | Terrestrial | 9.5 [6–13] | 230 [180–280] | 400 150–650] |
Values are the average of the largest and smallest value recorded for each species (between square brackets). Data obtained from Wilson and Mittermeier (2009). The ecomorphological categories are modified from Samuels et al. (2013), as follows:
Semi‐aquatic taxa but considered as aquatic in ecomorphological analyses (see text for details).
Scansorial taxa but considered as areboreal in ecomorphological analyses (see text for details).
4. RESULTS
4.1. Allometric relationship
The relationship between the logarithm of Cs (a proxy for sacrum size) and the Procrustes coordinates (a proxy for sacrum shape) was significant (Table 4). This result indicates that the morphology of the sacrum reflects allometric effects. In general terms, the sacrum of those taxa with low values of Log‐Cs is short and wide, while the sacrum of those taxa with high values of Log‐Cs is long and narrow. Nonetheless, the bivariate representation (Figure 5) of Procrustes coordinates (y axis) against the logarithm of Cs (x axis) revealed that the significant relationship between both variables was strongly dominated by the ursids and pinnipeds (positive extreme of the x axis). In fact, the association between the Procrustes coordinates and the logarithm of Cs excluding Ursidae, as well as Phocidae and Otariidae species was not significant (p < 0.08; Table 4). Therefore, here, we present the results performed on the Procrustes coordinates without correcting for allometric effects, as we think that the significant association found between sacrum shape and size is biased by those large species with sacra composed by >3 sacral vertebrae (see Figure 4).
TABLE 4.
Results obtained from the phylogenetic Procrustes ANOVA to test the association between sacrum shape (Procrustes coordinates) and size (Centroid size) in the 43 species analysed
| Df | SS | MS | Rsq | F | Z | Pr(>F) | |
|---|---|---|---|---|---|---|---|
| All sample | |||||||
| log(X) | 1 | 0.005225 | 0.005225 | 0.07087 | 3.1271 | 2.748 | 0.003 |
| Residuals | 41 | 0.068506 | 0.0016709 | 0.92913 | |||
| Total | 42 | 0.073731 | |||||
| Sample excluding ursids and phocids + otarids | |||||||
| log(X) | 1 | 0.002496 | 0.0024965 | 0.04358 | 1.5947 | 1.3478 | 0.096 |
| Residuals | 35 | 0.054791 | 0.0015655 | 0.95642 | |||
| Total | 36 | 0.057288 | |||||
The result of the same analysis but excluding the ursids, phocids and otarids is also shown.
Abbreviations: ANOVA, analysis of variance; Df, degrees of freedom; F, F‐statistics; MS, mean squares; Pr(<F), P‐value obtained from permutation; Rsq, r‐square; SS, sum of squares; Z, z‐score.
FIGURE 5.

Multivariate regression analysis between sacrum shape and the centroid logarithm. Note that the regression is strongly influenced by the presence of ursids and pinnipeds (specimens with a logarithmic centroid size higher than 5.4)
4.2. Principal components analysis
Figure 6a shows the phylomorphospace depicted from the scores of all species, as well as the hypothetical sacra shapes corresponding to the internal nodes of the phylogeny (ancestral states) on the first two principal components (PCs or eigenvectors). Figure 6b represents the morphological change accounted for by both eigenvectors. Accordingly, the first PC (PC1; 48% of the original variance) separated the canids (especially the grey fox, U. cinereoargenteus) and hyaenids, with positive scores, from the ursids, phocids and otarids with negative scores (Figure 6a) according with a set of morphological traits (Figure 6b). The specimens belonging to other families were plotted in an intermediate position of the morphospace. The second PC (PC2, 15.6% of the original variance; Figure 6a) separates ursids and canids with positive scores from the rest of the species, and more particularly from viverrids, euplerids and some mustelids, scoring negatively on this eigenvector. The main morphological changes accounted for by this eigenvector are shown in Figure 6b.
FIGURE 6.

6Results of the principal components analyses performed on the morphometric data of the sacrum. (a) Scatter plot illustrating the position of different species on the first two principal components. The phylogeny from Nyakatura and Bininda‐Emonds (2012) is plotted in the morphological space. Arrows indicate outliers within locomotor groupings. The convex hull of the terrestrial category is not represented as terrestrial taxa is not grouped. (b) Main phenotypic variation corresponding to the minimum and maximum of the two first PCs. The 3D model of the sacrum used in the morphing of the shape changes accounted for by each PC correspond to C.lupus
4.3. Sacrum shape, body length and tail length
The results of the Procrustes ANOVA performed to test the association between sacrum shape, rTL and rBL of the species sampled (Figure 7) are shown in Table 5. The results obtained indicate that rTL was significantly associated with both sacrum shape and Cs, even when the phylogenetic relationships of the species were considered (Figure 8). In contrast, sacrum shape was not associated with rBL when the phylogenetic relationships of the species were considered. However, the non‐phylogenetic Procrustes ANOVA revealed a significant relationship between sacrum shape and rBL (Table 5). This indicates that rBL should be highly influenced by phylogeny.
FIGURE 7.

Box plot showing the tail length relativized to body length and the body length relativized to body mass in the different locomotory categories included in our sample. For the raw values of tail length, body length and body mass, see Table 3. The vertical line inside each box is the median. Box length is the interquartile range (IQR) and shows the difference between the 75th and 25th percentiles. Horizontal bars enclose values of 5–95%
TABLE 5.
Results obtained from the Procrustes ANOVA to test the association between sacrum shape (Procrustes coordinates) and Relative Body length (rBL), Relative Tail Length (rTL) and Centroid size (Cs) in the 43 species analysed
| Df | SS | MS | Rsq | F | Z | Pr(>F) | |
|---|---|---|---|---|---|---|---|
| Phy‐ANOVA of sacrum shape and rBL and Cs as factors | |||||||
| log(Cs) | 1 | 0.005225 | 0.005225 | 0.07087 | 3.1755 | 2.78033 | 0.004 |
| rBL | 1 | 0.002411 | 0.0024113 | 0.0327 | 1.4655 | 1.00167 | 0.163 |
| log(Cs): rBL | 1 | 0.001924 | 0.0019238 | 0.02609 | 1.1692 | 0.60401 | 0.259 |
| Residuals | 39 | 0.064171 | 0.0016454 | 0.87034 | |||
| Total | 42 | 0.073731 | |||||
| ANOVA of sacrum shape and rBL and Cs as factors (Non phylogenetic) | |||||||
| log(Cs) | 1 | 0.34166 | 0.34166 | 0.21548 | 12.1635 | 4.3599 | 0.001 |
| rBL | 1 | 0.08377 | 0.08377 | 0.05283 | 2.9824 | 2.2331 | 0.019 |
| log(Cs): rBL | 1 | 0.06465 | 0.06465 | 0.04078 | 2.3018 | 1.8796 | 0.037 |
| Residuals | 39 | 1.09547 | 0.02809 | 0.6909 | |||
| Total | 42 | 1.58555 | |||||
| Phy‐ANOVA of sacrum shape and rTL and Cs as factors | |||||||
| log(Cs) | 1 | 0.005225 | 0.005225 | 0.07087 | 3.3914 | 2.9217 | 0.002 |
| rTL | 1 | 0.004487 | 0.0044866 | 0.06085 | 2.9121 | 2.4106 | 0.009 |
| log(Cs):rTL | 1 | 0.003933 | 0.0039331 | 0.05334 | 2.5529 | 2.2204 | 0.016 |
| Residuals | 39 | 0.060086 | 0.0015407 | 0.81494 | |||
| Total | 42 | 0.073731 | |||||
Abbreviations: ANOVA, analysis of variance; Df, degrees of freedom; F, F‐statistics; MS, mean squares; Pr(<F), P‐value obtained from permutation; Rsq, r‐square; SS, sum of squares; Z, z‐score.
FIGURE 8.

Multivariate regression analysis between sacrum shape (regression score) and Relative Tail Length (a) and bivariate regression analysis between Relative Tail Length and Centroid size, log‐transformed (b)
4.4. Ecomorphological correlates in the sacrum of carnivores
The results obtained for the Procrustes ANOVA to test the association between sacrum shape and locomotor categories indicated that sacrum shape was statistically associated with locomotion (Table 6).
TABLE 6.
Results obtained from the phylogenetic Procrustes ANOVA to test the association between sacrum shape (Procrustes coordinates) and the locomotor categories using Cs as a factor in the 43 species analysed
| Df | SS | MS | Rsq | F | Z | Pr(>F) | |
|---|---|---|---|---|---|---|---|
| log(Cs) | 1 | 0.005225 | 0.005225 | 0.07087 | 3.1952 | 2.77845 | 0.003 |
| Categories | 3 | 0.007691 | 0.0025636 | 0.10431 | 1.5677 | 1.74198 | 0.033 |
| log(Cs):categories | 3 | 0.003582 | 0.0011939 | 0.04858 | 0.7301 | −0.87732 | 0.815 |
| Residuals | 35 | 0.057233 | 0.0016352 | 0.77625 | |||
| Total | 42 | 0.073731 |
ANOVA, analysis of variance.
5. DISCUSSION
Our results indicate that sacrum shape is significantly associated with both relative tail length and relative body length, the latter according with phylogenetic patterning (Table 5; Figure 8). Moreover, as sacrum shape is significantly associated with locomotor adaptations in carnivores (Table 6), we explain the ordination of the specimens on the morphospace of Figure 6 in terms of ecomorphology. Accordingly, those species with negative scores on the PC1 had sacra that were slender and longer than those with positive scores (Figure 6a). This is probably related (at least in part) to the number of vertebrae (Figure 4) composing their sacrum. It is worth to mention that ursids, otarids and phocids are large species with sacrum composed by >3 sacral vertebrae. The rest of species (excepting the badger, Meles meles, =4 sacral vertebrae) had sacra composed by 3 vertebrae or less (i.e. U. cinereoargenteus). Another important change seen in this eigenvector was the orientation of the auricular surface of the sacrum (Figures 2, 6b). Both the elongation of the sacrum and the disposition of the auricular surface are related to the shape of the muscular attachments for the multifidi, gluteus maximus and intertransversus muscles; but not with the absolute size of their areas of attachments on the dorsal region of the sacrum (Figures 2, 6b). However, there is a clear modification in the areas of attachment of the sacroccygeus and longissimus muscles on the sacral cornua and on the lateral parts of the median sacral crest (Figures 2, 6b). According to Figure 6b, those species with positive scores in the first eigenvector possess: (a) larger areas of attachment for the sacrococcygeus and the longissimus muscles on both the sacral cornua and the medial crest, respectively (Figures 2, 6b); (b) areas of attachment for the rest of the muscles on the lateral and medial sacral crests (Figures 2, 6b) with similars lenght and width; and (c) larger sacrocaudal and sacrolumbar articulations (Figures 1, 6b), resulting in a wider articulation with the tail and the presacral column. Our results indicate that the sacra of these species are shorter and more stoutly built and are composed of fewer of vertebrae. In addition, they also had a strong joint with the tail, with wider areas of major sacrococcygeal muscles, most probably due to either a very mobile and/or long tail. The median crest exhibits a larger surface, which means that the longissimus muscle system has a larger attachment area, conferring a high ability of vertebral column stabilisation (Done et al., 2010; Caro‐Munizaga and Concha‐Albornoz, 2014). However, it is striking that those species that score positively on the PC1 are the canids, and especially the grey fox (U. cinereoargenteus), and the hyaenids, as well as the herpestids and procyonids (Figure 6a). Among these taxa, the canids, as well as the hyaenids to a lesser degree, present extreme positive scores in the PC1, and this shape of the sacrum is related both with tail manoeuvrability (i.e. strong joints with the first caudal vertebra with wider areas of attachment for major sacrococcygeal muscles) and vertebral column stabilisation (i.e. well‐developed areas of attachment for the longissimus muscle) during locomotion. However, neither canids nor hyaenids have particularly long tails. Although this is difficult to interpret, the more developed areas of attachment for those muscles involved in tail manoeuvrability could be related to social signalling, as the tail of dogs has been demonstrated to be involved in this task (Ewer, 1973; Kiley‐Worthington, 1976; Hickman, 1979; Weisbecker et al., 2020). However, it is not possible to test this hypothesis with the present data.
In contrast, those species with negative scores on the first eigenvector possess: (a) smaller attachment areas for the sacrocaudal muscles and the longissimus muscles; (b) areas of attachment for the rest of the muscles on the lateral crest antero‐posteriorly long but medio‐laterally narow; and (c) larger sacrocaudal and sacrolumbar articulations (Figure 6b), resulting in a narrower articulation with the tail and the presacral column. In general, most of the muscle insertions were not reduced, except for those belonging to muscles that determine the tail movement and the presacral column stabilisation (Done et al., 2010; Caro‐Munizaga and Concha‐Albornoz, 2014). In fact, those species that possess very short tails in relation to their bodies such as ursids, phocids and otarids, score negatively on the PC1, and plot in the left part of the morphospace depicted in Figure 6a. In addition, they possess a long sacrum, composed of 4‐6 vertebrae (Figure 4) with sacrocaudal articulations not as developed as in other terrestrial species. It is worth mentioning that the lynxes (Lynx canadensis, Lynx lynx), the serval (L eptailurus serval) and the caracal (Caracal caracal) are the felids that score more negatively on PC1 and they also have shorter tails than the rest of their family members (Table 3). Moreover, it is noteworthy that the most arboreal felid of the sample, the clouded leopard (Neofelis nebulosa) is the felid species with the longest relative tail length (Table 3), and its sacrum morphology is more similar to that of highly arboreal taxa such the binturong (Arctictis binturong; Figure 6a).
On the other hand, those changes in the sacral shape accounted for by the second PC are related to the morphological changes in the auricular surface and with changes in the attachment areas of all muscles in general, unlike the changes in the attachments areas seen in the PC1 (Figures 2, 6b). Therefore, the sacrum of those species with negative scores on PC2 is characterised by having: (a) a rectangular‐shaped sacrum with the dorsal surface of the lateral crest of equal length anteroposteriorly, that is between the sacral wings and the transverse processes of the last sacral vertebra—which implies a similar width in those areas of the lumbosacral and sacrocaudal articulations; (b) larger areas of muscle attachment; and (c) a reduced area for the sacroiliac articulation (i.e. auricular area, Figure 2). Therefore, those species with negative scores on the PC2 are the ones with a less biomechanically demanding locomotion—that is those that resist less stress derived from, for example, ground reaction forces, because or they are large and aquatic or they are terrestrial but long‐bodied and small (Figure 2; Table 3). For example, herpestids, viverrids, procyonids, mustelids and Ailurus score negatively on this second PC (Figure 6a), despite not being phylogenetically related. Among these taxa, the mustelid Meles meles, which scores positively on PC2, stands out when compared to, for example, Mustela vison, which has lower PC2 values; M. meles has a greater body mass, its sacrum is composed by 4 vertebra and is generally terrestrial (Table 3). To support its body mass during locomotion on land it has a larger sacroiliac articulation than M. vison, which is smaller and semi‐aquatic (Larivière, 1999).
Nonetheless, those species with positive scores on this component present: (a) a triangular‐shaped sacrum with a narrow caudal part and a large proximal part, and therefore, they possess a sacrum with unequal dimensions of the lumbosacral and sacrocaudal articulations; (b) smaller attachment areas for all muscles; and (c) significantly larger surface areas for the auricular region and sacral tuberosities—that is large sacroiliac articulations. Strikingly, this articulation is key for an effective load transmission between the presacral region of the vertebral column and the hind limbs, as one of its primary functions is to support the animal weight during locomotion (Vleeming et al., 2012). Therefore, animals with positive scores on this eigenvector should be those whose posterior limbs experience more stress during locomotion because of either, (a) a large body mass or (b) a highly demanding locomotory behaviour. In general, those species scoring positively on the PC2 are the short‐bodied and large ursids or the canids and hyaenids, which need a high efficiency in the transmission of movement during a long‐distance pursuit to capture a prey (Janis and Wilhelm, 1993). Canids, as well as hyaenids usually have hunting habits, and so need running endurance to perform long chases to catch their prey (Janis and Wilhelm, 1993; Figueirido et al., 2015). Therefore, their skeletons must withstand stresses caused by increased muscle loading during fast locomotion, and this is reflected in their relatively high scores in the second eigenvector. A notable exception to this pattern is the cheetah (Acinonyx jubatus), a felid that is clearly more specialized for fast running than others in its family, and it scores similarly on PC2 than other ambush felids. Moreover, the cheetah (A. jubatus) scores in an intermediate position in the morphospace of Figure 6a. This could be related, at least in part, to its relative tail length, as the cheetah's tail is not particularly longer relative to its body length than the tail of other felids such as the lion (Panthera leo) (Table 3). However, the cheetah is a very atypical cursorial predator, because cursoriality is usually more a matter of endurance and stamina than of fast speeds (Janis and Wilhelm, 1993). The cheetah sustains pursuit for only 200–500 m, whereas wolves (C. lupus) and African wild dogs (Lycaon pictus) far exceed 500 m pursuing their prey (Ewer, 1973; Figueirido et al., 2015), which is also reflected in forearm mobility (Figueirido and Janis, 2011). The cheetah's chase could be considered as an extension of the sprint performed by regular felids that ambush their prey. Although canids and hyaenids are not able to supinate their forearms to grapple with prey, the cheetah, as a solitary predator lacking the endurance of pursuit predators, retains some ability to supinate the forearm in order to bring down its prey with a swipe (but they do not grasp it) (Figueirido and Janis, 2011; Figueirido et al., 2015). Therefore, it seems plausible that the sacrum of the cheetah does not experience the same amount of loading (in a repetitive and continuous fashion) for such a long interval of space/time during its chase than the sacrum of canids and hyaenids. Although this hypothesis is not testable with the present data at hand, this could explain why the cheetah is not coincident with other cursorial predators (i.e. canids and hyaenids) in the sacrum shape morphospace of Figure 6a.
Although cursorial hyaenids score well above the large cats on PC2, they overlap with the mountain lion (Puma concolor) and the wildcat (Felis silvestris) on this eigenvector. However, hyaenids depart from the rest of feliforms towards the right upper corner of the morphospace of Figure 6a. Similarly, canids depart from other caniforms and plot in the same region of morphospace as hyaenids. This is clear evidence that their sacra share the traits accounted for by the first eigenvector, although in hyaenids to a lesser degree. A special case among canids is the grey fox (U. cinereoargenteus), which represents an outlier in Figure 6a. This species neither possess a large body size (2.0–5.5 Kg) nor a pursuit mode of locomotion (Fuller and Cypher, 2004). However, it is a notable tree climber, able to scale branchless, vertical trunks to heights of 18 m, as well as jump vertically from branch to branch (Fuller and Cypher, 2004), and its sacrum is solely composed by two sacral vertebrae (Figure 4). Moreover, the grey fox has a greater ability to abduct the hind limb (Feeney, 1999). Accordingly, the increased auricular areas of the sacrum of the grey fox could be in part related to resisting increased loading in the posterior limbs during active climbing. However, it is puzzling that other arboreal species in our sample (see Table 3), such as the fossa (Crytoprocta ferox), the clouded leopard (Neofelis nebulosa) or the red panda (Ailurus fulgens) do not score as positively as the grey fox U. cinereoargenteus) on PC2. This may indicate that highly arboreal species of viverrids, euplerids, procyonids, ailurids or even felids (see Table 3) do not possess specialized sacra for being arboreal and can inhabit in trees with their basal (non‐specialized) sacrum shape with regard to these traits. However, canids lost their climbing abilities ≈30 million years ago, when the scansorial hesperocyonine canid, Hesperocyon went extinct (Wang, 1993). As a result, the grey fox have been secondarily adapted to a scansorial locomotion from fully terrestrial (or cursorial) canid ancestors (Nyakatura and Bininda‐Emonds, 2012). Most probably this is the reason to explain the unique morphology of the grey fox (U. cinereoargenteus) sacrum among canids and carnivores. The grey fox (U. cinereoargenteus) also has the longest tail in relation to body length among canids (Table 3), which is related to keeping balance while performing these tasks (Feeney, 1999; Fuller and Cypher, 2004). Both N. nebulosa and A. fulgens have also long tails (Table 3).
Finally, it is worth mentioning that, although the pelvis and sacrum are closely connected, the association between sacrum shape and locomotion found here is not found in the pelvis (Martín‐Serra et al., 2014b; Lewton et al., 2020). The carnivoran pelvis is a modular structure with variable patterns of modularity (Martín‐Serra et al., 2018). Therefore, the association between pelvic shape and locomotion may be more complex than in the case of the sacrum. One possibility to explore this issue may be to focus on the iliac bone, asIthaca, N.Y. it connects the pelvis and the sacrum through the sacroiliac articulation, so it is expected to correlate better with the sacrum, and therefore, with locomotory adaptations (Lewton et al., 2020).
6. CONCLUSIONS
The main goal of this study was to investigate the morphological evolution of the sacrum in relation to its function in the mammalian order Carnivora, given its relevance in the vertebrate skeleton since it connects the caudal region with the presacral region of the vertebral column and the hind limbs through the pelvis. Using multivariate morphometrics and comparative methods for high‐dimensional data, our results indicate that the main morphology of the sacrum relates to: (a) meristic variation, that is the number of vertebrae that compose the sacrum (from 2 to 3 in canids to 4–6 in ursids, phocids and otarids) which accounts for ca. 50% of the morphological variation; and (b) the shape of external surface of the sacrum plus the size of the auricular surface (from rectagular‐shaped to triangular‐shaped sacra) which accounts for ca. 16% of the variation. In terms of function, this morphological variation relates to: (a) a reorganisation in the muscle attachment areas with an increase of the sacroccygeus and longissimus muscles, which corresponds to having a large or highly mobile tail plus stabilisation of the presacral column; and (b) a substantial increase in the sacroiliac and lumbosacral articulations, which corresponds to the need to support the animal body mass and load transmission during active locomotion. The results suggest that the morphology of the sacrum reflects a trade‐off between these two functional aspects. The morphology of the carnivoran sacrum is significantly associated with locomotor adaptations and/or substrate use, with significant differences among the sacra of arboreal, terrestrial and aquatic taxa. Moreover, these morphological adaptations seem to be associated with body mass, relative tail length, and relative body length, the latter highly influenced by phylogeny. The fact that the relative body length was influenced by phylogeny was in part expected because the same finding has been recently reported in mustelids, a family of carnivorans, with some taxa exhibiting highly elongated bodies (Law et al., 2019, Law, 2019). The morphological regions of the lumbosacral, sacrocaudal and sacroiliac articulations are also highly variable among species.
Despite the postcranial skeleton being subjected to strong phylogenetic and allometric constraints, our results indicate that the morphology of the sacrum in carnivorans reflects functional adaptations to the different lifestyles of the species analysed. The results presented here provide fresh data that could be used to explore locomotion in extinct carnivorans and provide a solid starting point for more detailed research into the functional morphology of the sacrum.
CONFLICT OF INTEREST
The authors declare that there is not conflict of interest.
Supporting information
SupplementaryData
ACKNOWLEDGEMENTS
We thank Elsa Panciroli and anonymous reviewer for their in‐depth and constructive reviews. This work has been funded by Ministerio de Ciencia y Universidades (Grants: CGL2015‐68300P; CGL2017‐92166‐EXP) and Junta de Andalucía (UMA18‐FEDERJA‐188). The data that support the findings of this study are available in the supplementary material of this article.
REFERENCES
- Adams, D.C. , Collyer, M. , Kaliontzopoulou, A. and Sherratt, E. (2017) Geomorph: software for geometric morphometric analyses. R package version 3.0.5. https://cran.rproject.org/package=geomorph. [Google Scholar]
- Bookstein, F.L. (1991) Morphometric tools for landmark data: geometry and biology. London, UK: Cambridge University Press. [Google Scholar]
- Breit, S.M. , Knaus, I.M. and Künzel, W.W. (2002) Use of routine ventrodorsal radiographic views of the pelvis to assess inclination of the wings of the sacrum in dogs. American Journal of Veterinary Research, 63(9), 1220–1225. [DOI] [PubMed] [Google Scholar]
- Caro‐Munizaga, C. and Concha‐Albornoz, I. (2014) Descripción Anatómica de los Músculos del Miembro Pélvico de Puma (Puma concolor). International Journal of Morphology, 32(3), 1085–1094. [Google Scholar]
- Cignoni, P. , Callieri, M. , Corsini, M. , Dellepiane, M. , Ganovelli, F. and Ranzuglia, G. (2008) Meshlab: an open‐source mesh processing tool. Eurographics Italian Chapter Conference, 2008, 129–136. [Google Scholar]
- Collyer, M.L. , Sekora, D.J. and Adams, D.C. (2015) A method for analysis of phenotypic change for phenotypes described by high‐dimensional data. Heredity, 115(4), 357. [DOI] [PMC free article] [PubMed] [Google Scholar]
- Christiansen, P. and Wroe, S. (2007) Bite forces and evolutionary adaptations to feeding ecology in carnivores. Ecology, 88(2), 347–358. [DOI] [PubMed] [Google Scholar]
- Done, S. , Stickland, N. , Evans, S. and Goody, P. (2010) Atlas en color de anatomía veterinaria. El perro y del gato. London, UK: Elsevier Health Sciences Spain. [Google Scholar]
- Dryden, I.L. and Mardia, K. (1998) Statistical shape analysis. Chichester, UK: Wiley. [Google Scholar]
- Dunn, R.H. , Cooper, C. , Lemert, J. , Mironov, N. and Meachen, J.A. (2019) Locomotor correlates of the scapholunar of living and extinct carnivorans. Journal of morphology, 280(8), 1197–1206. [DOI] [PubMed] [Google Scholar]
- Ewer, R.F. (1973) The carnivores. Ithaca, NY: Cornell University Press. [Google Scholar]
- Feeney, S. (1999) Comparative osteology, myology, and locomotor specializations of the fore and hind limbs of the North American foxes Vulpes vulpes and Urocyon cinereoargenteus. Dissertation, University of Massachusetts, Amherst. [Google Scholar]
- Figueirido, B. (2018) Phenotypic disparity of the elbow joint in domestic dogs and wild carnivores. Evolution, 72(8), 1600–1613. [DOI] [PubMed] [Google Scholar]
- Figueirido, B. and Soibelzon, L.H. (2010) Inferring palaeoecology in extinct tremarctine bears (Carnivora, Ursidae) using geometric morphometrics. Lethaia, 43(2), 209–222. [Google Scholar]
- Figueirido, B. and Janis, C.M. (2011) The predatory behaviour of the thylacine: Tasmanian tiger or marsupial wolf? Biology Letters, 7(6), 937–940. [DOI] [PMC free article] [PubMed] [Google Scholar]
- Figueirido, B. , Serrano‐Alarcón, F.J. , Slater, G.J. and Palmqvist, P. (2010) Shape at the cross‐roads: homoplasy and history in the evolution of the carnivoran skull towards herbivory. Journal of Evolutionary Biology, 23(12), 2579–2594. [DOI] [PubMed] [Google Scholar]
- Figueirido, B. , MacLeod, N. , Krieger, J. , De Renzi, M. , Pérez‐Claros, J.A. and Palmqvist, P. (2011) Constraint and adaptation in the evolution of carnivoran skull shape. Paleobiology, 37(3), 490–518. [Google Scholar]
- Figueirido, B. , Tseng, Z.J. and Martín‐Serra, A. (2013) Skull shape evolution in durophagous carnivorans. Evolution, 67(7), 1975–1993. [DOI] [PubMed] [Google Scholar]
- Figueirido, B. , Martín‐Serra, A. , Tseng, Z.J. and Janis, C.M. (2015) Habitat changes and changing predatory habits in North American fossil canids. Nature Communications, 6, 7976. [DOI] [PubMed] [Google Scholar]
- Figueirido, B. , Martín‐Serra, A. and Janis, C.M. (2016) Ecomorphological determinations in the absence of living analogues: the predatory behavior of the marsupial lion (Thylacoleo carnifex) as revealed by elbow joint morphology. Paleobiology, 42(3), 508–531. [Google Scholar]
- Fuller, T.K. and Cypher, B.L. (2004) Gray fox Urocyon cinereoargenteus In: Sillero‐Zubiri C., Hoffman M. and MacDonald D. (Eds.) Canids: foxes, wolves, jackals and dogs (pp. 92–97) Switzerland: IUCN/SSC. [Google Scholar]
- Goswami, A. (2006) Morphological integration in the carnivoran skull. Evolution, 60, 169–183. [PubMed] [Google Scholar]
- Goswami, A. and Polly, P.D. (2010) The influence of modularity on cranial morphological disparity in Carnivora and Primates (Mammalia). PLoS One, 5(3), e9517. [DOI] [PMC free article] [PubMed] [Google Scholar]
- Hartstone‐Rose, A. , Selvey, H. , Villar, J.R. , Atwell, M. and Schmidt, T. (2014) The three‐dimensional morphological effects of captivity. PLoS One, 9(11), e113437. [DOI] [PMC free article] [PubMed] [Google Scholar]
- Hickman, G.C. (1979) The mammalian tail: a review of functions. Mammal review, 9(4), 143–157. [Google Scholar]
- Janis, C.M. and Wilhelm, P.B. (1993) Were there mammalian pursuit predators in the Tertiary? Dances with wolf avatars. Journal of Mammalian Evolution, 1(2), 103–125. [Google Scholar]
- Janis, C.M. and Figueirido, B. (2014) Forelimb anatomy and the discrimination of the predatory behavior of carnivorous mammals: the thylacine as a case study. Journal of morphology, 275(12), 1321–1338. [DOI] [PubMed] [Google Scholar]
- Jurgelėnas, E. (2015) Osteometric analysis of the pelvic bones and sacrum of the red fox and raccoon dog. Veterinarija ir Zootechnika, 70, 42–47. [Google Scholar]
- Kiley‐Worthington, M. (1976) The tail movements of ungulates, canids and felids with particular reference to their causation and function as displays. Behaviour, 56(1–2), 69–114. [Google Scholar]
- Larivière, S. (1999) Mustela vison. Mammalian Species, 608, 1–9. [Google Scholar]
- Law, C.J. , Slater, G.J. and Mehta, R.S. (2019) Shared extremes by ectotherms and endotherms: body elongation in mustelids is associated with small size and reduced limbs. Evolution, 73(4), 735–749. [DOI] [PubMed] [Google Scholar]
- Law, C.J. (2019) Evolutionary shifts in extant mustelid (Mustelidae: Carnivora) cranial shape, body size and body shape coincide with the Mid‐Miocene Climate Transition. Biology letters, 15(5), 20190155. [DOI] [PMC free article] [PubMed] [Google Scholar]
- Lewis, M.E. (1997) Carnivoran paleoguilds of Africa: implications for hominid food procurement strategies. Journal of Human Evolution, 32(2–3), 257–288. [DOI] [PubMed] [Google Scholar]
- Lewton, K.L. , Brankovic, R. , Byrd, W.A. , Cruz, D. , Morales, J. and Shin, S. (2020) The effects of phylogeny, body size, and locomotor behavior on the three‐dimensional shape of the pelvis in extant carnivorans. PeerJ, 8, e8574. [DOI] [PMC free article] [PubMed] [Google Scholar]
- Machado, F.A. , Zahn, T.M.G. and Marroig, G. (2018) Evolution of morphological integration in the skull of Carnivora (Mammalia): changes in Canidae lead to increased evolutionary potential of facial traits. Evolution, 72(7), 1399–1419. [DOI] [PubMed] [Google Scholar]
- Maddison, W.P. (1991) Squared‐change parsimony reconstructions of ancestral states for continuous‐valued characters on a phylogenetic tree. Systematic Biology, 40(3), 304–314. [Google Scholar]
- Martín‐Serra, A. , Figueirido, B. and Palmqvist, P. (2014a) A three‐dimensional analysis of morphological evolution and locomotor performance of the carnivoran forelimb. PLoS One, 9(1), e85574. [DOI] [PMC free article] [PubMed] [Google Scholar]
- Martín‐Serra, A. , Figueirido, B. and Palmqvist, P. (2014b) A three‐dimensional analysis of the morphological evolution and locomotor behaviour of the carnivoran hind limb. BMC Evolutionary Biology, 14(1), 129. [DOI] [PMC free article] [PubMed] [Google Scholar]
- Martín‐Serra, A. , Figueirido, B. , Pérez‐Claros, J.A. and Palmqvist, P. (2015) Patterns of morphological integration in the appendicular skeleton of mammalian carnivores. Evolution, 69(2), 321–340. [DOI] [PubMed] [Google Scholar]
- Martín‐Serra, A. , Figueirido, B. and Palmqvist, P. (2016) In the pursuit of the predatory behavior of Borophagines (Mammalia, Carnivora, Canidae): inferences from forelimb morphology. Journal of Mammalian Evolution, 23(3), 237–324. [Google Scholar]
- Martín‐Serra, A. , Figueirido, B. and Palmqvist, P. (2018) Changing modular patterns in the carnivoran pelvic girdle. Journal of Mammalian Evolution, 27(2), 237–243. [Google Scholar]
- Meachen‐Samuels, J. and Van Valkenburgh, B. (2009a) Craniodental indicators of prey size preference in the Felidae. Biological Journal of the Linnean Society, 96(4), 784–799. [Google Scholar]
- Meachen‐Samuels, J. and Van Valkenburgh, B. (2009b) Forelimb indicators of prey‐size preference in the Felidae. Journal of Morphology, 270(6), 729–744. [DOI] [PubMed] [Google Scholar]
- Meloro, C. , Elton, S. , Louys, J. , Bishop, L.C. and Ditchfield, P. (2013) Cats in the forest: predicting habitat adaptations from humerus morphometry in extant and fossil Felidae (Carnivora). Paleobiology, 39(3), 323–344. [Google Scholar]
- Nyakatura, K. and Bininda‐Emonds, O.R. (2012) Updating the evolutionary history of Carnivora (Mammalia): a new species‐level supertree complete with divergence time estimates. BMC biology, 10(1), 12. [DOI] [PMC free article] [PubMed] [Google Scholar]
- Ocal, M.K. , Ortanca, O.C. and Parın, U. (2006) A quantitative study on the sacrum of the dog. Annals of Anatomy‐Anatomischer Anzeiger, 188(5), 477–482. [DOI] [PubMed] [Google Scholar]
- O’Regan, H.J. and Kitchener, A.C. (2005) The effects of captivity on the morphology of captive, domesticated and feral mammals. Mammal Review, 35(3–4), 215–230. [Google Scholar]
- Palmqvist, P. , Gröcke, D.R. , Arribas, A. and Fariña, R.A. (2003) Paleoecological reconstruction of a lower Pleistocene large mammal community using biogeochemical (δ 13 C, δ 15 N, δ 18 O, Sr: Zn) and ecomorphological approaches. Paleobiology, 29(2), 205–229. [Google Scholar]
- Palmqvist, P. , Martínez‐Navarro, B. , Pérez‐Claros, J.A. , Torregrosa, V. , Figueirido, B. , Jiménez‐Arenas, J.M. et al (2011) The giant hyena Pachycrocuta brevirostris: modelling the bone‐cracking behavior of an extinct carnivore. Quaternary International, 243(1), 61–79. [Google Scholar]
- Panciroli, E. , Janis, C. , Stockdale, M. and Martín‐Serra, A. (2017) Correlates between calcaneal morphology and locomotion in extant and extinct carnivorous mammals. Journal of morphology, 278(10), 1333–1353. [DOI] [PubMed] [Google Scholar]
- Paradis, E. and Schliep, K. (2019) Ape 5.0: an environment for modern phylogenetics and evolutionary analyses in R. Bioinformatics, 35(3), 526–528. [DOI] [PubMed] [Google Scholar]
- Pérez‐Ramos, A. , Kupczik, K. , Van Heteren, A.H. , Rabeder, G. , Grandal‐D’Anglade, A. , Pastor, F.J. et al (2019) A three‐dimensional analysis of tooth‐root morphology in living bears and implications for feeding behaviour in the extinct cave bear. Historical Biology, 31(4), 461–473. [Google Scholar]
- Pérez‐Ramos, A. , Tseng, Z.J. , Grandal‐D’Anglade, A. , Rabeder, G. , Pastor, F.J. and Figueirido, B. (2020) Biomechanical simulations reveal a trade‐off between adaptation to glacial climate and dietary niche versatility in European cave bears. Science advances, 6(14), eaay9462. [DOI] [PMC free article] [PubMed] [Google Scholar]
- Polly, P.D. (2008) Adaptive Zones and the Pinniped Ankle: a 3D Quantitative Analysis of Carnivoran Tarsal Evolution In:Sargis E. and Dagosto M. (Eds.) Mammalian evolutionary morphology: A tribute to frederick S. Szalay. Dordrecht, the Netherlands: Springer, pp. 65–194. [Google Scholar]
- Polly, P.D. (2010) Tiptoeing through the trophics: geographic variation in carnivoran locomotor ecomorphology in relation to environment. Carnivoran evolution: new views on phylogeny, form, and function, 374–401.
- Core Team, R. (2017) R: a language and environment for statistical computing. Version 3.4.1. Vienna: R Foundation for Statistical Computing; http://cran.R‐project.org [Google Scholar]
- Randau, M. and Goswami, A. (2017) Unravelling intravertebral integration, modularity and disparity in Felidae (Mammalia). Evolution & development, 19(2), 85–95. [DOI] [PubMed] [Google Scholar]
- Randau, M. , Goswami, A. , Hutchinson, J.R. , Cuff, A.R. and Pierce, S.E. (2016) Cryptic complexity in felid vertebral evolution: shape differentiation and allometry of the axial skeleton. Zoological Journal of the Linnean Society, 178(1), 183–202. [Google Scholar]
- Randau, M. , Cuff, A.R. , Hutchinson, J.R. , Pierce, S.E. and Goswami, A. (2017) Regional differentiation of felid vertebral column evolution: a study of 3D shape trajectories. Organisms Diversity & Evolution, 17(1), 305–319. [Google Scholar]
- Randau, M. , Sanfelice, D. and Goswami, A. (2019) Shifts in cranial integration associated with ecological specialization in pinnipeds (Mammalia, Carnivora). Royal Society Open Science, 6(3), 190201. [DOI] [PMC free article] [PubMed] [Google Scholar]
- Revell, L.J. (2012) Phytools: an R package for phylogenetic comparative biology (and other things). Methods in Ecology and Evolution, 3(2), 217–223. [Google Scholar]
- Samuels, J.X. , Meachen, J.A. and Sakai, S.A. (2013) Postcranial morphology and the locomotor habits of living and extinct carnivorans. Journal of morphology, 274(2), 121–146. [DOI] [PubMed] [Google Scholar]
- Sidlauskas, B. (2008) Continuous and arrested morphological diversification in sister clades of characiform fishes: a phylomorphospace approach. Evolution, 62(12), 3135–3156. [DOI] [PubMed] [Google Scholar]
- Tseng, Z.J. (2008) Cranial function in a late Miocene Dinocrocuta gigantea (Mammalia: Carnivora) revealed by comparative finite element analysis. Biological Journal of the Linnean Society, 96(1), 51–67. [Google Scholar]
- Tseng, Z.J. and Wang, X. (2010) Cranial functional morphology of fossil dogs and adaptation for durophagy in Borophagus and Epicyon (Carnivora, Mammalia). Journal of Morphology, 271(11), 1386–1398. [DOI] [PubMed] [Google Scholar]
- Van Heteren, A.H. and Figueirido, B. (2019) Diet reconstruction in cave bears from craniodental morphology: past evidences, new results and future directions. Historical Biology, 31(4), 500–509. [Google Scholar]
- Van Valkenburgh, B. (1985) Locomotor diversity within past and present guilds of large predatory mammals. Paleobiology, 11(4), 406–428. [Google Scholar]
- Van Valkenburgh, B. (1987) Skeletal indicators of locomotor behavior in living and extinct carnivores. Journal of Vertebrate Paleontology, 7(2), 162–182. [Google Scholar]
- Van Valkenburgh, B. (1988) Trophic diversity in past and present guilds of large predatory mammals. Paleobiology, 14(2), 155–173. [Google Scholar]
- Van Valkenburgh, B. (1991) Iterative evolution of hypercarnivory in canids (Mammalia: Carnivora): evolutionary interactions among sympatric predators. Paleobiology, 17(4), 340–362. [Google Scholar]
- Vleeming, A. , Schuenke, M.D. , Masi, A.T. , Carreiro, J.E. , Danneels, L. and Willard, F.H. (2012) The sacroiliac joint: an overview of its anatomy, function and potential clinical implications. Journal of anatomy, 221(6), 537–567. [DOI] [PMC free article] [PubMed] [Google Scholar]
- Wang, X. (1993) Transformation from plantigrady to digitigrady: functional morphology of locomotion in Hesperocyon (Canidae, Carnivora). American Museum Novitates, 3069, 1–23. [Google Scholar]
- Weisbecker, V. , Speck, C. and Baker, A.M. (2020) A tail of evolution: evaluating body length, weight and locomotion as potential drivers of tail length scaling in Australian marsupial mammals. Zoological Journal of the Linnean Society, 188(1), 242–254. [Google Scholar]
- Wiley, D.F. , Amenta, N. , Alcantara, D.A. , Ghosh, D. , Kil, Y.J. and Delson, E. et al (2005) Evolutionary morphing. En VIS 05. IEEE Visualization, 2005. IEEE. p. 431–438.
- Wilson, D.E. and Mittermeier, R.A. (2009) Handbook of the Mammals of the World. Vol. 1 Carnivores. Lynx Edicions, Barcelona. [Google Scholar]
- Wroe, S. , McHenry, C.R. and Thomason, J. (2005) Bite club: comparative bite force in big biting mammals and the prediction of predatory behaviour in fossil taxa. Proceedings of the Royal Society B: Biological Sciences, 272(1563), 619–625. [DOI] [PMC free article] [PubMed] [Google Scholar]
Associated Data
This section collects any data citations, data availability statements, or supplementary materials included in this article.
Supplementary Materials
SupplementaryData