

Summary
We provide an overview on the use of biological assays to calibrate and initialize mechanism-based models of cancer phenomena. Although artificial intelligence methods currently dominate the landscape in computational oncology, mathematical models that seek to explicitly incorporate biological mechanisms into their formalism are of increasing interest. These models can guide experimental design and provide insights into the underlying mechanisms of cancer progression. Historically, these models have included a myriad of parameters that have been difficult to quantify in biologically relevant systems, limiting their practical insights. Recently, however, there has been much interest calibrating biologically based models with the quantitative measurements available from (for example) RNA sequencing, time-resolved microscopy, and in vivo imaging. In this contribution, we summarize how a variety of experimental methods quantify tumor characteristics from the molecular to tissue scales and describe how such data can be directly integrated with mechanism-based models to improve predictions of tumor growth and treatment response.
Subject Areas: Bioengineering, Systems Biology, Cancer, In Silico Biology
Graphical Abstract
Bioengineering; Systems Biology; Cancer; In Silico Biology
Introduction
Although there is an ever-increasing body of clinical research that has sought to characterize cancer development and evaluate viable therapies, there is still a fundamental lack of understanding of underlying factors involved in cancer development and progression. This is no doubt owing to the complex and dynamic interplay of heterogeneous cell populations, signaling factors, and microenvironments that exist within tumors (Hanahan and Coussens, 2012; Hanahan and Weinberg, 2011). In an attempt to capture and characterize these phenomena in a well-controlled setting, scientists have developed and utilized a myriad of in vitro and in vivo biological assays to uncover the molecular and cellular drivers of tumor growth and treatment response. However, the vast majority of analyses applied to these in vitro and in vivo assays reduce the observations to a single measurement or snapshot in time, ignoring the complex spatially and temporally evolving nature of cancer. For example, angiogenesis is linked to mechanical properties of the tumor microenvironment, cell-cell interactions between tumor and vascular cells, as well as the presence of soluble growth factors (De Palma et al., 2017). However, common angiogenic assays, such as tube formation assays, reduce this phenomena to a measurement of expression of proangiogenic cytokines (e.g., vascular endothelial growth factor) or endothelial cell proliferation (Staton et al., 2004). Although 2D and 3D models enable the study of more complex interactions (e.g., cell-cell or cell-ECM interactions [Boussommier-Calleja, 2020; Gadde et al., 2018; Hoarau-Véchot et al., 2018; Michna et al., 2018]) and in vivo models can investigate tumor progression in the context of the microenvironment, the ability to quantitatively characterize the spatiotemporal evolution of cancer is quite limited within current in vitro and in vivo experimental paradigms.
We (and others) have posited that without a mathematical theory enabling the systematic analysis of the numerous spatially and temporally evolving parameters and variables that characterize cancer, we are left with trial and error (Coveney et al., 2016; Yankeelov et al, 2013, 2015). Mathematical models based on biological processes can be used to abstract the fundamental phenomena of a developing tumor and allow for “in silico” experimentation to systematically investigate cancer processes. Biological assays involve large investments in both time and money and often entail numerous conditions to evaluate quantities of interest against appropriate controls. Mathematical models can guide experimental design by simulating effects of the phenomena under investigation and narrowing the scope of biological measurements needed, thereby saving resources. Additionally, they can provide mechanistic insight into cancer processes that are difficult to isolate and measure experimentally. Development and validation of these mathematical models with appropriate biological measurements may yield a comprehensive theory of cancer across spatial and temporal scales that can be used to fundamentally shift how cancers are treated. Furthermore, application of biologically based, mathematical models that can be parameterized for individual patients—and not “trained” on large population datasets—may yield patient-specific predictions and have the potential to optimize therapeutic interventions on an individual patient basis (Rockne et al., 2019; Yankeelov et al, 2013, 2015).
Historically there has been a lack of integration of mathematical theory and experimental data in cancer biology and oncology (Yankeelov et al., 2013). We posit that this critical obstacle to personalized predictions can now be overcome with quantitative biological assays combined with appropriate mathematical models designed to incorporate them. One fundamental issue in attempting to bridge this divide is that biological assays have not always yielded quantitative measures that could be used to parameterize mechanism-based models of cancer progression and response. Furthermore, the existing mathematical models were not structured in a way that allowed for incorporation of data from such assays. However, there has been much recent growth in developing assays that can provide quantitative biological data, as well as new efforts to develop mechanism-based mathematical models that enable incorporation of available biological data (Rockne et al., 2019).
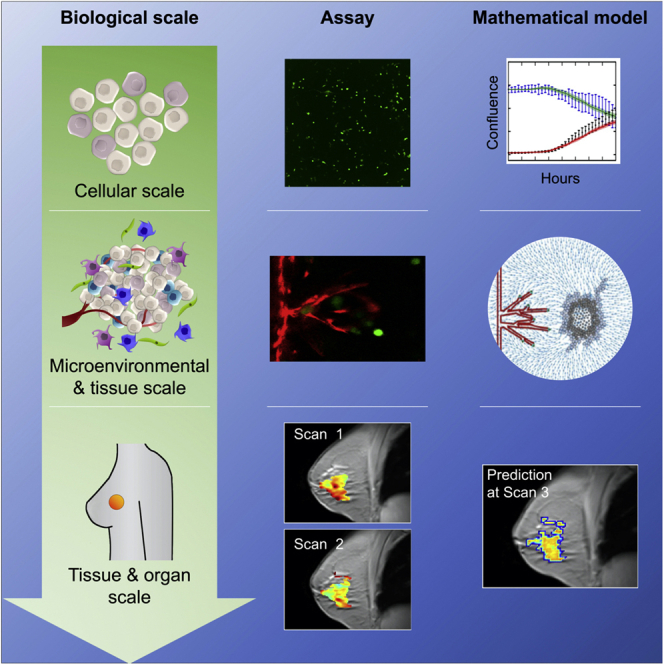
In this review, we introduce biological assays appropriate for quantitatively probing cancer dynamics in vitro, ex vivo, and in vivo and highlight the opportunities for their integration into mechanism-based, mathematical models of tumor growth and treatment response at the subcellular, cellular, and tissue scales (please see Figure 1). This developing field is illustrated by presenting representative examples of studies that have integrated quantitative data into mathematical models of solid tumor malignancies. We also discuss the experimental and computational limitations to modeling cancer at each scale to highlight the need for robust integration between mathematical and biological experiments.
Figure 1.

Overview of Biological Scales Described in This Review
For each scale we will introduce key elements of the relevant tumor biology, as well as how experimental data are integrated with mathematical models to study cancer. At the cellular scale (A), we focus on the development of mathematical models for identification of heterogeneous phenotypes and differentiation of cancer cell populations. At the microenvironmental and tissue scales (B), we focus on in vitro and ex vivo data driven mathematical models for analyzing protein and nutrient gradients, multicellular interactions, and vasculature within the tumor microenvironment. Finally, we explore the tissue and organ scales (C) in the in vivo setting by discussing the coupling of imaging data from animal models and patient tumors to mathematical models for predicting tumor development.
Biology-Based Mathematical Models
Mathematical models of cancer are broadly classified as discrete or continuous. Discrete approaches usually consist of agent-based models (Metzcar et al., 2019; Wang et al., 2015), whereby tumor cells are represented as independent entities that follow a set of rules dictating cellular behavior. Thus, agent-based models are more amenable to in vitro cellular or small-range tissue-scale applications, which can utilize microscopically resolved, genomic, and transcriptomic data. Continuous formulations feature ordinary (ODE) or partial (PDE) differential equations that describe the population-averaged or spatially resolved dynamics of tumor cells, respectively. ODE models are limited to temporal dynamics, but this enables their use in a wide range of cellular and tissue-scale settings that can leverage multiple types of time-resolved data (Benzekry et al., 2014; Jarrett et al., 2019; Johnson et al., 2020; Lorenzo et al., 2019b; Mendoza-Juez et al., 2012; Morken et al., 2014). PDE models further include spatial dynamics and constitute the standard approach for clinical, tissue-scale applications, which usually rely on longitudinal in vivo imaging data (Hormuth et al., 2020; Jarrett et al., 2018; Lorenzo et al., 2019a; Mang et al., 2020; Rockne et al., 2015; Wong et al., 2017). Additionally, hybrid models combine a discrete and continuous formulation, which may require multiscale multimodal data (Metzcar et al., 2019; Phillips et al., 2020; Vilanova et al., 2017; Wang et al., 2015).
In principle, mathematical models of cancer often describe biological mechanisms common across tumor types and therefore have the potential for general application. However, in practice, these models often must be customized to describe disease-specific characteristics related to tumor development and response to therapy. Despite the wealth and diversity of biologically based, mathematical models of cancer, there is a paucity of studies that explicitly link model predictions with experimental data (Altrock et al., 2015; Karolak et al., 2018; Yankeelov et al., 2013). To facilitate future efforts at this interface, we now describe how state-of-the-art biological assays can provide quantitative data to calibrate and validate mathematical models from the cellular (following section) to tissue scales (next two sections).
Mathematical Modeling of Cancer at the Cellular Scale
Cellular Heterogeneity in Cancer
The origin and interactions of genetically and phenotypically distinct cells within a patient's tumor influence its proliferation rate, metastatic potential, and treatment response (Brock et al., 2009; Maley et al., 2017; Pisco and Huang, 2015). Mathematical modeling can be used to describe and predict cellular behavior, to better understand the contribution of individual subpopulations of cells to a cancer's dynamic ecosystem. Experimental assays can be used to quantify subcellular attributes (from genes to protein), as well as identify cellular phenotypes. In Section “Cellular Scale Data Appropriate for Incorporating into Mathematical Models of Cancer,” we will cover a diverse set of quantitative assays that can be used to unveil the cellular phenotypic states. These widely available biological techniques can be used to calibrate, initialize, and validate mathematical models that seek to unveil fundamental mechanisms of tumorigenesis and understand how cancer cell populations interact and evolve (Figure 2).
Figure 2.

Quantification of Cellular Properties to Parameterize Mathematical Models of Cancer
(A) Illustration of how cancer cell populations exhibit heterogeneity at multiple levels, described by genomics (represented by color), morphology (represented by shape), and gene expression (represented by receptor status). Experimental assays quantify genomic, transcriptomic, or proteomic differences between cells to reveal the characteristic properties of tumor cell subpopulations.
(B) Example outputs from high-throughput assays such as (1) flow cytometry in which cell populations are identified by surface marker expression, (2) barcode labeling to quantify abundance of clonal populations over time, (3) scRNA-seq to measure differential gene expression in individual cells, and (4) reveal distinct phenotypic clusters of cells.
(C) Display of how biological processes of tumor cell populations can be represented by mathematical models describing the behavior and interactions of distinct cell types. Such models can be informed by the data in (B) to reveal novel insights about the dynamic behavior of the cell population.
Cellular Scale Data Appropriate for Incorporating into Mathematical Models of Cancer
Tumors are composed of phenotypically diverse cancer cell populations, which determine tumor behavior and therapeutic sensitivity and response (Hardeman et al., 2017; Pisco et al., 2013). Experimental assays quantifying gene expression and protein content can reveal key phenotypic states and signaling pathways, information that can then be used to parameterize mathematical models of cancer cell dynamics. Quantitative polymerase chain reaction (qPCR) can be used to quantify DNA levels within a sample and determine if a specific mutant allele is present in a cell population (Alvarez-Garcia et al., 2018). Using qPCR measurements from patients with chronic myeloid leukemia (CML), Michor et al. developed a four-compartment model of leukemic cell populations (Michor et al., 2005). Their model suggests that imatinib, a CML treatment, was effective treatment of differentiated leukemic cells but not of leukemic stem cells, yielding insight into CML treatment failure (Michor et al., 2005). DNA sequencing technologies, such as whole genome sequencing, can be used to quantify genetic mutations associated with cancer cell populations. Such data have been used to link levels of specific mutations with tumor growth patterns, to reveal which mutations are driving tumor behavior. For example, in patients with chronic lymphocytic leukemia, Gruber et al. tracked the accumulation of genetic mutations over time and applied Bayesian methods to estimate clonal proportions within the bulk population, then quantifying the fitness benefits conferred to the bulk tumor (Gruber et al., 2019). A number of stochastic and agent-based models have been developed to describe the effects of genetic drift and subclonal evolution on bulk tumor behavior (Beerenwinkel et al., 2007; Chowell et al., 2018; McFarland et al., 2013; Moolgavkar and Knudson, 1981; Waclaw et al., 2015), but there remains a need for integration of experimental data into these frameworks to construct models capable of making predictions that can be directly tested.
RNA sequencing (RNA-seq) data, in combination with bioinformatics techniques can reveal gene expression patterns that drive protein signaling, cellular behavior, and therapeutic response. For example, Bouhaddou et al. integrated high-dimensional multi-omics data, including patient-derived RNA-seq data, to construct an ODE model that integrated stochastic fluctuations in expression of commonly mutated cancer pathways and showed how these fluctuations influence tumor cell proliferation and death (Bouhaddou et al., 2018). With bulk RNA sequencing, gene expression patterns are averaged across cell populations. Single-cell RNA-seq (scRNA-seq) can be used to assess gene expression patterns at the individual cell level to identify unique cellular phenotypes, enabling characterization of the diversity within cancer cell populations (Becht et al., 2019). For example, Johnson et al. calibrated a model with estimates of subpopulation composition from scRNA-seq with longitudinal population data of cell number over time to predict the population response to new treatment regimens and assess the degree of drug-induced resistance (Johnson et al., 2020). Inclusion of scRNA-seq data yielded improved predictive accuracy of treatment response dynamics with a concordance correlation coefficient (CCC) of 0.89, compared with 0.79 without transcriptomic information (Johnson et al., 2020).
Protein expression on the surface of cancer cells allows quick identification of distinct phenotypes that can be monitored and isolated using flow cytometry and fluorescence-activated cell sorting (Fillmore and Kuperwasser, 2008; Gupta et al., 2011; Shipitsin et al., 2007). For example, Gupta et al. parameterized a Markov chain Monte Carlo model of phenotypic state transitions by monitoring the expression of characteristic surface proteins on isolated basal, luminal, and stem-cell like cells from breast cancer cell lines (Gupta et al., 2011). More recently, Morinishi et al. constructed an ODE model to describe cancer cell transitions between a more differentiated and a more stem-like state and experimentally estimated transition rates between the two cell states under different conditions with flow cytometric time course data (Morinishi et al., 2020). Modeling the temporal dynamics of key proteins that identify unique cancer cell states is critical to developing an understanding of the biological mechanisms of cancer. Integration of flow cytometric measurements into Markov and ODE models by Pisco et al. allowed them to reject the null hypothesis that drug resistance in leukemia arises purely from Darwinian selection by differential growth rates, lending support to the hypothesis that a drug-resistant cellular state is driven by chemotherapeutically activated cell state switching (Pisco et al., 2013).
Limitations of Using In Vitro Data for Modeling Cancer
Although there is ever-increasing availability and quality of quantitative biological data at the cellular scale, even the best designed experiments have intrinsic limitations owing to sample origin, choice of methodology, and complexity of data output. Targeted experimental assays quantify the expression of specific genes or proteins of interest, whereas global experimental assays have increased readouts, providing expression information for thousands of genes. Targeted experiments can define cell behavior and states for quantitative modeling but may limit the scope of the cellular states identified and oversimplify a complex state-space. Global experimental approaches can overcome this limitation by revealing the gene networks driving specific phenomena but add significant complexity in data analysis as it can be difficult to identify which signals are most relevant for describing the phenomena of interest. Similarly, experimental assays that pool groups of cells together (prior to, for example, quantifying gene or protein expression) are beneficial for investigating whole population differences but ignore the cellular diversity within groups of cells. This limitation is overcome in single cell analyses, including scRNA-seq and flow cytometry, which provide insight into the full distribution of individual cell phenotypes in a population, but do so at the cost of increased complexity and use of resources.
Cancer cell populations vary in both space and time, and mathematical models of these dynamics require data that are spatially and/or temporally resolved. Many in vitro assays (including those mentioned in section “Cellular Scale Data Appropriate for Incorporating into Mathematical Models of Cancer”) require analysis of experimental samples at specific time points, often in a destructive or disruptive manner. Although high-throughput assays can be performed at multiple time points, these temporal samplings may miss dynamics occurring more quickly than can be experimentally recovered. Time-resolved microscopy provides a means to overcome some of this limitation by enabling tracking of individual cells over time. This technology has been applied to quantify whole-cell population growth under various conditions and, with the addition of fluorescent (Weissman and Pan, 2015) or nucleotide (Al’Khafaji et al., 2018; Nguyen et al., 2014) labels, can enable tracking of distinct cell phenotypes and specific protein expression within cells. This information can then be used to inform models of population growth and treatment response, as well as cell state changes over time (Hsu et al., 2019; Johnson et al., 2019).
Mathematical Modeling of Cancer at the Microenvironmental and Tissue Scales
The Tumor Microenvironment and Cancer Development
Central to tumor growth is the interaction of cancer cells with non-malignant stromal cell populations and the local environment, collectively referred to as the tumor microenvironment (Hanahan and Coussens, 2012). Stromal cell populations, such as fibroblasts, immune infiltrates, or vascular endothelial cells, are recruited to the tumor site via the cytokine expression of cancer cells (Hanahan and Coussens, 2012; Junttila and de Sauvage, 2013). These cell populations impact the composition of the tumor microenvironment, from local extracellular matrix deposition to gradients in nutrient concentration, which subsequently influence cancer cell protein expression and behavior (Hanahan and Coussens, 2012; Junttila and de Sauvage, 2013). Thus, the tumor microenvironment is an important consideration when modeling tumor development. In this section, we highlight quantitative assays that characterize the spatial distribution of cancer and stromal cell populations as well as environmental quantities such as oxygen and growth factor concentration.
Microenvironmental and Tissue Scale Data Appropriate for Incorporating into Mathematical Models
Microscopy techniques, ranging from confocal and brightfield microscopy to whole slide imaging, offer quantitative in vitro and ex vivo measurements of many properties of the tumor microenvironment (Gurcan et al., 2009; Heindl et al., 2015; Saucedo et al., 2018). Used in combination with immunohistochemical or immunofluorescent staining, microscopy can measure the spatial distribution of different cancer and stromal cell types, as well as microenvironment components such as collagen fibers or microvasculature (Gurcan et al., 2009; Heindl et al., 2015; Saucedo et al., 2018). For example, immunohistochemical staining techniques can be used to identify the spatial distribution of proliferating or apoptotic cancer cell subpopulations, which can then be used to calibrate models of tumor growth. Confocal imaging of normal and mutant breast epithelial spheroids was employed by Rejniak et al. to stain for caspase-3 (apoptosis) and Ki-67 (proliferation) to calibrate an in silico model of tumor spheroid formation (Rejniak et al., 2010). The model was then used to determine potential mechanisms of morphological and molecular changes that lead to development of mutant breast epithelial cells (Rejniak et al., 2010). Ahmadzadeh et al. employed two-photon microscopy to measure spatial variations in collagen distribution within the extracellular matrix surrounding tumor spheroids (Ahmadzadeh et al., 2017). These data were then used to calibrate a mechanochemical free-energy based model that sought to describe the feedback loop between cell contractility and realignment of the extracellular matrix fibers (Ahmadzadeh et al., 2017).
Techniques coupling immunofluorescent staining with time-resolved microscopy can be used to longitudinally track fluorescently labeled cells. Studies have applied such in vitro data to develop in silico models of tumor growth and invasion (Cristini et al., 2005; Enmon et al., 2001; Frieboes et al., 2006; Kam et al., 2009; Liedekerke et al., 2019; Lorenzo et al., 2016; Macklin and Lowengrub, 2007; Sanga et al., 2007), cellular migration driven by the tumor microenvironment (Kim et al., 2018; Mark et al., 2018; Shamloo et al., 2016; Stokes et al., 1991), vasculogenesis (Merks et al., 2006; Serini et al., 2003; Shamloo et al., 2016), and drug response (Kozusko et al., 2001; Maffei et al., 2014; Raghavan et al., 2016). In particular, our group has developed a 3D in vitro vascularized microfluidic tumor platform to study angiogenic sprouting of an endothelial vessel (Gadde et al., 2020). We utilized confocal microscopy images of vessel sprouting in combination with an agent-based model (Phillips et al., 2020) to determine parameter values that govern the driving dynamics of the model (e.g., vessel growth rate, production rate of pro-angiogenic factors) (Figure 3). This calibrated model can then be used to make predictions of vascular structure in response to growth factors secreted by different tumor cell distributions in the in vitro platform.
Figure 3.

Model Calibration and Validation Pipeline
The left-most column shows the evolution of our agent-based model of tumor angiogenesis and the measured vessel segmented from confocal microscopy images (right column). We utilize the microscopy data from days 4 and 8 to calibrate key model parameters (e.g., production rate of VEGF) and then predict forward to day 12 where we can directly compare the predictions to the experimentally observed data. If the model is found to be invalid (i.e., if the predicted vasculature at day 12 does not appropriately recapitulate the observed data), the model must be modified by amending terms, parameters, or rules based on established biological principles. Once the model is calibrated and passes a validity test, the vasculature at day 16 is predicted with the calibrated parameters and compared with the data.
Histopathology analysis yields high-resolution brightfield or immunofluorescent images of tissue sections ex vivo (Gurcan et al., 2009). These sections are stained for markers of biological interest, including (for example) vessel maturation, immune infiltration, and proliferation (Gurcan et al., 2009; Heindl et al., 2015). Such measures can then be used to parameterize or validate models of tumor growth. Macklin et al. developed a patient-specific, agent-based model parameterized by clinically available histopathology data and accurately predicted the growth of ductal carcinoma in situ based on underlying cellular phenomena (Macklin et al., 2012). Similarly, Jarrett et al. developed a model of HER2+ cancer that accounted for the immune response to targeted therapy. In their model, they employed histological data to assign values for tumor necrosis within the model and then compared the predicted immune response with immunofluorescent images of immune infiltration (Jarrett et al., 2019). This mathematical-experimental approach was able to accurately model tumor response, with a CCC = 0.90 for treated tumor volumes, as well as identify interactions between tumor response, immune cells, and vascular development, interactions that would be challenging to elucidate only through experimentation.
Although immunohistochemistry staining of in vitro tumor models and ex vivo tumor samples can be used to quantify nutrient, cytokine, or drug distributions across a tissue, ELISAs, western blots, and protein arrays offer more accessible acquisition of similar information from bulk tissue samples. By employing time resolved microscopy and cytokine multiplex array in a microfluidic tumor model, Lee et al. developed an in silico model that couples chemokine-mediated signaling with mechanosensing to determine the influence of interstitial flow on migration of macrophages in the tumor microenvironment (Lee et al., 2020). Göttlich et al. used in vitro data from immunofluorescence, ELISA, western blot, and phosphokinase arrays from a 3D lung model to generate cell specific in silico models for use in drug effect prediction and patient stratification in treatment of lung cancer (Göttlich et al., 2018). A similar approach was utilized by Baur et al. for colorectal cancer application (Baur et al., 2019).
Limitations of Using In Vitro and Ex Vivo Data for Modeling Cancer
Calibrating biologically based, mathematical models often requires data obtained at multiple time points, whereas many biological assays measure quantities of interest at few or single time points. This limitation can be overcome, in part, by employing dynamic assays, such as time-resolved microscopy, but there are still constraints. For example, fluorescent assays often stain for only one or two markers of interest at a time and the continuous exposure of cells to the lasers used in confocal microscopy can result in cell death via phototoxicity. Additionally, biological data points defined using small sample sizes will have greater uncertainty in their measurements. For example, tumor heterogeneity provides a significant challenge in the calibration of tissue scale tumor models, as many mathematical parameters (e.g., cell growth rate) can vary depending on cell type, and heterogeneity can exist within cell populations of a cell line (Almendro et al., 2013). Furthermore, bridging the gap between the in vitro and in vivo settings is non-trivial owing to the fundamental differences in in vitro and in vivo experimental design. Thus, it is an open problem in the field as to how mathematical models that are calibrated with in vitro data can provide insight into in vivo systems. Adaption of newer technologies, such as microfluidic tumor- or organ-on-a-chip systems and 3D bioprinting, present means by which researchers can perform in vitro and ex vivo work in settings that are more comparable with the in vivo system. In particular, microfluidic platforms have revealed insight into metastatic cascade, cell migration, transport of anticancer agents, and even in predictive application for determination of tumor response to cancer treatments (Belgodere et al., 2018; Roberts et al., 2019; Sun et al., 2019; Trujillo-de Santiago et al., 2019). 3D bioprinting allows for fine control over the recreation of the tumor microenvironment (including the structural and compositional heterogeneity [Belgodere et al., 2018; Heinrich et al., 2019; Langer et al., 2019; Ma et al., 2018]) resulting in in vitro models that are realistic representations of an in vivo tumor.
Mathematical Modeling of Cancer at the Tissue and Organ Scales
Cancer Physiology at the Tissue and Organ Scale
Although the spatial scales of in vivo assessments of tumor physiology are typically limited to 0.25–5 mm (Frangioni, 2008; Ramamonjisoa and Ackerstaff, 2017), these techniques do enable measurement of temporal dynamics within the tumor microenvironment (Yankeelov et al., 2016b), such as vascular perfusion (Yankeelov et al., 2014; Yankeelov and Gore, 2009), metabolic activity(Castell and Cook, 2008), or interstitial flow (Kingsmore et al., 2018; LoCastro et al., 2020). These data types can also be acquired in 3D to evaluate an entire tumor volume, permitting investigation of regional differences within a tumor (e.g., regions of necrosis or proliferation, gradients of oxygen or nutrients) (Kim and Gatenby, 2017; Syed et al., 2020). Additionally, in vivo measurements can be acquired longitudinally within the same subject, thereby providing temporally and spatially resolved data critical for the calibration of spatiotemporal models of tumor progression (Hormuth et al., 2019b). The next section introduces several established techniques for imaging of tissue and incorporating such data into biologically based models of cancer.
Tissue and Organ Scale Data Appropriate for Incorporating into Mathematical Models
Magnetic resonance imaging (MRI), positron emission tomography (PET), and X-ray computed tomography (CT) are in vivo imaging techniques that characterize a myriad of tumor features. These include measures of size and shape (used clinically to assess treatment response [Nishino et al., 2010]), as well as more advanced measurements of cellularity (Padhani et al., 2009), vascularity (Yankeelov and Gore, 2009), and metabolic activity (Castell and Cook, 2008; Rajendran and Krohn, 2015) that can report more specifically on tumor status. As these data can provide longitudinal and 3D evaluations of tumors, they are excellent candidates for initializing, parameterizing, and validating mechanism-based models of tumor growth (Hormuth et al., 2019a).
Contrast-enhanced CT and MRI techniques (i.e., studies in which a contrast agent is injected into the patient to highlight differences between diseased and healthy tissue) as well as anatomical MRI (Figure 4A) are considered anatomical imaging techniques. These data types are commonly used to assess the extent of clinical (or bulk) tumor burden (e.g., longest dimension and volume), subclinical (or invasive) tumor burden, and vasogenic edema (Eisenhauer et al., 2009; Mabray et al., 2015). Additionally, healthy tissues such as white matter, gray matter, muscle, adipose, or fibro glandular tissue also may be identified from these images. Such data have been used to parameterize models of tumor growth and metastasis (Hormuth et al., 2019b; Neal et al., 2013; Yamamoto et al., 2019).
Figure 4.

Representative Images from a Murine Model of Glioma
(A) Contrast-enhanced magnetic resonance image with the brain indicated by the dashed box. (B and C) Transformation of DW-MRI estimates of ADC (B) to cellularity (C). Likewise, (E) and (F) illustrate the transformation of DCE-MRI data (E) to blood volume fraction maps (F). Specifically, (E) shows a representative voxel signal intensity time course from within the tumor, which can then be analyzed to estimate the blood volume fraction. These measurements are then used to parameterize a mathematical model of tumor growth and angiogenesis. Using imaging time points not included in model calibration, the error is then assessed between predicted and measured tumor growth (D and G).
Diffusion-weighted (DW) MRI can provide both anatomical information (e.g., white matter fiber tracks) and physiological measures (e.g., cellularity, necrosis, edema) (Padhani et al., 2009). Briefly, DW-MRI techniques return estimates of the diffusion of water molecules in tissues called the apparent diffusion coefficient (ADC). As the ADC is heavily restricted by cell membranes, it has been used as a surrogate for cellularity within the tumor tissue (Hormuth et al., 2020) (Figure 4B). Measures of cellularity derived from DW-MRI have been employed to initialize and validate models of preclinical glioma (Atuegwu et al., 2012; Hormuth et al., 2017) and clinical breast (Atuegwu et al., 2013; Weis et al., 2015) tumor growth. For example, Weis et al. used DW-MRI estimates of cellularity before and following one cycle of therapy to calibrate a model to predict the pathological complete response of breast tumors to neoadjuvant therapy at the time of surgery (Weis et al., 2015).
18F-flourodeoxyglucose (18F-FDG) is a glucose analog that is metabolically trapped when internalized and phosphorylated by cells, resulting in an accumulation in cells actively consuming glucose. Thus,18F-FDG-PET imaging is used to assess tumor glucose metabolism (Castell and Cook, 2008) and has been employed to assign and calibrate cell proliferation rates in models of tumor growth (Liu et al., 2014). Liu et al. used 18F-FDG to estimate tumor cell proliferation in a mathematical model of pancreatic tumor growth (Liu et al., 2014). Images collected at baseline and at the first follow-up were used to calibrate model parameters, and then the individualized parameters were used to predict tumor growth at the time of the second follow-up, showing a high degree of accuracy between the predicted and observed tumor at the second follow-up for each patient.
Dynamic contrast-enhanced (DCE) MRI can provide measures of healthy and diseased vasculature (Yankeelov and Gore, 2009). In DCE-MRI, several images are collected before, during, and after the injection of a contrast agent, resulting in changes in signal intensity as a function of the concentration of the contrast agent. These signal intensity dynamics can be analyzed with pharmacokinetic models to estimate perfusion, vascular permeability, blood volume, blood flow, and tissue volume fractions. These measures of tumor vasculature (Figure 4E) can be incorporated into models of tumor growth and angiogenesis (Hormuth et al, 2019, 2020). For example, Hormuth et al. used DCE-MRI estimates of blood volume to initialize and calibrate a coupled biophysical model of tumor growth and angiogenesis in a murine model of glioma (Hormuth et al., 2019). They were able to spatially and temporally evolve proliferation and carrying capacity values in response to changes in the local blood volume fraction, achieving a high degree of agreement with less than 10% error between voxel-level predictions and experimental measurements.
Finally, there are several additional MRI and PET techniques not typically collected clinically that measure physiological characteristics that may be valuable for modeling approaches. For example, there exist approaches that measure proliferation (Woolf et al., 2014), pH (Rata et al., 2014), metabolic hallmarks (Sinha and Sinha, 2009), receptor status (Mortimer et al., 2018), and mechanical properties (Glaser et al., 2012). 18F-fluoromisonidazole (18F-FMISO) is a PET tracer (Rajendran and Krohn, 2015) used to visualize tissue hypoxia, a phenomena highly associated with resistance to radiation therapy (Gilkes, 2019). Rockne et al. incorporated measures of hypoxia from 18F-FMISO-PET imaging into patient-specific models of glioblastoma growth to inform the spatial variation in radiation sensitivity for informing more accurate predictions of tumor response to radiation therapy (Rockne et al., 2015). Integration of these MRI and PET-derived measurements with mathematical modeling will provide a better understanding of tumor dynamics in vivo.
Limitations of Using In Vivo Data for Modeling Cancer
One primary limitation of using these data to calibrate mechanism-based mathematical models can be lack of clarity associated with their interpretations. For example, in anatomical imaging, changes in steroid dose or treatment-related reactions can result in transient changes in tumor appearance that are related to neither progression nor regression (Hygino da Cruz et al., 2011). Similarly, although several studies have shown that the ADC correlates inversely with tissue cellularity (Anderson et al., 2000; Barnes et al., 2015; Sugahara et al., 1999), other factors such as cell size, cell permeability, and tissue tortuosity (all of which can change during treatment) also influence ADC values. Similar limitations exist for FDG-PET (false positives can result because of macrophage infiltration [Strauss, 1996]) and for FMISO-PET (false negatives seen within necrotic, non-viable tissue [Hirata et al., 2019]).
A second fundamental limitation of employing in vivo imaging to calibrate mechanism-based models of tumor growth and treatment response is due to the achievable spatial resolution of these techniques. In the clinical setting, anatomical MRI typically produces images with a voxel resolution on the order of 1 mm3, whereas the more quantitative approaches (e.g., DW- and DCE-MRI) may only achieve a resolution of approximately 10 mm3. Similarly, the voxels in PET images are approximately 500 mm3 (Frangioni, 2008). These spatial resolutions limit our ability to quantitatively interrogate tumor features in detail. For example, MRI is unable to capture the microscopic invasion of a glioma (Figure 4) at the tumor margins. Additionally, with a voxel size of 10 mm3, small vessels simply cannot be detected, which will directly affect generated maps of tumor-associated vasculature as well as the characterization of perfusion. Thus, if these parameters are used to approximate (for example) systemic drug delivery, it may result in predictions that over- or underestimate actual tumor response owing to the coarseness of the estimate at which the drug distribution profile can be estimated.
Emerging Applications for Practical Mathematical Modeling
Given a mathematical model that is capable of recapitulating the spatial and temporal development of a tumor undergoing treatment, the model can then be used to optimize the delivery of treatment with the goal of optimizing patient outcomes. This can be achieved by systematically varying (in silico) treatment options and schedules, dosing regimens, or the effect of mechanisms of interest. These in silico tests are a practical and direct method for replacing the trial-and-error approach that is the current paradigm for clinical oncology with a more rigorous approach. Indeed, without a mathematical theory, we are left with trial and error—and given the complex landscape of variables and parameters required to devise an effective treatment plan, there are simply not enough patients or resources to run all the clinical trials that would be required to adequately search that space. The integration of quantitative biological assays with biologically based mathematical modeling is one practical way to move the field from population-based trial and error to patient-specific optimized therapy. Furthermore, optimal control theory has been gaining increasing attention to formulate personalized therapeutic regimens by integrating a biologically based mathematical model of cancer with knowledge of drug pharmacodynamics (Jarrett et al., 2020a). This approach was leveraged by Angaroni et al. to determine optimal personalized regimens of imatinib for CML, aiming to minimize drug exposure and cancer stem cell burden (Angaroni et al., 2020). To this end, the authors developed an ODE model of CML, calibrated with longitudinal measurements of cancer cell burden, as well as personalized pharmacokinetic and pharmacodynamic models of imatinib. Their results suggest that the optimal imatinib therapies can render an improved control of the cancer cell burden with similar or lower drug exposures with respect to standard scheduling for most patients in the study cohort.
Biology-based models enable the transformation of measured data samples into mechanistically interpretable parameters and variables, which help to quantitatively analyze the investigated cancer mechanisms and further guide new research directions (Ayuso et al., 2017; Jarrett et al., 2020b; Johnson et al., 2019, Johnson et al., 2020; Lorenzo et al, 2019b, 2020; Merkher et al., 2020; Morken et al., 2014; Pérez-García et al., 2019; Wang et al., 2006). Moreover, mathematical models parameterized by biological data need not be comprehensive to make to gain insight into underlying tumor dynamics and make valid predictions. For example, studies investigating scaling laws (Pérez-García et al., 2020) and metastasis (Yamamoto et al., 2019) made use of only volumetric measurements from imaging data to model longitudinal tumor growth and response. Additionally, serum prostate-specific antigen (PSA) is a standard clinical measure for patients with prostate cancer undergoing treatment and has been used to parameterize patient-specific models of prostate cancer response. For instance, Brady-Nicholls et al. modeled PSA dynamics for adaptive response prediction of patients with prostate cancer who may be resistant to intermittent androgen deprivation therapy (Brady-Nicholls et al., 2020). Lorenzo et al. proposed an ODE model for the dynamics of PSA after external beam radiotherapy, leveraging clinical PSA data series to calibrate their model and extract a reduced set of patient-specific parameters describing cancer cell proliferation and radiation effects (Lorenzo et al., 2019b). These parameters were then used to define biomarkers to successfully identify tumor recurrence. This study suggests that model-inspired biomarkers may enable the identification of recurring tumors earlier than using standard increasing PSA criteria, thereby extending the window of curability with a secondary treatment.
Bridging the data from cellular to tissue scale models remains a fundamental challenge in biologically based mathematical modeling (Alber et al., 2019; Rockne et al., 2019). Multiscale models seek to simultaneously capture cancer dynamics at both the micro- and macroscale by coupling submodels representing different features of cancer mechanisms at either scale (Deisboeck et al., 2011; Yankeelov et al., 2016a). This strategy has been exploited to model angiogenesis and the motility of invasive cancer cells resulting from epithelial-to-mesenchymal transition (Deisboeck et al., 2011; Vilanova et al., 2017). In both cases, multiscale models track the movement and action of specific cells in response to the local values of macroscopic variables, which usually describe the dynamics of the tumor bulk and key substances (e.g., VEGF, nutrients). In turn, the behavior of these individually tracked cells alter the dynamics of these macroscopic variables. For example, in multiscale cancer models featuring angiogenesis, tumors grow and hypoxic tumor regions progressively vanish as nutrient concentrations increase owing to the sprouting angiogenic vasculature driven by tip endothelial cells, which are activated and consume VEGF released by hypoxic tumor cells. Still, this approach faces two central limitations: the requirement of extensive computational resources and the large number of free parameters whose precise calibration may prove challenging. A primary barrier in the development of these models is finding the balance between mathematical complexity and modeling of relevant processes, particularly processes that can be parameterized with acquirable biological data. Thus, it is of central importance to work with the most parsimonious mathematical model as identified through established model selection schemes (Benzekry et al., 2014; Lima et al., 2016).
Conclusion
We have provided an overview of a number of common experimental assays that quantitatively distinguish tumor characteristics from the molecular to tissue scales and how such data can be directly integrated into biologically based, mathematical models to forecast tumor growth and treatment response in time and space. A summary of the relative strengths and limitations of integrating experimental data and mechanism-based, mathematical modeling of each biological scale is summarized in Table 1. Ultimately, when data and models are successfully combined—in ways that account for the uncertainty in the biological and mathematical strategies—it yields an experimental-mathematical framework with the ability to lower experiment costs, shorten experiment timelines, and maximize both scientific understanding and predictive capabilities. Although the field is still quite young, the early successes strongly suggest that this is an extremely promising direction of investigation that can yield practical insights into both experimental design for cancer biology and patient care for clinical oncology.
Table 1.
Strengths and Limitations of Integrating Experimental Data and Mathematical Modeling at Each Biological Scale
| Scale | Cellular | Microenvironmental to Tissue Scales | Tissue to Organ Scales |
|---|---|---|---|
| Measures of |
|
|
|
| Experimental assays |
|
|
|
| Strengths |
|
|
|
| Limitations |
|
|
|
Acknowledgments
We thank the National Cancer Institute for funding via U01CA142565, U01CA174706, R01CA186193, U24CA226110, R01CA235800, R01CA240589, R01CA226258 (to A.B.) and R21CA212928 (to A.B.). We thank the National Institute of Biomedical Imaging and Bioengineering for support through T32 EB007507. We thank the Cancer Prevention and Research Institute of Texas (CPRIT) for funding through RR160005. T.E.Y. is a CPRIT Scholar in Cancer Research.
Author Contributions
Writing – Original Draft, A.S.K., M.G., A.G., D.A.H., A.M.J., K.E.J., E.A.B.F.L., G.L., C.P.; Writing – Review & Editing, A.S.K., M.G., A.B., T.E.Y.; Visualization, A.S.K., A.G., D.A.H., K.E.J., C.P.; Supervision, T.E.Y.; Funding Acquisition, A.B., T.E.Y.; Graphical Abstract, A.S.K.
References
- Ahmadzadeh H., Webster M.R., Behera R., Jimenez Valencia A.M., Wirtz D., Weeraratna A.T., Shenoy V.B. Modeling the two-way feedback between contractility and matrix realignment reveals a nonlinear mode of cancer cell invasion. Proc. Natl. Acad. Sci. U S A. 2017;114:E1617–E1626. doi: 10.1073/pnas.1617037114. [DOI] [PMC free article] [PubMed] [Google Scholar]
- Alber M., Buganza Tepole A., Cannon W.R., De S., Dura-Bernal S., Garikipati K., Karniadakis G., Lytton W.W., Perdikaris P., Petzold L., Kuhl E. Integrating machine learning and multiscale modeling—perspectives, challenges, and opportunities in the biological, biomedical, and behavioral sciences. NPJ Digit. Med. 2019;2:1–11. doi: 10.1038/s41746-019-0193-y. [DOI] [PMC free article] [PubMed] [Google Scholar]
- Al’Khafaji A.M., Deatherage D., Brock A. Control of lineage-specific gene expression by functionalized gRNA barcodes. ACS Synth. Biol. 2018;7:2468–2474. doi: 10.1021/acssynbio.8b00105. [DOI] [PMC free article] [PubMed] [Google Scholar]
- Almendro V., Marusyk A., Polyak K. Cellular heterogeneity and molecular evolution in cancer. Annu. Rev. Pathol. Mech. Dis. 2013;8:277–302. doi: 10.1146/annurev-pathol-020712-163923. [DOI] [PubMed] [Google Scholar]
- Altrock P.M., Liu L.L., Michor F. The mathematics of cancer: integrating quantitative models. Nat. Rev. Cancer. 2015;15:730–745. doi: 10.1038/nrc4029. [DOI] [PubMed] [Google Scholar]
- Alvarez-Garcia V., Bartos C., Keraite I., Trivedi U., Brennan P.M., Kersaudy-Kerhoas M., Gharbi K., Oikonomidou O., Leslie N.R. A simple and robust real-time qPCR method for the detection of PIK3CA mutations. Sci. Rep. 2018;8:4290. doi: 10.1038/s41598-018-22473-9. [DOI] [PMC free article] [PubMed] [Google Scholar]
- Anderson A.W., Xie J., Pizzonia J., Bronen R.A., Spencer D.D., Gore J.C. Effects of cell volume fraction changes on apparent diffusion in human cells. Magn. Reson. Imaging. 2000;18:689–695. doi: 10.1016/s0730-725x(00)00147-8. [DOI] [PubMed] [Google Scholar]
- Angaroni F., Graudenzi A., Rossignolo M., Maspero D., Calarco T., Piazza R., Montangero S., Antoniotti M. An optimal control framework for the automated design of personalized cancer treatments. Front. Bioeng. Biotechnol. 2020;8:523. doi: 10.3389/fbioe.2020.00523. [DOI] [PMC free article] [PubMed] [Google Scholar]
- Atuegwu N.C., Arlinghaus L.R., Li X., Chakravarthy A.B., Abramson V.G., Sanders M.E., Yankeelov T.E. Parameterizing the logistic model of tumor growth by DW-MRI and DCE-MRI data to predict treatment response and changes in breast cancer cellularity during neoadjuvant chemotherapy. Transl. Oncol. 2013;6:256–264. doi: 10.1593/tlo.13130. [DOI] [PMC free article] [PubMed] [Google Scholar]
- Atuegwu N.C., Colvin D.C., Loveless M.E., Xu L., Gore J.C., Yankeelov T.E. Incorporation of diffusion weighted magnetic resonance imaging data into a simple mathematical model of tumor growth. Phys. Med. Biol. 2012;57:225–240. doi: 10.1088/0031-9155/57/1/225. [DOI] [PMC free article] [PubMed] [Google Scholar]
- Ayuso J.M., Monge R., Martínez-González A., Virumbrales-Muñoz M., Llamazares G.A., Berganzo J., Hernández-Laín A., Santolaria J., Doblaré M., Hubert C. Glioblastoma on a microfluidic chip: generating pseudopalisades and enhancing aggressiveness through blood vessel obstruction events. Neuro-oncology. 2017;19:503–513. doi: 10.1093/neuonc/now230. [DOI] [PMC free article] [PubMed] [Google Scholar]
- Barnes S.L., Sorace A.G., Loveless M.E., Whisenant J.G., Yankeelov T.E. Correlation of tumor characteristics derived from DCE-MRI and DW-MRI with histology in murine models of breast cancer. NMR Biomed. 2015;28:1345–1356. doi: 10.1002/nbm.3377. [DOI] [PMC free article] [PubMed] [Google Scholar]
- Baur F., Nietzer S.L., Kunz M., Saal F., Jeromin J., Matschos S., Linnebacher M., Walles H., Dandekar T., Dandekar G. Connecting cancer pathways to tumor engines: a stratification tool for colorectal cancer combining human in vitro tissue models with boolean in silico models. Cancers (Basel) 2019;12 doi: 10.3390/cancers12010028. [DOI] [PMC free article] [PubMed] [Google Scholar]
- Becht E., McInnes L., Healy J., Dutertre C.-A., Kwok I.W.H., Ng L.G., Ginhoux F., Newell E.W. Dimensionality reduction for visualizing single-cell data using UMAP. Nat. Biotechnol. 2019;37:38–44. doi: 10.1038/nbt.4314. [DOI] [PubMed] [Google Scholar]
- Beerenwinkel N., Antal T., Dingli D., Traulsen A., Kinzler K.W., Velculescu V.E., Vogelstein B., Nowak M.A. Genetic progression and the waiting time to cancer. PLoS Comput. Biol. 2007;3:e225. doi: 10.1371/journal.pcbi.0030225. [DOI] [PMC free article] [PubMed] [Google Scholar]
- Belgodere J.A., King C.T., Bursavich J.B., Burow M.E., Martin E.C., Jung J.P. Engineering breast cancer microenvironments and 3D bioprinting. Front. Bioeng. Biotechnol. 2018;6:66. doi: 10.3389/fbioe.2018.00066. [DOI] [PMC free article] [PubMed] [Google Scholar]
- Benzekry S., Lamont C., Beheshti A., Tracz A., Ebos J.M.L., Hlatky L., Hahnfeldt P. Classical mathematical models for description and prediction of experimental tumor growth. PLoS Comput. Biol. 2014;10:e1003800. doi: 10.1371/journal.pcbi.1003800. [DOI] [PMC free article] [PubMed] [Google Scholar]
- Bouhaddou M., Barrette A.M., Stern A.D., Koch R.J., DiStefano M.S., Riesel E.A., Santos L.C., Tan A.L., Mertz A.E., Birtwistle M.R. A mechanistic pan-cancer pathway model informed by multi-omics data interprets stochastic cell fate responses to drugs and mitogens. PLoS Comput. Biol. 2018;14:e1005985. doi: 10.1371/journal.pcbi.1005985. [DOI] [PMC free article] [PubMed] [Google Scholar]
- Boussommier-Calleja A. Chapter 4.1 - in vitro models of cancer. In: Ladame S., Chang J.Y.H., editors. Bioengineering Innovative Solutions for Cancer. Academic Press; 2020. pp. 273–325. [DOI] [Google Scholar]
- Brady-Nicholls R., Nagy J.D., Gerke T.A., Zhang T., Wang A.Z., Zhang J., Gatenby R.A., Enderling H. Prostate-specific antigen dynamics predict individual responses to intermittent androgen deprivation. Nat. Commun. 2020;11:1750. doi: 10.1038/s41467-020-15424-4. [DOI] [PMC free article] [PubMed] [Google Scholar]
- Brock A., Chang H., Huang S. Non-genetic heterogeneity — a mutation-independent driving force for the somatic evolution of tumours. Nat. Rev. Genet. 2009;10:336–342. doi: 10.1038/nrg2556. [DOI] [PubMed] [Google Scholar]
- Castell F., Cook G.J.R. Quantitative techniques in 18FDG PET scanning in oncology. Br. J. Cancer. 2008;98:1597–1601. doi: 10.1038/sj.bjc.6604330. [DOI] [PMC free article] [PubMed] [Google Scholar]
- Chowell D., Napier J., Gupta R., Anderson K.S., Maley C.C., Sayres M.A.W. Modeling the subclonal evolution of cancer cell populations. Cancer Res. 2018;78:830–839. doi: 10.1158/0008-5472.CAN-17-1229. [DOI] [PMC free article] [PubMed] [Google Scholar]
- Coveney P.V., Dougherty E.R., Highfield R.R. Big data need big theory too. Philos. Trans. A Math. Phys. Eng. Sci. 2016;374 doi: 10.1098/rsta.2016.0153. [DOI] [PMC free article] [PubMed] [Google Scholar]
- Cristini V., Frieboes H.B., Gatenby R., Caserta S., Ferrari M., Sinek J. Morphologic instability and cancer invasion. Clin. Cancer Res. 2005;11:6772–6779. doi: 10.1158/1078-0432.CCR-05-0852. [DOI] [PubMed] [Google Scholar]
- De Palma M., Biziato D., Petrova T.V. Microenvironmental regulation of tumour angiogenesis. Nat. Rev. Cancer. 2017;17:457–474. doi: 10.1038/nrc.2017.51. [DOI] [PubMed] [Google Scholar]
- Deisboeck T.S., Wang Z., Macklin P., Cristini V. Multiscale cancer modeling. Annu. Rev. Biomed. Eng. 2011;13:127–155. doi: 10.1146/annurev-bioeng-071910-124729. [DOI] [PMC free article] [PubMed] [Google Scholar]
- Eisenhauer E.A., Therasse P., Bogaerts J., Schwartz L.H., Sargent D., Ford R., Dancey J., Arbuck S., Gwyther S., Mooney M. New response evaluation criteria in solid tumours: revised RECIST guideline (version 1.1) Eur. J. Cancer. 2009;45:228–247. doi: 10.1016/j.ejca.2008.10.026. [DOI] [PubMed] [Google Scholar]
- Enmon R.M., O’Connor K.C., Lacks D.J., Schwartz D.K., Dotson R.S. Dynamics of spheroid self-assembly in liquid-overlay culture of DU 145 human prostate cancer cells. Biotechnol. Bioeng. 2001;72:579–591. doi: 10.1002/1097-0290(20010320)72:6<579::AID-BIT1023>3.0.CO;2-L. [DOI] [PubMed] [Google Scholar]
- Fillmore C.M., Kuperwasser C. Human breast cancer cell lines contain stem-like cells that self-renew, give rise to phenotypically diverse progeny and survive chemotherapy. Breast Cancer Res. 2008;10:R25. doi: 10.1186/bcr1982. [DOI] [PMC free article] [PubMed] [Google Scholar]
- Frangioni J.V. New technologies for human cancer imaging. J. Clin. Oncol. 2008;26:4012–4021. doi: 10.1200/JCO.2007.14.3065. [DOI] [PMC free article] [PubMed] [Google Scholar]
- Frieboes H.B., Zheng X., Sun C.-H., Tromberg B., Gatenby R., Cristini V. An integrated computational/experimental model of tumor invasion. Cancer Res. 2006;66:1597–1604. doi: 10.1158/0008-5472.CAN-05-3166. [DOI] [PubMed] [Google Scholar]
- Gadde M., Marrinan D., Michna R.J., Rylander M.N. Three dimensional in vitro tumor platforms for cancer discovery. In: Soker S., Skardal A., editors. Tumor Organoids, Cancer Drug Discovery and Development. Springer International Publishing; 2018. pp. 71–94. [Google Scholar]
- Gadde M., Phillips C., Ghousifam N., Sorace A.G., Wong E., Krishnamurthy S., Syed A., Rahal O., Yankeelov T.E., Woodward W.A., Rylander M.N. Vitro vascularized tumor platform for modeling tumor-vasculature interactions of inflammatory breast cancer. arXiv. 2020 doi: 10.1002/bit.27487. arXiv:1809.06312 [DOI] [PMC free article] [PubMed] [Google Scholar]
- Gilkes D.M., editor. Hypoxia and Cancer Metastasis, Advances in Experimental Medicine and Biology. Springer International Publishing; 2019. [DOI] [Google Scholar]
- Glaser K.J., Manduca A., Ehman R.L. Review of MR elastography applications and recent developments. J. Magn. Reson. Imaging. 2012;36:757–774. doi: 10.1002/jmri.23597. [DOI] [PMC free article] [PubMed] [Google Scholar]
- Göttlich C., Kunz M., Zapp C., Nietzer S.L., Walles H., Dandekar T., Dandekar G. A combined tissue-engineered/in silico signature tool patient stratification in lung cancer. Mol. Oncol. 2018;12:1264–1285. doi: 10.1002/1878-0261.12323. [DOI] [PMC free article] [PubMed] [Google Scholar]
- Gruber M., Bozic I., Leshchiner I., Livitz D., Stevenson K., Rassenti L., Rosebrock D., Taylor-Weiner A., Olive O., Goyetche R. Growth dynamics in naturally progressing chronic lymphocytic leukaemia. Nature. 2019;570:474–479. doi: 10.1038/s41586-019-1252-x. [DOI] [PMC free article] [PubMed] [Google Scholar]
- Gupta P.B., Fillmore C.M., Jiang G., Shapira S.D., Tao K., Kuperwasser C., Lander E.S. Stochastic state transitions give rise to phenotypic equilibrium in populations of cancer cells. Cell. 2011;146:633–644. doi: 10.1016/j.cell.2011.07.026. [DOI] [PubMed] [Google Scholar]
- Gurcan M.N., Boucheron L., Can A., Madabhushi A., Rajpoot N., Yener B. Histopathological image analysis: a review. IEEE Rev. Biomed. Eng. 2009;2:147–171. doi: 10.1109/RBME.2009.2034865. [DOI] [PMC free article] [PubMed] [Google Scholar]
- Hanahan D., Coussens L.M. Accessories to the crime: functions of cells recruited to the tumor microenvironment. Cancer Cell. 2012;21:309–322. doi: 10.1016/j.ccr.2012.02.022. [DOI] [PubMed] [Google Scholar]
- Hanahan D., Weinberg R.A. Hallmarks of cancer: the next generation. Cell. 2011;144:646–674. doi: 10.1016/j.cell.2011.02.013. [DOI] [PubMed] [Google Scholar]
- Hardeman K.N., Peng C., Paudel B.B., Meyer C.T., Luong T., Tyson D.R., Young J.D., Quaranta V., Fessel J.P. Nature Publishing Group; 2017. Dependence on Glycolysis Sensitizes BRAF-Mutated Melanomas for Increased Response to Targeted BRAF Inhibition; pp. 1–9. [DOI] [PMC free article] [PubMed] [Google Scholar]
- Heindl A., Nawaz S., Yuan Y. Mapping spatial heterogeneity in the tumor microenvironment: a new era for digital pathology. Lab. Invest. 2015;95:377–384. doi: 10.1038/labinvest.2014.155. [DOI] [PubMed] [Google Scholar]
- Heinrich M.A., Bansal R., Lammers T., Zhang Y.S., Schiffelers R.M., Prakash J. 3D-Bioprinted mini-brain: a glioblastoma model to study cellular interactions and therapeutics. Adv. Mater. 2019;31:1806590. doi: 10.1002/adma.201806590. [DOI] [PubMed] [Google Scholar]
- Hirata K., Yamaguchi S., Shiga T., Kuge Y., Tamaki N. The roles of hypoxia imaging using 18F-fluoromisonidazole positron emission tomography in glioma treatment. J. Clin. Med. 2019;8:1088. doi: 10.3390/jcm8081088. [DOI] [PMC free article] [PubMed] [Google Scholar]
- Hoarau-Véchot J., Rafii A., Touboul C., Pasquier J. Halfway between 2D and animal models: are 3D cultures the ideal tool to study cancer-microenvironment interactions? Int. J. Mol. Sci. 2018;19 doi: 10.3390/ijms19010181. [DOI] [PMC free article] [PubMed] [Google Scholar]
- Hormuth David A., Jarrett A.M., Feng X., Yankeelov T.E. Calibrating a predictive model of tumor growth and angiogenesis with quantitative MRI. Ann. Biomed. Eng. 2019;47:1539–1551. doi: 10.1007/s10439-019-02262-9. [DOI] [PMC free article] [PubMed] [Google Scholar]
- Hormuth David A., Jarrett A.M., Lima E.A.B.F., McKenna M.T., Fuentes D.T., Yankeelov T.E. Mechanism-based modeling of tumor growth and treatment response constrained by multiparametric imaging data. JCO Clin. Cancer Inform. 2019:1–10. doi: 10.1200/CCI.18.00055. [DOI] [PMC free article] [PubMed] [Google Scholar]
- Hormuth D.A., Jarrett A.M., Yankeelov T.E. Forecasting tumor and vasculature response dynamics to radiation therapy via image based mathematical modeling. Radiat. Oncol. 2020;15:4. doi: 10.1186/s13014-019-1446-2. [DOI] [PMC free article] [PubMed] [Google Scholar]
- Hormuth David A., McKenna M.T., Yankeelov T.E. Quantitative imaging to guide mechanism-based modeling of cancer. In: Li R., Xing L., Napel S., Rubin D.L., editors. Radiomics and Radiogenomics. Chapman and Hall/CRC, Boca Raton, FL. CRC Press, Taylor & Francis Group; 2019. pp. 369–385. [DOI] [Google Scholar]
- Hormuth D.A., Weis J.A., Barnes S.L., Miga M.I., Rericha E.C., Quaranta V., Yankeelov T.E. A mechanically coupled reaction–diffusion model that incorporates intra-tumoural heterogeneity to predict in vivo glioma growth. J. R. Soc. Interf. 2017;14:20161010. doi: 10.1098/rsif.2016.1010. [DOI] [PMC free article] [PubMed] [Google Scholar]
- Hsu C.-H., Altschuler S.J., Wu L.F. Patterns of early p21 dynamics determine proliferation-senescence cell fate after chemotherapy. Cell. 2019;178:361–373.e12. doi: 10.1016/j.cell.2019.05.041. [DOI] [PMC free article] [PubMed] [Google Scholar]
- Hygino da Cruz L.C., Rodriguez I., Domingues R.C., Gasparetto E.L., Sorensen A.G. Pseudoprogression and pseudoresponse: imaging challenges in the assessment of posttreatment glioma. Am. J. Neuroradiol. 2011;32:1978–1985. doi: 10.3174/ajnr.A2397. [DOI] [PMC free article] [PubMed] [Google Scholar]
- Jarrett A.M., Bloom M.J., Godfrey W., Syed A.K., Ekrut D.A., Ehrlich L.I., Yankeelov T.E., Sorace A.G. Mathematical modelling of trastuzumab-induced immune response in an in vivo murine model of HER2+ breast cancer. Math. Med. Biol. 2019;36:381–410. doi: 10.1093/imammb/dqy014. [DOI] [PMC free article] [PubMed] [Google Scholar]
- Jarrett A.M., Faghihi D., Ii D.A.H., Lima E.A.B.F., Virostko J., Biros G., Patt D., Yankeelov T.E. Optimal control theory for personalized therapeutic regimens in oncology: background, history, challenges, and opportunities. JCM. 2020;9:1314. doi: 10.3390/jcm9051314. [DOI] [PMC free article] [PubMed] [Google Scholar]
- Jarrett A.M., Hormuth D.A., Barnes S.L., Feng X., Huang W., Yankeelov T.E. Incorporating drug delivery into an imaging-driven, mechanics-coupled reaction diffusion model for predicting the response of breast cancer to neoadjuvant chemotherapy: theory and preliminary clinical results. Phys. Med. Biol. 2018;63:105015. doi: 10.1088/1361-6560/aac040. [DOI] [PMC free article] [PubMed] [Google Scholar]
- Jarrett A.M., Hormuth D.A., Wu C., Virostko J., Sorace A.G., DiCarlo J.C., Patt D., Goodgame B., Avery S., Yankeelov T.E. Abstract P2-16-17: optimizing neoadjuvant regimens for individual breast cancer patients generated by a mathematical model utilizing quantitative magnetic resonance imaging data: preliminary results. Cancer Res. 2020;80 doi: 10.1158/1538-7445.SABCS19-P2-16-17. [DOI] [Google Scholar]
- Johnson K.E., Howard G., Mo W., Strasser M.K., Lima E.A.B.F., Huang S., Brock A. Cancer cell population growth kinetics at low densities deviate from the exponential growth model and suggest an Allee effect. PLoS Biol. 2019;17:1–29. doi: 10.1371/journal.pbio.3000399. [DOI] [PMC free article] [PubMed] [Google Scholar]
- Johnson K., Howard G.R., Morgan D., Brenner E.A., Gardner A.L., Durrett R.E., Mo W., Al’Khafaji A., Sontag E.D., Jarrett A.M. Integrating multimodal data sets into a mathematical framework to describe and predict therapeutic resistance in cancer (preprint) bioRxiv. 2020 doi: 10.1101/2020.02.11.943738. [DOI] [PMC free article] [PubMed] [Google Scholar]
- Junttila M.R., de Sauvage F.J. Influence of tumour micro-environment heterogeneity on therapeutic response. Nature. 2013;501:346–354. doi: 10.1038/nature12626. [DOI] [PubMed] [Google Scholar]
- Kam Y., Karperien A., Weidow B., Estrada L., Anderson A.R., Quaranta V. Nest expansion assay: a cancer systems biology approach to in vitro invasion measurements. BMC Res. Notes. 2009;2:130. doi: 10.1186/1756-0500-2-130. [DOI] [PMC free article] [PubMed] [Google Scholar]
- Karolak A., Markov D.A., McCawley L.J., Rejniak K.A. Towards personalized computational oncology: from spatial models of tumour spheroids, to organoids, to tissues. J. R. Soc. Interf. 2018;15:20170703. doi: 10.1098/rsif.2017.0703. [DOI] [PMC free article] [PubMed] [Google Scholar]
- Kim J.Y., Gatenby R.A. Quantitative clinical imaging methods for monitoring intratumoral evolution. In: Kasid U., Clarke R., editors. Cancer Gene Networks. Springer New York; 2017. pp. 61–81. [DOI] [PubMed] [Google Scholar]
- Kim M.-C., Silberberg Y.R., Abeyaratne R., Kamm R.D., Asada H.H. Computational modeling of three-dimensional ECM-rigidity sensing to guide directed cell migration. Proc. Natl. Acad. Sci. U S A. 2018;115:E390–E399. doi: 10.1073/pnas.1717230115. [DOI] [PMC free article] [PubMed] [Google Scholar]
- Kingsmore K.M., Vaccari A., Abler D., Cui S.X., Epstein F.H., Rockne R.C., Acton S.T., Munson J.M. MRI analysis to map interstitial flow in the brain tumor microenvironment. APL Bioeng. 2018;2:031905. doi: 10.1063/1.5023503. [DOI] [PMC free article] [PubMed] [Google Scholar]
- Kozusko F., Chen P.-H., Grant S.G., Day B.W., Panetta J.C. A mathematical model of in vitro cancer cell growth and treatment with the antimitotic agent curacin A. Math. Biosci. 2001;170:1–16. doi: 10.1016/S0025-5564(00)00065-1. [DOI] [PubMed] [Google Scholar]
- Langer E.M., Allen-Petersen B.L., King S.M., Kendsersky N.D., Turnidge M.A., Kuziel G.M., Riggers R., Samatham R., Amery T.S., Jacques S.L. Modeling tumor phenotypes in vitro with three-dimensional bioprinting. Cell Rep. 2019;26:608–623.e6. doi: 10.1016/j.celrep.2018.12.090. [DOI] [PMC free article] [PubMed] [Google Scholar]
- Lee S.W.L., Seager R.J., Litvak F., Spill F., Sieow J.L., Leong P.H., Kumar D., Tan A.S.M., Wong S.C., Adriani G. Integrated in silico and 3D in vitro model of macrophage migration in response to physical and chemical factors in the tumor microenvironment. Int. Bio (Cam) 2020;12:90–108. doi: 10.1093/intbio/zyaa007. [DOI] [PMC free article] [PubMed] [Google Scholar]
- Liedekerke P.V., Neitsch J., Johann T., Alessandri K., Nassoy P., Drasdo D. Quantitative cell-based model predicts mechanical stress response of growing tumor spheroids over various growth conditions and cell lines. PLoS Comput. Biol. 2019;15:e1006273. doi: 10.1371/journal.pcbi.1006273. [DOI] [PMC free article] [PubMed] [Google Scholar]
- Lima E.A.B.F., Oden J.T., Hormuth D.A., Yankeelov T.E., Almeida R.C. Selection, calibration, and validation of models of tumor growth. Math. Models Methods Appl. Sci. 2016;26:2341–2368. doi: 10.1142/S021820251650055X. [DOI] [PMC free article] [PubMed] [Google Scholar]
- Liu Y., Sadowski S.M., Weisbrod A.B., Kebebew E., Summers R.M., Yao J. Patient specific tumor growth prediction using multimodal images. Med. Image Anal. 2014;18:555–566. doi: 10.1016/j.media.2014.02.005. [DOI] [PMC free article] [PubMed] [Google Scholar]
- LoCastro E., Paudyal R., Mazaheri Y., Hatzoglou V., Oh J.H., Lu Y., Konar A.S., vom Eigen K., Ho A., Ewing J.R. Computational modeling of interstitial fluid pressure and velocity in head and neck cancer based on dynamic contrast-enhanced magnetic resonance imaging: feasibility analysis. Tomography. 2020;6:129–138. doi: 10.18383/j.tom.2020.00005. [DOI] [PMC free article] [PubMed] [Google Scholar]
- Lorenzo G., Hughes T.J.R., Dominguez-Frojan P., Reali A., Gomez H. Computer simulations suggest that prostate enlargement due to benign prostatic hyperplasia mechanically impedes prostate cancer growth. Proc. Natl. Acad. Sci. U S A. 2019;116:1152–1161. doi: 10.1073/pnas.1815735116. [DOI] [PMC free article] [PubMed] [Google Scholar]
- Lorenzo G., Hughes T.J.R., Reali A., Gomez H. A numerical simulation study of the dual role of 5α-reductase inhibitors on tumor growth in prostates enlarged by benign prostatic hyperplasia via stress relaxation and apoptosis upregulation. Comput. Methods Appl. Mech. Eng. 2020;362:112843. doi: 10.1016/j.cma.2020.112843. [DOI] [Google Scholar]
- Lorenzo G., Pérez-García V.M., Mariño A., Pérez-Romasanta L.A., Reali A., Gomez H. Mechanistic modelling of prostate-specific antigen dynamics shows potential for personalized prediction of radiation therapy outcome. J. R. Soc. Interf. 2019;16:20190195. doi: 10.1098/rsif.2019.0195. [DOI] [PMC free article] [PubMed] [Google Scholar]
- Lorenzo G., Scott M.A., Tew K., Hughes T.J.R., Zhang Y.J., Liu L., Vilanova G., Gomez H. Tissue-scale, personalized modeling and simulation of prostate cancer growth. PNAS. 2016;113:E7663–E7671. doi: 10.1073/pnas.1615791113. [DOI] [PMC free article] [PubMed] [Google Scholar]
- Ma X., Liu J., Zhu W., Tang M., Lawrence N., Yu C., Gou M., Chen S. 3D bioprinting of functional tissue models for personalized drug screening and in vitro disease modeling. Adv. Drug Deliv. Rev. 2018;132:235–251. doi: 10.1016/j.addr.2018.06.011. [DOI] [PMC free article] [PubMed] [Google Scholar]
- Mabray M.C., Barajas R.F., Jr., Cha S. Modern brain tumor imaging. Brain Tumor Res. Treat. 2015;3:8–23. doi: 10.14791/btrt.2015.3.1.8. [DOI] [PMC free article] [PubMed] [Google Scholar]
- Macklin P., Edgerton M.E., Thompson A.M., Cristini V. Patient-calibrated agent-based modelling of ductal carcinoma in situ (DCIS): from microscopic measurements to macroscopic predictions of clinical progression. J. Theor. Biol. 2012;301:122–140. doi: 10.1016/j.jtbi.2012.02.002. [DOI] [PMC free article] [PubMed] [Google Scholar]
- Macklin P., Lowengrub J. Nonlinear simulation of the effect of microenvironment on tumor growth. J. Theor. Biol. 2007;245:677–704. doi: 10.1016/j.jtbi.2006.12.004. [DOI] [PubMed] [Google Scholar]
- Maffei J.S., Srivastava J., Fallica B., Zaman M.H. Combinative in vitro studies and computational model to predict 3D cell migration response to drug insult. Integr. Biol. (Camb) 2014;6:957–972. doi: 10.1039/c4ib00167b. [DOI] [PMC free article] [PubMed] [Google Scholar]
- Maley C.C., Aktipis A., Graham T.A., Sottoriva A., Boddy A.M., Janiszewska M., Silva A.S., Gerlinger M., Yuan Y., Pienta K.J. Classifying the evolutionary and ecological features of neoplasms. Nat. Rev. Cancer. 2017;17:605–619. doi: 10.1038/nrc.2017.69. [DOI] [PMC free article] [PubMed] [Google Scholar]
- Mang A., Bakas S., Subramanian S., Davatzikos C., Biros G. Integrated biophysical modeling and image analysis: application to neuro-oncology. arXiv. 2020 doi: 10.1146/annurev-bioeng-062117-121105. arXiv:2002.09628 [DOI] [PMC free article] [PubMed] [Google Scholar]
- Mark C., Metzner C., Lautscham L., Strissel P.L., Strick R., Fabry B. Bayesian model selection for complex dynamic systems. Nat. Commun. 2018;9:1803. doi: 10.1038/s41467-018-04241-5. [DOI] [PMC free article] [PubMed] [Google Scholar]
- McFarland C.D., Korolev K.S., Kryukov G.V., Sunyaev S.R., Mirny L.A. Impact of deleterious passenger mutations on cancer progression. PNAS. 2013;110:2910–2915. doi: 10.1073/pnas.1213968110. [DOI] [PMC free article] [PubMed] [Google Scholar]
- Mendoza-Juez B., Martínez-González A., Calvo G.F., Pérez-García V.M. A mathematical model for the glucose-lactate metabolism of in vitro cancer cells. Bull. Math. Biol. 2012;74:1125–1142. doi: 10.1007/s11538-011-9711-z. [DOI] [PubMed] [Google Scholar]
- Merkher Y., Horesh Y., Abramov Z., Shleifer G., Ben-Ishay O., Kluger Y., Weihs D. Rapid cancer diagnosis and early prognosis of metastatic risk based on mechanical invasiveness of sampled cells. Ann. Biomed. Eng. 2020 doi: 10.1007/s10439-020-02547-4. [DOI] [PubMed] [Google Scholar]
- Merks R.M.H., Brodsky S.V., Goligorksy M.S., Newman S.A., Glazier J.A. Cell elongation is key to in silico replication of in vitro vasculogenesis and subsequent remodeling. Dev. Biol. 2006;289:44–54. doi: 10.1016/j.ydbio.2005.10.003. [DOI] [PMC free article] [PubMed] [Google Scholar]
- Metzcar J., Wang Y., Heiland R., Macklin P. A review of cell-based computational modeling in cancer biology. JCO Clin. Cancer Inform. 2019;3 doi: 10.1200/CCI.18.00069. [DOI] [PMC free article] [PubMed] [Google Scholar]
- Michna R., Gadde M., Ozkan A., DeWitt M., Rylander M. Vascularized microfluidic platforms to mimic the tumor microenvironment. Biotechnol. Bioeng. 2018 doi: 10.1002/bit.26778. [DOI] [PMC free article] [PubMed] [Google Scholar]
- Michor F., Hughes T.P., Iwasa Y., Branford S., Shah N.P., Sawyers C.L., Nowak M.A. Dynamics of chronic myeloid leukaemia. Nature. 2005;435:1267–1270. doi: 10.1038/nature03669. [DOI] [PubMed] [Google Scholar]
- Moolgavkar S.H., Knudson A.G. Mutation and cancer: a model for human carcinogenesis. J. Natl. Cancer Inst. 1981;66:1037–1052. doi: 10.1093/jnci/66.6.1037. [DOI] [PubMed] [Google Scholar]
- Morinishi L., Kochanowski K., Levine R.L., Wu L.F., Altschuler S.J. Loss of TET2 affects proliferation and drug sensitivity through altered dynamics of cell-state transitions. Cell Syst. 2020;11:86–94.e5. doi: 10.1016/j.cels.2020.06.003. [DOI] [PMC free article] [PubMed] [Google Scholar]
- Morken J.D., Packer A., Everett R.A., Nagy J.D., Kuang Y. Mechanisms of resistance to intermittent androgen deprivation in patients with prostate cancer identified by a novel computational method. Cancer Res. 2014;74:3673–3683. doi: 10.1158/0008-5472.CAN-13-3162. [DOI] [PubMed] [Google Scholar]
- Mortimer J.E., Bading J.R., Park J.M., Frankel P.H., Carroll M.I., Tran T.T., Poku E.K., Rockne R.C., Raubitschek A.A., Shively J.E., Colcher D.M. Tumor uptake of (64)Cu-DOTA-Trastuzumab in patients with metastatic breast cancer. J. Nucl. med. 2018;59:38–43. doi: 10.2967/jnumed.117.193888. [DOI] [PMC free article] [PubMed] [Google Scholar]
- Neal M.L., Trister A.D., Cloke T., Sodt R., Ahn S., Baldock A.L., Bridge C.A., Lai A., Cloughesy T.F., Mrugala M.M. Discriminating survival outcomes in patients with glioblastoma using a simulation-based, patient-specific response metric. PLoS One. 2013;8 doi: 10.1371/journal.pone.0051951. [DOI] [PMC free article] [PubMed] [Google Scholar]
- Nguyen L.V., Cox C.L., Eirew P., Knapp D.J.H.F., Pellacani D., Kannan N., Carles A., Moksa M., Balani S., Shah S. DNA barcoding reveals diverse growth kinetics of human breast tumour subclones in serially passaged xenografts. Nat. Commun. 2014;5:5871. doi: 10.1038/ncomms6871. [DOI] [PMC free article] [PubMed] [Google Scholar]
- Nishino M., Jagannathan J.P., Ramaiya N.H., Van den Abbeele A.D. Revised RECIST guideline version 1.1: what oncologists want to know and what radiologists need to know. Am. J. Roentgenol. 2010;195:281–289. doi: 10.2214/AJR.09.4110. [DOI] [PubMed] [Google Scholar]
- Padhani A.R., Liu G., Mu-Koh D., Chenevert T.L., Thoeny H.C., Takahara T., Dzik-Jurasz A., Ross B.D., Van Cauteren M., Collins D. Diffusion-weighted magnetic resonance imaging as a cancer biomarker: consensus and recommendations. Neoplasia. 2009;11:102–125. doi: 10.1593/neo.81328. [DOI] [PMC free article] [PubMed] [Google Scholar]
- Pérez-García V.M., Ayala-Hernández L.E., Belmonte-Beitia J., Schucht P., Murek M., Raabe A., Sepúlveda J. Computational design of improved standardized chemotherapy protocols for grade II oligodendrogliomas. PLoS Comput. Biol. 2019;15:e1006778. doi: 10.1371/journal.pcbi.1006778. [DOI] [PMC free article] [PubMed] [Google Scholar]
- Pérez-García V.M., Calvo G.F., Bosque J.J., León-Triana O., Jiménez J., Pérez-Beteta J., Belmonte-Beitia J., Valiente M., Zhu L., García-Gómez P. Universal scaling laws rule explosive growth in human cancers. Nat. Phys. 2020:1–6. doi: 10.1038/s41567-020-0978-6. [DOI] [PMC free article] [PubMed] [Google Scholar]
- Phillips C.M., Lima E.A.B.F., Woodall R.T., Brock A., Yankeelov T.E. A hybrid model of tumor growth and angiogenesis: in silico experiments. PLoS One. 2020;15:e0231137. doi: 10.1371/journal.pone.0231137. [DOI] [PMC free article] [PubMed] [Google Scholar]
- Pisco A.O., Brock A., Zhou J., Moor A., Mojtahedi M., Jackson D., Huang S. Non-Darwinian dynamics in therapy-induced cancer drug resistance. Nat. Commun. 2013;4 doi: 10.1038/ncomms3467.Non-Darwinian. [DOI] [PMC free article] [PubMed] [Google Scholar]
- Pisco A.O., Huang S. Non-genetic cancer cell plasticity and therapy-induced stemness in tumour relapse : ‘ what does not kill me strengthens me. Br. J. Cancer. 2015;112:1725–1732. doi: 10.1038/bjc.2015.146. [DOI] [PMC free article] [PubMed] [Google Scholar]
- Raghavan S., Mehta P., Horst E.N., Ward M.R., Rowley K.R., Mehta G. Comparative analysis of tumor spheroid generation techniques for differential in vitro drug toxicity. Oncotarget. 2016;7:16948–16961. doi: 10.18632/oncotarget.7659. [DOI] [PMC free article] [PubMed] [Google Scholar]
- Rajendran J.G., Krohn K.A. F-18 fluoromisonidazole for imaging tumor hypoxia: imaging the microenvironment for personalized cancer therapy. Semin. Nucl. Med. 2015;45:151–162. doi: 10.1053/j.semnuclmed.2014.10.006. [DOI] [PMC free article] [PubMed] [Google Scholar]
- Ramamonjisoa N., Ackerstaff E. Characterization of the tumor microenvironment and tumor–stroma interaction by non-invasive preclinical imaging. Front. Oncol. 2017;7:3. doi: 10.3389/fonc.2017.00003. [DOI] [PMC free article] [PubMed] [Google Scholar]
- Rata M., Giles S.L., DeSouza N.M., Leach M.O., Payne G.S. Comparison of three reference methods for the measurement of intracellular pH using 31P MRS in healthy volunteers and patients with lymphoma. NMR Biomed. 2014;27:158–162. doi: 10.1002/nbm.3047. [DOI] [PMC free article] [PubMed] [Google Scholar]
- Rejniak K.A., Wang S.E., Bryce N.S., Chang H., Parvin B., Jourquin J., Estrada L., Gray J.W., Arteaga C.L., Weaver A.M. Linking changes in epithelial morphogenesis to cancer mutations using computational modeling. PLoS Comput. Biol. 2010;6:e1000900. doi: 10.1371/journal.pcbi.1000900. [DOI] [PMC free article] [PubMed] [Google Scholar]
- Roberts S., Peyman S., Speirs V. Current and emerging 3D models to study breast cancer. Adv. Exp. Med. Biol. 2019;1152:413–427. doi: 10.1007/978-3-030-20301-6_22. [DOI] [PubMed] [Google Scholar]
- Rockne R.C., Hawkins-Daarud A., Swanson K.R., Sluka J.P., Glazier J.A., Macklin P., Hormuth D., Jarrett A.M., Lima E.A.B.da F., Oden J. The 2019 mathematical oncology roadmap. Phys. Biol. 2019 doi: 10.1088/1478-3975/ab1a09. [DOI] [PMC free article] [PubMed] [Google Scholar]
- Rockne R.C., Trister A.D., Jacobs J., Hawkins-Daarud A.J., Neal M.L., Hendrickson K., Mrugala M.M., Rockhill J.K., Kinahan P., Krohn K.A., Swanson K.R. A patient-specific computational model of hypoxia-modulated radiation resistance in glioblastoma using 18 F-FMISO-PET. J. R. Soc. Interf. 2015;12:20141174. doi: 10.1098/rsif.2014.1174. [DOI] [PMC free article] [PubMed] [Google Scholar]
- Sanga S., Frieboes H.B., Zheng X., Gatenby R., Bearer E.L., Cristini V. Predictive oncology: multidisciplinary, multi-scale in-silico modeling linking phenotype, morphology and growth. Neuroimage. 2007;37:S120–S134. doi: 10.1016/j.neuroimage.2007.05.043. [DOI] [PMC free article] [PubMed] [Google Scholar]
- Saucedo A.M., De La Cerda J., Suami H., Serda R.E. Multimodal imaging of the tumor microenvironment and biological responses to immune therapy. Biomed. Microdevices. 2018;20 doi: 10.1007/s10544-018-0347-8. [DOI] [PMC free article] [PubMed] [Google Scholar]
- Serini G., Ambrosi D., Giraudo E., Gamba A., Preziosi L., Bussolino F. Modeling the early stages of vascular network assembly. EMBO J. 2003;22:1771–1779. doi: 10.1093/emboj/cdg176. [DOI] [PMC free article] [PubMed] [Google Scholar]
- Shamloo A., Mohammadaliha N., Heilshorn S.C., Bauer A.L. A comparative study of collagen matrix density effect on endothelial sprout formation using experimental and computational approaches. Ann. Biomed. Eng. 2016;44:929–941. doi: 10.1007/s10439-015-1416-2. [DOI] [PubMed] [Google Scholar]
- Shipitsin M., Campbell L.L., Argani P., Weremowicz S., Bloushtain-Qimron N., Yao J., Nikolskaya T., Serebryiskaya T., Beroukhim R., Hu M. Molecular definition of breast tumor heterogeneity. Cancer Cell. 2007;11:259–273. doi: 10.1016/j.ccr.2007.01.013. [DOI] [PubMed] [Google Scholar]
- Sinha S., Sinha U. Recent advances in breast MRI and MRS. NMR Biomed. 2009;22:3–16. doi: 10.1002/nbm.1270. [DOI] [PubMed] [Google Scholar]
- Staton C.A., Stribbling S.M., Tazzyman S., Hughes R., Brown N.J., Lewis C.E. Current methods for assaying angiogenesis in vitro and in vivo. Int. J. Exp. Pathol. 2004;85:233–248. doi: 10.1111/j.0959-9673.2004.00396.x. [DOI] [PMC free article] [PubMed] [Google Scholar]
- Stokes C.L., Lauffenburger D.A., Williams S.K. Migration of individual microvessel endothelial cells: stochastic model and parameter measurement. J. Cell Sci. 1991;99:419–430. doi: 10.1242/jcs.99.2.419. [DOI] [PubMed] [Google Scholar]
- Strauss L.G. Fluorine-18 deoxyglucose and false-positive results: a major problem in the diagnostics of oncological patients. Eur. J. Nucl. Med. 1996;23:1409–1415. doi: 10.1007/BF01367602. [DOI] [PubMed] [Google Scholar]
- Sugahara T., Korogi Y., Kochi M., Ikushima I., Shigematu Y., Hirai T., Okuda T., Liang L., Ge Y., Komohara Y. Usefulness of diffusion-weighted MRI with echo-planar technique in the evaluation of cellularity in gliomas. J. Magn. Reson. Imaging. 1999;9:53–60. doi: 10.1002/(SICI)1522-2586(199901)9:1<53::AID-JMRI7>3.0.CO;2-2. [DOI] [PubMed] [Google Scholar]
- Sun W., Luo Z., Lee J., Kim H.-J., Lee K., Tebon P., Feng Y., Dokmeci M.R., Sengupta S., Khademhosseini A. Organ-on-a-Chip for cancer and immune organs modeling. Adv. Healthc. Mater. 2019;8:e1801363. doi: 10.1002/adhm.201801363. [DOI] [PubMed] [Google Scholar]
- Syed A.K., Whisenant J.G., Barnes S.L., Sorace A.G., Yankeelov T.E. Multiparametric analysis of longitudinal quantitative MRI data to identify distinct tumor habitats in preclinical models of breast cancer. Cancers. 2020;12:1682. doi: 10.3390/cancers12061682. [DOI] [PMC free article] [PubMed] [Google Scholar]
- Trujillo-de Santiago G., Flores-Garza B.G., Tavares-Negrete J.A., Lara-Mayorga I.M., González-Gamboa I., Zhang Y.S., Rojas-Martínez A., Ortiz-López R., Álvarez M.M. The tumor-on-chip: recent advances in the development of microfluidic systems to recapitulate the physiology of solid tumors. Materials (Basel) 2019;12:2945. doi: 10.3390/ma12182945. [DOI] [PMC free article] [PubMed] [Google Scholar]
- Vilanova G., Colominas I., Gomez H. Computational modeling of tumor-induced angiogenesis. Arch. Computat. Methods Eng. 2017;24:1071–1102. doi: 10.1007/s11831-016-9199-7. [DOI] [Google Scholar]
- Waclaw B., Bozic I., Pittman M.E., Hruban R.H., Vogelstein B., Nowak M.A. A spatial model predicts that dispersal and cell turnover limit intratumour heterogeneity. Nature. 2015;525:261–264. doi: 10.1038/nature14971. [DOI] [PMC free article] [PubMed] [Google Scholar]
- Wang X., Li W., Kumar V. A method for solvent-free fabrication of porous polymer using solid-state foaming and ultrasound for tissue engineering applications. Biomaterials. 2006;27:1924–1929. doi: 10.1016/j.biomaterials.2005.09.029. [DOI] [PubMed] [Google Scholar]
- Wang Z., Butner J.D., Kerketta R., Cristini V., Deisboeck T.S. Simulating cancer growth with multiscale agent-based modeling. Semin. Cancer Biol. 2015;30:70–78. doi: 10.1016/j.semcancer.2014.04.001. [DOI] [PMC free article] [PubMed] [Google Scholar]
- Weis J.A., Miga M.I., Arlinghaus L.R., Li X., Abramson V., Chakravarthy A.B., Pendyala P., Yankeelov T.E. Predicting the response of breast cancer to neoadjuvant therapy using a mechanically coupled reaction-diffusion model. Cancer Res. 2015;75:4697–4707. doi: 10.1158/0008-5472.CAN-14-2945. [DOI] [PMC free article] [PubMed] [Google Scholar]
- Weissman T.A., Pan Y.A. Brainbow: new resources and emerging biological applications for multicolor genetic labeling and analysis. Genetics. 2015;199:293–306. doi: 10.1534/genetics.114.172510. [DOI] [PMC free article] [PubMed] [Google Scholar]
- Wong K.C.L., Summers R.M., Kebebew E., Yao J. Pancreatic tumor growth prediction with elastic-growth decomposition, image-derived motion, and FDM-FEM coupling. IEEE Trans. Med. Imaging. 2017;36:111–123. doi: 10.1109/TMI.2016.2597313. [DOI] [PMC free article] [PubMed] [Google Scholar]
- Woolf D.K., Beresford M., Li S.P., Dowsett M., Sanghera B., Wong W.L., Sonoda L., Detre S., Amin V., Ah-See M.-L. Evaluation of FLT-PET-CT as an imaging biomarker of proliferation in primary breast cancer. Br. J. Cancer. 2014;110:2847–2854. doi: 10.1038/bjc.2014.207. [DOI] [PMC free article] [PubMed] [Google Scholar]
- Yamamoto K.N., Nakamura A., Liu L.L., Stein S., Tramontano A.C., Kartoun U., Shimizu T., Inoue Y., Asakuma M., Haeno H. Computational modeling of pancreatic cancer patients receiving FOLFIRINOX and gemcitabine-based therapies identifies optimum intervention strategies. PLoS One. 2019;14:e0215409. doi: 10.1371/journal.pone.0215409. [DOI] [PMC free article] [PubMed] [Google Scholar]
- Yankeelov T.E., Abramson R.G., Quarles C.C. Quantitative multimodality imaging in cancer research and therapy. Nat. Rev. Clin. Oncol. 2014;11:670–680. doi: 10.1038/nrclinonc.2014.134. [DOI] [PMC free article] [PubMed] [Google Scholar]
- Yankeelov T.E., An G., Saut O., Luebeck E.G., Popel A.S., Ribba B., Vicini P., Zhou X., Weis J.A., Ye K., Genin G.M. Multi-scale modeling in clinical oncology: opportunities and barriers to success. Ann. Biomed. Eng. 2016 doi: 10.1007/s10439-016-1691-6. [DOI] [PMC free article] [PubMed] [Google Scholar]
- Yankeelov T.E., Atuegwu N., Hormuth D., Weis J.A., Barnes S.L., Miga M.I., Rericha E.C., Quaranta V. Clinically relevant modeling of tumor growth and treatment response. Sci. Transl. Med. 2013;5:187ps9. doi: 10.1126/scitranslmed.3005686. [DOI] [PMC free article] [PubMed] [Google Scholar]
- Yankeelov T.E., Gore J.C. Dynamic contrast enhanced magnetic resonance imaging in oncology: theory, data acquisition, analysis, and examples. Curr. Med. Imaging Rev. 2009;3:91–107. doi: 10.2174/157340507780619179. [DOI] [PMC free article] [PubMed] [Google Scholar]
- Yankeelov T.E., Mankoff D.A., Schwartz L.H., Lieberman F.S., Buatti J.M., Mountz J.M., Erickson B.J., Fennessy F.M.M., Huang W., Kalpathy-Cramer J. Quantitative imaging in cancer clinical trials. Clin. Cancer Res. 2016;22:284–290. doi: 10.1158/1078-0432.CCR-14-3336. [DOI] [PMC free article] [PubMed] [Google Scholar]
- Yankeelov T.E., Quaranta V., Evans K.J., Rericha E.C. Towards a science of tumor forecasting for clinical oncology. Cancer Res. 2015;75:918–923. doi: 10.1158/0008-5472.CAN-14-2233. [DOI] [PMC free article] [PubMed] [Google Scholar]