Abstract
Lineage-specific epigenomic changes during human corticogenesis have remained elusive due to challenges with sample availability and tissue heterogeneity. For example, previous studies used single-cell RNA sequencing to identify at least nine major cell types and up to 26 distinct subtypes in the dorsal cortex alone1,2. Here, we characterize cell type-specific cis-regulatory chromatin interactions, open chromatin peaks, and transcriptomes for radial glia, intermediate progenitor cells, excitatory neurons, and interneurons isolated from mid-gestational human cortex samples. We show that chromatin interactions underlie multiple aspects of gene regulation, with transposable elements and disease-associated variants enriched at distal interacting regions in a cell type-specific manner. In addition, promoters with significantly increased levels of chromatin interactivity, termed super interactive promoters, are enriched for lineage-specific genes, suggesting that interactions at these loci contribute to the fine-tuning of transcription. Finally, we develop CRISPRview, a novel technique integrating immunostaining, CRISPRi, RNAscope, and image analysis for validating cell type-specific cis-regulatory elements in heterogeneous populations of primary cells. Our study presents the first cell type-specific characterization of 3D epigenomes in the developing human cortex, advancing our understanding of gene regulation and lineage specification during this critical developmental window.
Introduction
The human cortex undergoes extensive expansion during development, a process which is markedly different and features distinct cell types from mouse cortical development. Much of its diversity arises from cortical stem cells known as radial glia (RG), which give rise to intermediate progenitor cells (IPCs) and excitatory neurons (eNs) that undergo radial migration until they reach the cortical plate (CP)3,4. Meanwhile, interneurons (iNs) migrate tangentially into the dorsal cortex through the marginal and germinal zones (GZ)5. Dynamic changes in the epigenomic landscape have been shown to play a critical role in development and cell fate commitment, for instance through the rewiring of physical chromatin loops between promoters and distal regulatory elements including enhancers6. These interactions are of particular interest as their dysregulation has been linked to alterations in gene expression and complex disorders and traits7,8. Although previous studies have investigated bulk tissues including the CP and GZ9, detailed characterizations are still missing for specific cell types. Here, we describe a novel approach for isolating RG, IPCs, eNs, and iNs from mid-gestational human cortex samples, enabling a comparison of their 3D epigenomes. Furthermore, we develop CRISPRview, a sensitive technique for validating cell type-specific distal regulatory elements in single cells. Our results identify key mechanisms underlying gene regulation and lineage specification during human corticogenesis, providing a framework for the understanding of diverse processes in development and disease.
Results
Sorting specific cell types from the developing human cortex
To isolate cell types from human cortex samples between gestational weeks (GW) 15 to 22 (Supplementary Table 1), we expanded upon an established approach for isolating RG from human cortical samples using fluorescence-activated cell sorting (FACS)10. GZ and CP samples were dissociated, stained using antibodies for EOMES, SOX2, PAX6, and SATB2, and partitioned into their constituent populations using FACS (Fig. 1a; Extended Data Fig. 1). IPCs were isolated as the EOMES+ population, while eNs were isolated from the EOMES- and SOX2- population based on high SATB2 expression1. RG were isolated based on high SOX2 and high PAX6 expression, and iNs were isolated based on medium SOX2 and low PAX6 expression. The gene expression profiles of the sorted cell populations were both highly consistent with cellular identity and reproducible between individuals (Fig. 1b; Extended Data Fig. 2a, b).
Figure 1. Experimental design and features of 3D epigenomes during human corticogenesis.
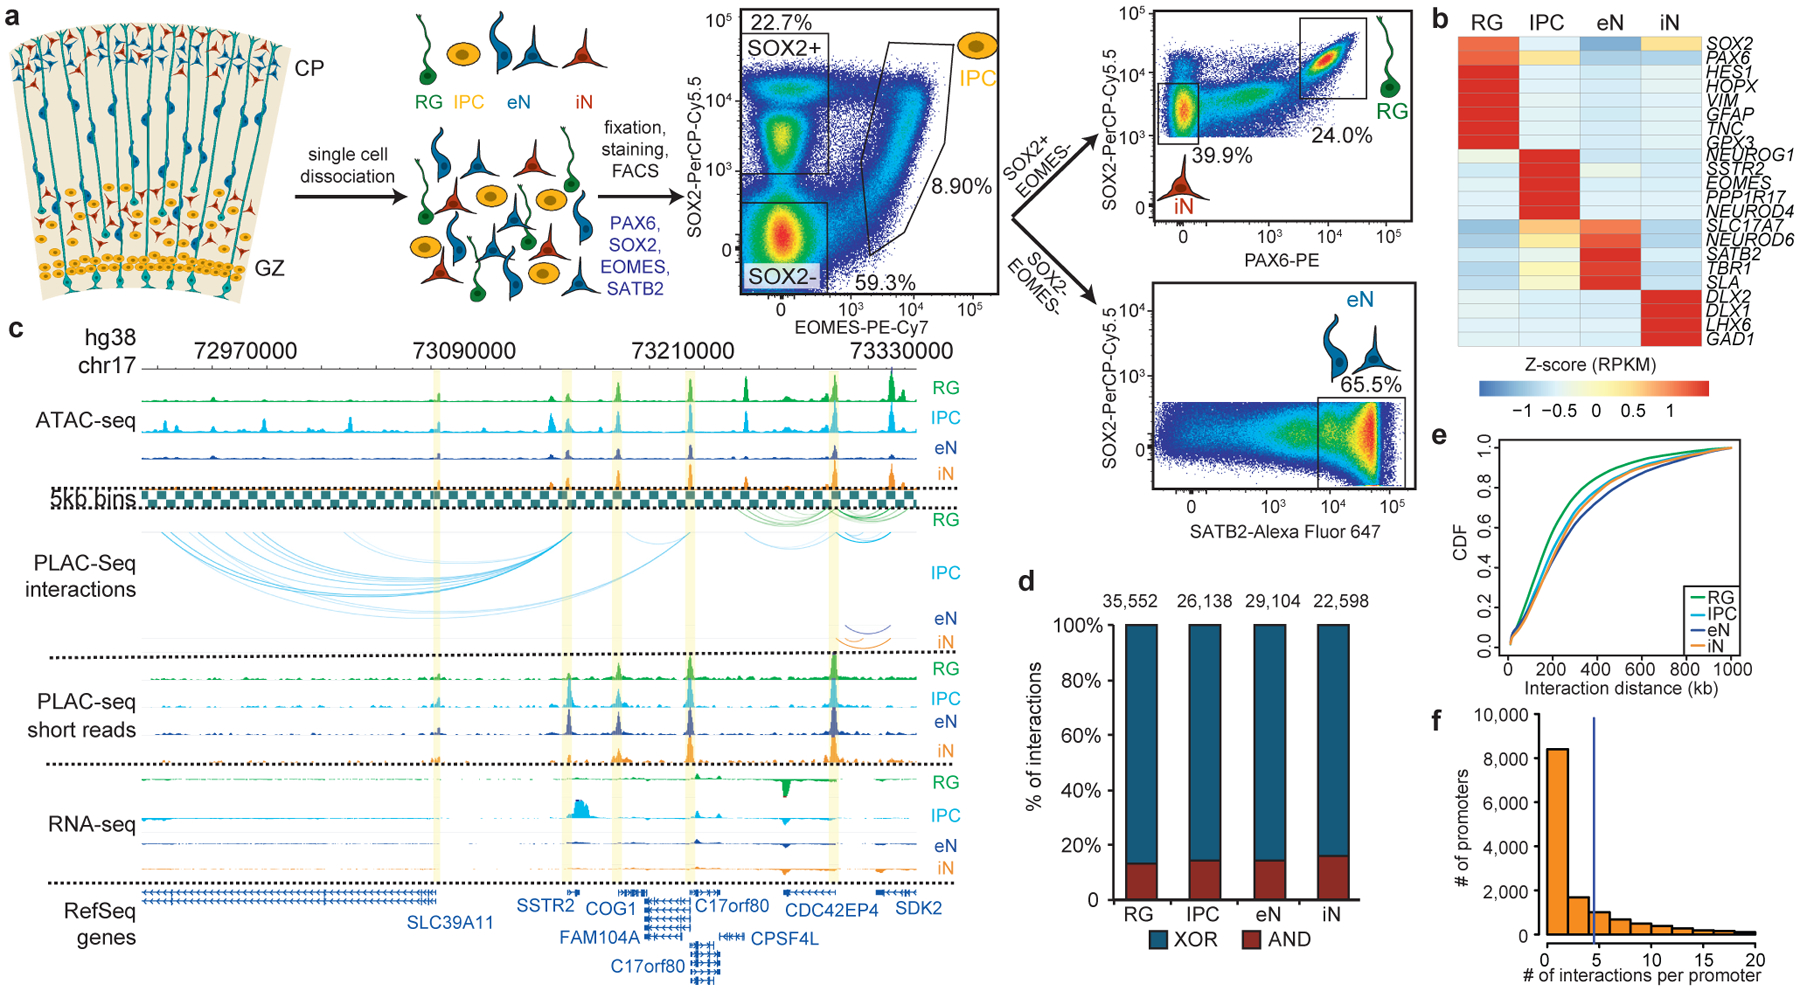
(a) Schematic of the sorting strategy. Microdissected GZ and CP samples were dissociated into single cells prior to being fixed, stained with antibodies for PAX6, SOX2, EOMES, and SATB2, and sorted using FACS. (b) Heatmap displaying the expression of key marker genes for each cell type. (c) WashU Epigenome Browser snapshot displaying a region (chr17: 72,970,000–73,330,000) with interactions linked to SSTR2 expression in IPCs. (d) Bar graph of interaction counts for each cell type, with the proportions of anchor to anchor (red) and anchor to non-anchor (blue) interactions highlighted. (e) Cumulative distribution function (CDF) plots of interaction distances for each cell type. (f) Histogram displaying the numbers of interactions for interacting promoters across all cell types.
Characterizing cell type-specific 3D epigenomes
We used H3K4me3 proximity ligation-assisted ChIP-seq (PLAC-seq)11 to identify chromatin interactions at active promoters and assay for transposase-accessible chromatin using sequencing (ATAC-seq) to profile open chromatin peaks for the sorted cell populations (Fig. 1c; Supplementary Table 2). After confirming that the samples cluster by cellular identity (Extended Data Fig. 2c, d), we applied the Model-based Analysis of PLAC-seq (MAPS) pipeline12 to call significant H3K4me3-mediated chromatin interactions at a resolution of 5 kb. We identify 35,552, 26,138, 29,104 and 22,598 interactions in RG, IPCs, eNs, and iNs, respectively, with approximately 85% of the interactions classified as anchor to non-anchor, and the remaining interactions classified as anchor to anchor (Fig. 1d; Extended Data Fig. 3a, b). The median interaction distance was between 170 kb to 230 kb (Fig. 1e), with an average of 4–5 interactions per promoter (Fig. 1f), and the majority of interactions occurred within topologically associated domains (TADs) (Extended Data Fig. 3c).
Chromatin interactions influence cell type-specific transcription
We characterized the extent to which H3K4me3-mediated chromatin interactions influence cell type-specific transcription. First, the sorted cell populations cluster by developmental age based on their interaction strengths across all interacting loci (Fig. 2a). This is consistent with iNs at this age possessing progenitor-like characteristics including high SOX2 expression. Meanwhile, genes participating in cell type-specific interactions are enriched for biological processes linked to their respective cell types, including cell proliferation for RG and IPCs, and neuron projection development for IPCs and eNs (Extended Data Fig. 4a; Supplementary Table 3). Interaction strength and gene expression are positively correlated (Fig. 2a, b; Extended Data Fig. 4b), suggesting that chromatin interactions orchestrate transcription in a manner that is distinctly cell type-specific. Next, we leveraged the enrichment of open chromatin peaks at distal interacting regions (Fig. 2c; Extended Data Fig. 4c) and performed transcription factor (TF) motif enrichment analysis for distal interacting regions in each cell type13 (Fig. 2d; Supplementary Table 4). The motifs for PAX6, EOMES, and TBR1 are enriched in RG, IPCs, and eNs, respectively, recapitulating their sequence of expression along this developmental trajectory14. The motifs for DLX1, DLX2, DLX6, GSX2, and LHX6 are enriched in iNs, in accordance with their roles in iN maturation and function15. Finally, we detect motifs that are enriched in distal interacting regions for co-expression modules in the developing human cortex1 (Supplementary Table 5). Our results identify key lineage-specific TFs while linking them to their interacting genes, enabling novel insights into gene regulatory networks during human corticogenesis.
Figure 2. H3K4me3-mediated chromatin interactions influence cell type-specific transcription.
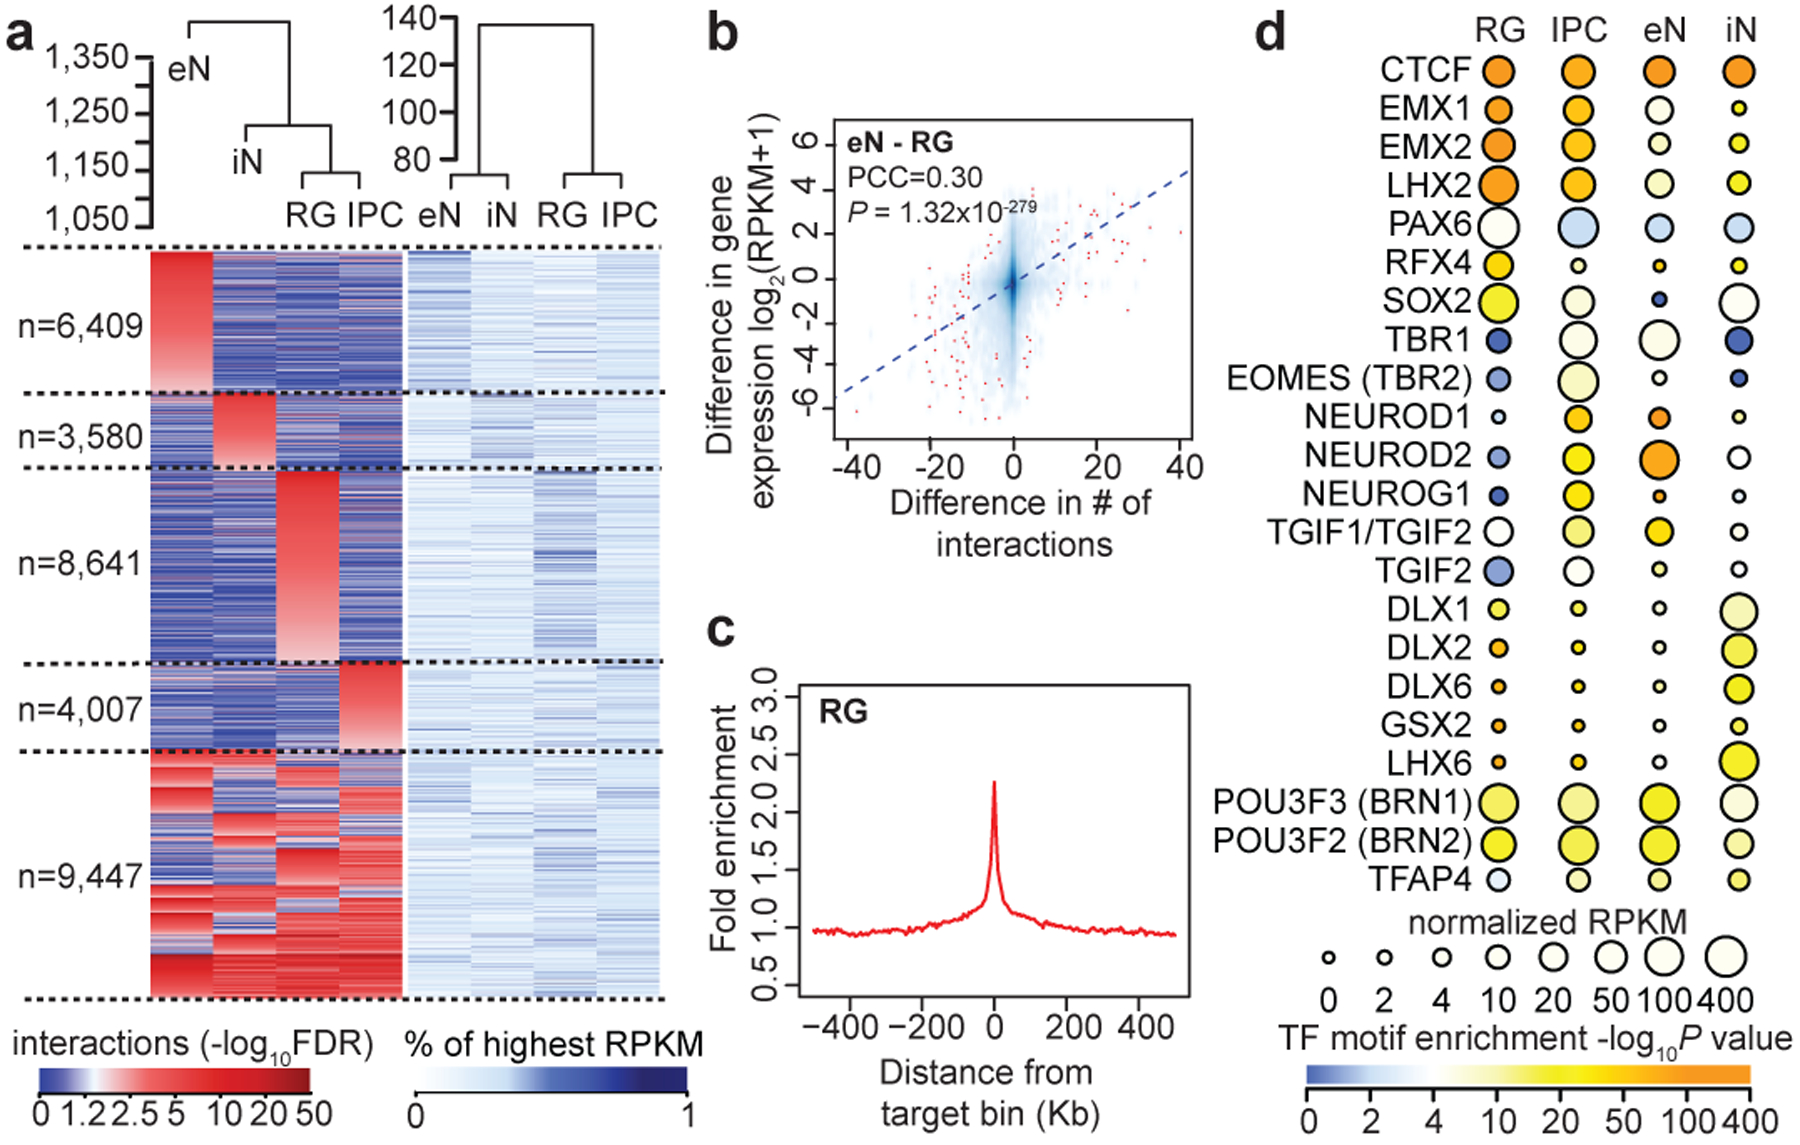
(a) Heatmaps showing interaction strengths (left) and gene expression (right) for anchor to non-anchor interactions grouped according to their cell type specificity. Interaction strengths are based on the −log10FDR from the MAPS pipeline. (b) Scatterplot showing the correlation between the difference in the number of interactions for each promoter and the difference in the expression of the corresponding genes for RG and eNs (Pearson product-moment correlation coefficient, two-tailed, P = 1.32*10−279, n = 13,996 anchor bins with promoters). The trendline from linear regression is shown. (c) Fold enrichment of open chromatin peaks over distance-matched background regions in 1 Mb windows around distal interacting regions for RG. (d) TF motif enrichment analysis for open chromatin peaks at cell type-specific distal interacting regions in each cell type. We analyzed 4,203, 1,412, 3,088, and 949 regions in RG, IPCs, eNs, and iNs, respectively. Colors represent enrichment scores based on the p-value from HOMER, while sizes represent the gene expression of the corresponding TFs.
Super interactive promoters are enriched for lineage-specific genes
The number of chromatin interactions at H3K4me3-mediated anchor bins is modestly correlated with gene expression (Extended Data Fig. 5a). One potential explanation is that individual genes are expressed to varying degrees in the contexts of their diverse cellular functions, and a subset of regulatory elements may be better described as fine-tuning rather than independently inducing or silencing transcription. Multiple regulatory interactions can also exert synergistic or nonlinear effects on gene regulation. Cell type-specific genes tend to harbor more chromatin interactions than shared genes across all four cell types (Extended Data Fig. 5b). By ranking anchor bins according to their cumulative interaction scores, we delineate a subset of promoters with significantly increased levels of chromatin interactivity, termed super interactive promoters (SIPs) (Fig. 3a; Extended Data Fig. 5c). We identify 755, 765, 638, and 663 SIPs in RG, IPCs, eNs, and iNs, respectively (Extended Data Fig. 5d; Supplementary Table 6). SIPs are enriched for key lineage-specific genes including GFAP and HES1 for RG, EOMES for IPCs, SATB2 for eNs, and DLX5, DLX6, GAD1, GAD2, and LHX6 for iNs. We also observe forebrain-specific SIPs including FOXG1 in all four cell types, progenitor-specific SIPs including SOX2 in RG, IPCs, and iNs, and cortical neuron-specific SIPs including TBR1 in IPCs and eNs. Numerous promoters for lincRNAs including LINC00461 and LINC01551 are annotated as SIPs, consistent with their expression in the developing cortex16. In general, SIPs are enriched in cell types with the highest expression of their linked genes, supporting their putative roles in lineage specification (Fig. 3b). Moreover, super-enhancers and DNA methylation valleys (DMVs)17 are enrichment at SIPs (Extended Data Fig. 5e, f). Finally, SIPs based on promoter capture Hi-C data in neutrophils, naive CD4+ T cells, monocytes, megakaryocytes, and erythroblasts18 are analogously enriched for cell type-specific over shared genes (Extended Data Fig. 5g), implying that SIPs present a generalized mechanism for maintaining the expression of key genes underlying cellular identity and function.
Figure 3. Super interactive promoters are enriched for lineage-specific genes.
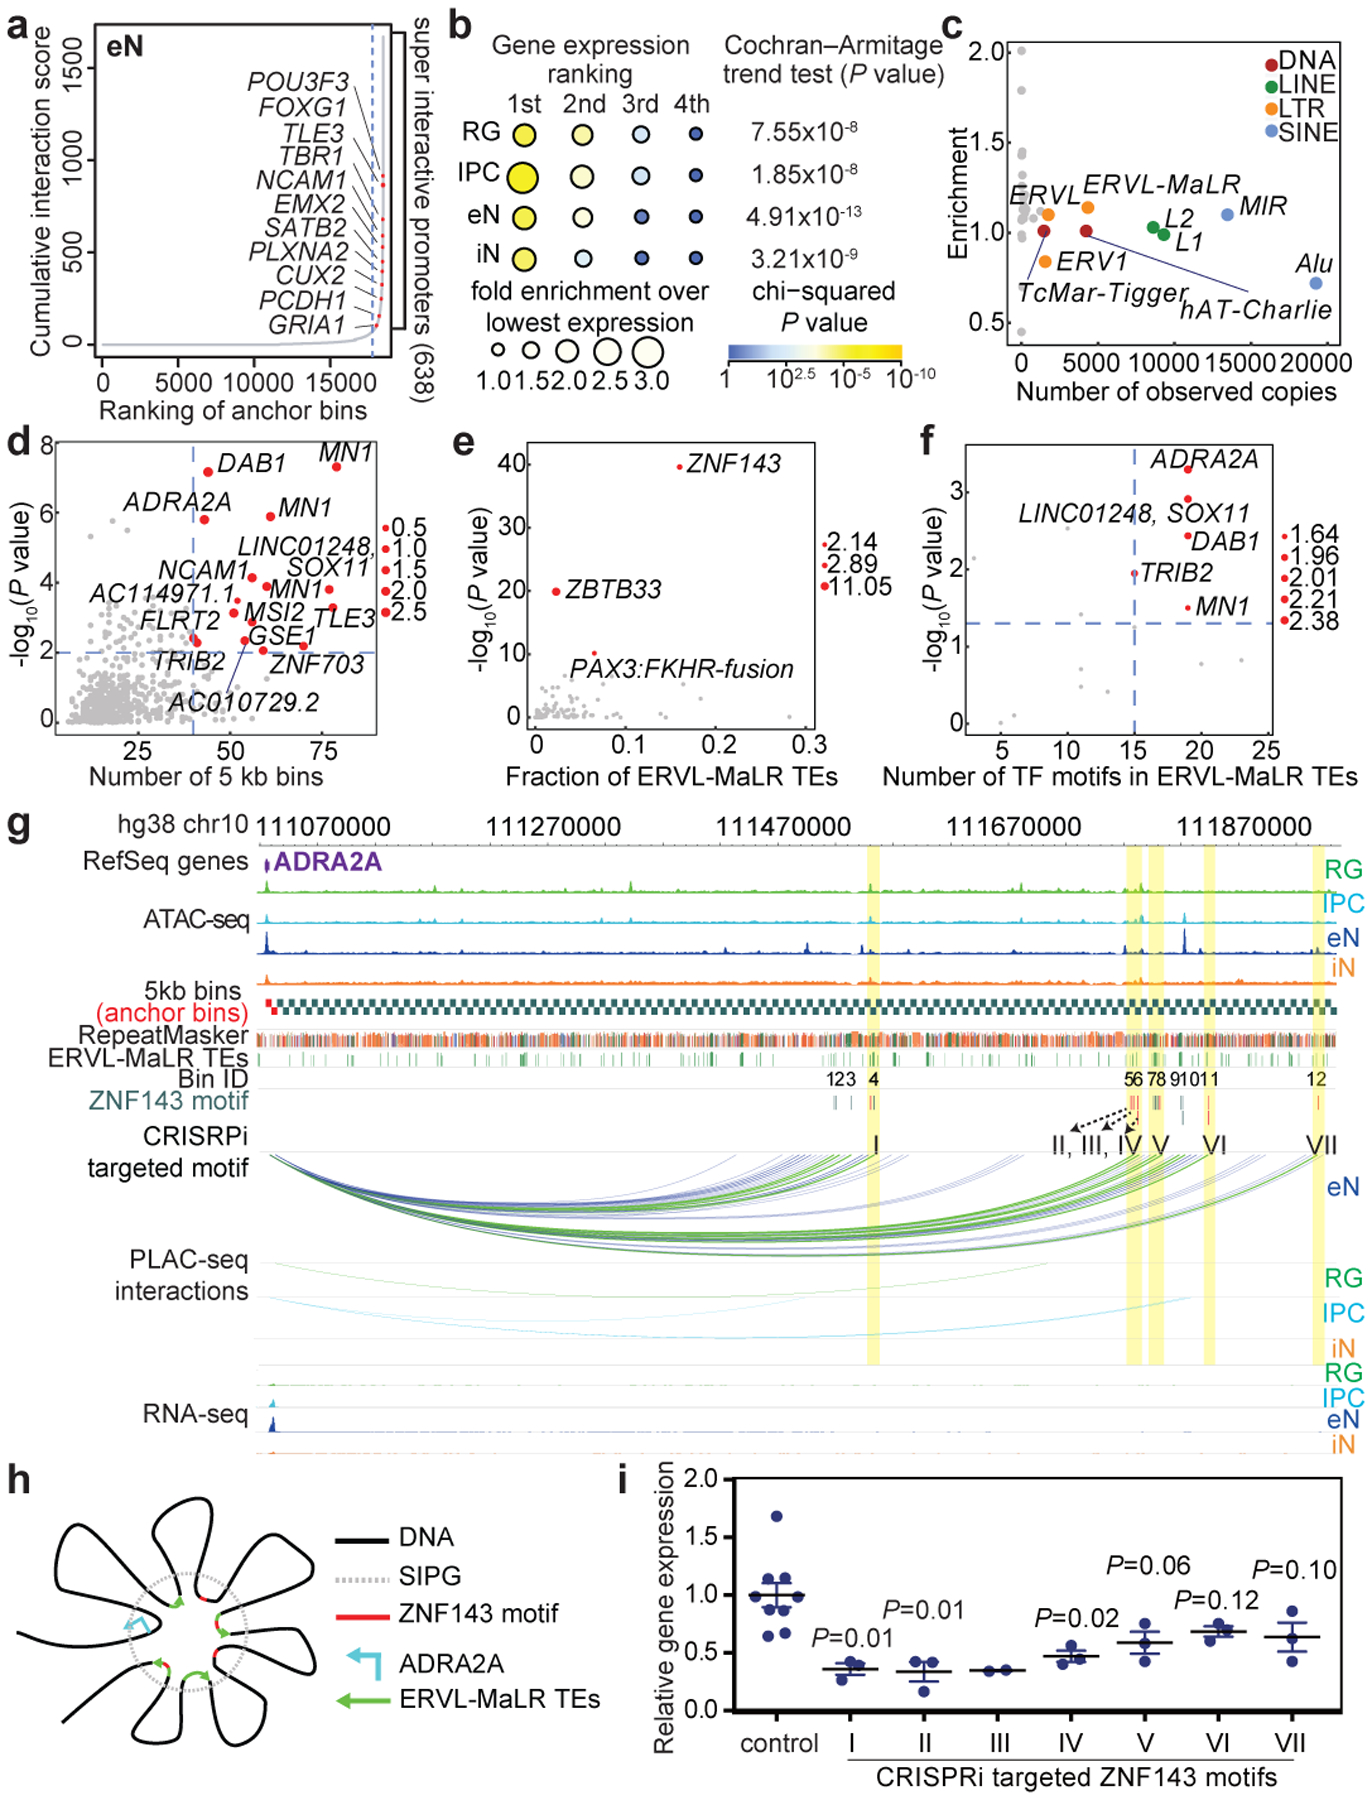
(a) Anchor bins were ranked according to their cumulative interaction scores in eNs. Super interactive promoters (SIPs) are located past the point in each curve where the slope is equal to 1. (b) The number of SIPs was divided by the total number of anchor bins (both SIPs and non-SIPs) associated with genes with the 1st, 2nd, 3rd, and 4th highest expression among all four cell types (n = 13,996 anchor bins with promoters). Fold enrichment was calculated relative to the group with the lowest expression among all four cell types. (c) Scatterplot showing the enrichment and numbers of observed copies for TE families in SIPGs for eNs. TE families occupying more than 1% of the genome are colored. (d) Scatterplot showing the enrichment and numbers of distal interacting regions for ERVL-MaLR TEs in SIPGs for eNs (n = 638 SIPGs). The 16 SIPGs with significant enrichment (hypergeometric test, one-tailed, P < 0.01) and 40 or more distal interacting regions are highlighted. (e) Scatterplot showing the enrichment of TF motifs in ERVL-MaLR TEs for the 16 SIPGs highlighted in (d). Enrichment P values are from HOMER. (f) Scatterplot showing the enrichment of ZNF143 motifs in ERVL-MaLR TEs for the 16 SIPGs highlighted in (d) (Poisson distribution, see methods). (g) Interactions between the ADRA2A promoter and 12 distal interacting regions containing ERVL-MaLR TE-localized ZNF143 motifs. (h) Proposed mechanism for the contribution of TEs to SIP formation. (i) ADRA2A expression was significantly downregulated for 3 of 7 regions relative to control sgRNAs (two-sample t-test, two-tailed, P < 0.05, n = 3 for all regions except region III, which has n = 2). Means are indicated and error bars represent the SEM.
Transposable elements in SIP formation
To explore mechanisms underlying SIP formation, we evaluated the contributions of transposable elements (TEs), which are known to influence 3D chromatin architecture and propagate regulatory elements19–21. We analyzed the enrichment of TEs at the class, family, and subfamily levels in sequences defined by SIPs and their distal interacting regions, termed super interactive promoter groups (SIPGs) (Fig. 3c; Extended Data Fig. 6a–c). We first observe that ERVL-MaLRs are enriched in SIPGs across all four cell types. We identify 16 SIPGs in eNs that exhibit significant enrichment for ERVL-MaLRs and have 40 or more distal interacting regions (hypergeometric test, one-tailed, P < 0.01) (Fig. 3d). TF motif enrichment analysis for ERVL-MaLRs reveals highest enrichment for that of ZNF143, an architectural protein mediating physical chromatin looping between promoters and distal regulatory elements22 (Fig. 3e), corroborating links between ERVL-MaLR TEs and ZNF143 binding in 3T3 and HeLa cells23. We find that ZNF143 motifs are broadly enriched in ERVL-MaLRs, SIPGs, and ERVL-MaLR TEs in SIPGs (Extended Data Fig. 6d–f). The ADRA2A SIPG is characterized by the strongest enrichment of ERVL-MaLR TE-localized ZNF143 motifs (hypergeometric test, one-tailed, P = 1.59×10⁻⁶) (Fig. 3f), spanning 42 distal interacting regions, 25 of which contain ERVL-MaLRs, and 12 of which contain ERVL-MaLR-localized ZNF143 motifs, underscoring elevated ADRA2A expression in eNs (Fig. 3g, Extended Data Fig. 6g, h). ZNF143 motifs can be found in the consensus sequences of the ERVL-MaLR TE subfamilies (Extended Data Fig. 6i, j), suggesting ZNF143 motifs are coordinately expanded by ERVL-MaLR TE insertion, promoting increased binding site redundancy and strengthened assembly of the ADRA2A regulatory unit (Fig. 3h). CRISPRi targeting of ERVL-MaLR TE-localized ZNF143 motifs in the ADRA2A SIPG resulted in the significant downregulation of ADRA2A expression for 3 of 7 regions in eNs (two-sample t-test, two-tailed, P < 0.05) (Fig. 3i), supporting TEs’ role in mediating the formation of higher order chromatin features including SIPs24.
Developmental trajectories from RG to eNs
Since RG, IPCs, and eNs represent a developmental trajectory from dorsal cortical progenitors to mature functional neurons, we grouped genes based on their gene expression and chromatin interactivity along this axis and identified genes linked to cell type-specific processes in RG, IPCs, and eNs (groups 1–3) (Fig. 4a; Extended Data Fig. 7a; Supplementary Table 7). We similarly identified genes with anticorrelated gene expression and chromatin interactivity from RG to eNs (groups 4–5), which represent eN-silenced and RG-silenced genes, respectively. eN-silenced genes are enriched for biological processes linked to chromatin remodeling and epigenetic regulation, while RG-silenced genes are enriched for eN-specific signatures. Furthermore, genes in these two groups are depleted for interactions with enhancers annotated using ChromHMM in the germinal matrix25 while exhibiting enrichment for interactions with TFs containing domains associated with transcriptional repression (Fig. 4b; Extended Data Fig. 7b; Supplementary Table 8). Our results demonstrate that cell type-specific 3D epigenomes are capable of identifying distinct modes of epigenetic regulation during development.
Figure 4. Features of cortical development and partitioning SNP heritability for complex disorders and traits.
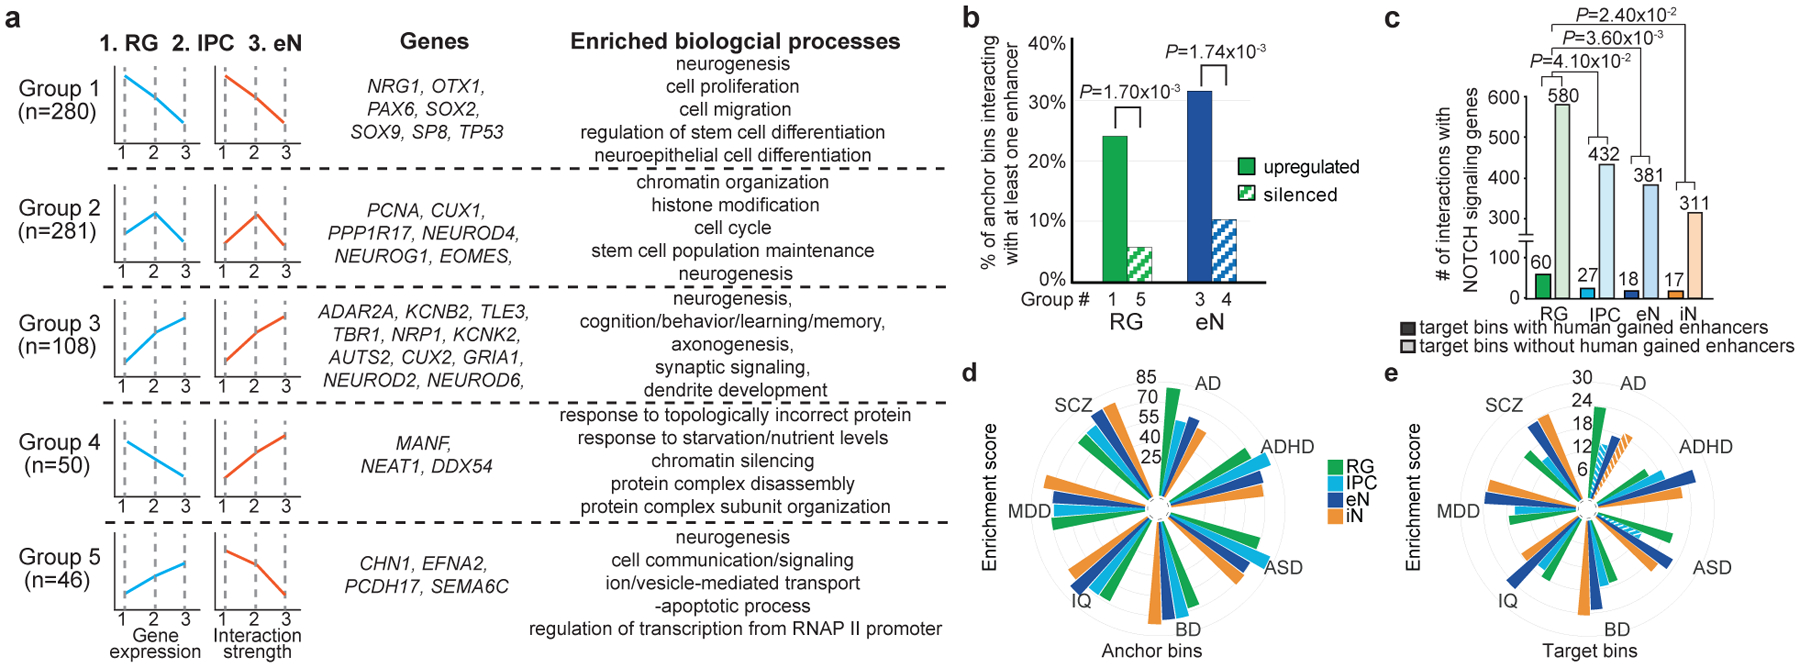
(a) Genes categorized based on their gene expression and chromatin interactivity from RG to eNs. Groups 1–5 represent RG-upregulated, IPC-upregulated, eN-upregulated, eN-silenced, and RG-silenced genes, respectively. Representative genes and biological processes are shown for each group. (b) Groups 1 (75 of 312 bins) and 3 (40 of 127 bins) are enriched for interactions with enhancers relative to groups 4 (6 of 58 bins) and 5 (3 of 52 bins) (chi-squared test, two-tailed). Only bins with at least one interaction were considered. (c) Bar graph of interaction counts from Notch signaling genes to regions with and without HGEs in each cell type (chi-squared test, two-tailed). We observed 2,541, 1,854, 1,869, and 1,610 interactions with HGEs in RG, IPCs, eNs, and iNs, respectively. (d–e) LDSC enrichment scores for each disease and cell type, stratified by PLAC-seq anchor and target bins. Non-significant enrichment scores are shown as striped bars.
Human-specific aspects of cortical development
Human corticogenesis is dramatically distinct from other mammals, driven largely by the increased diversity and proliferative capacity of cortical progenitors26. Notch signaling genes in particular have been implicated in the clonal expansion of RG27,28. Here, RG are enriched relative to other cell types for interactions involving Notch signaling genes29 (Fig. 4c). Compared to other cell types, interactions in RG target a significantly higher proportion of human-gained enhancers (HGEs)30. This suggests that epigenetic modifications surrounding Notch signaling genes in RG contribute to significant neurological differences between humans and other species. Additional biological processes exhibiting enrichment for interactions with HGEs include forebrain neuron fate commitment in RG, neuroblast proliferation in IPCs, forebrain neuron development in eNs, and GABAergic interneuron development in iNs (Supplementary Table 9). We provide detailed annotations of genes interacting with HGEs and in vivo-validated enhancer elements31 in Supplementary Table 10.
Partitioning SNP heritability for complex disorders and traits
Chromatin interactions present a unique resource for linking GWAS variants to their target genes (Extended Data Fig. 7c, d; Supplementary Table 11). Both fetal32 and adult33 brain eQTLs are enriched at chromatin interactions (Extended Data Fig. 8a–c). Besides, we leveraged linkage disequilibrium score regression (LDSC)34,35 to partition SNP heritability for seven complex neuropsychiatric disorders and traits: Alzheimer’s disease (AD), attention deficit hyperactivity disorder (ADHD)36, autism spectrum disorder (ASD)37, bipolar disorder (BD)38, intelligence quotient (IQ)39, major depressive disorder (MDD)40, and schizophrenia (SCZ)41. First, conditioned on a baseline model42, PLAC-seq anchor and target bins exhibit significant enrichment for all of the disorders and traits, except for AD and ASD (Extended Data Fig. 8d). Anchor and target bins are also more informative than distal open chromatin peaks and cell type-specific genes (Extended Data Fig. 8e, f), attributable to the utility of chromatin interactions for linking genes to distal regulatory sequences. Next, we utilized a joint model incorporating all four cell types to investigate cell type-specific patterns of SNP heritability enrichment (Fig. 4d, e). Target bins exhibit more variability than anchor bins in terms of enrichment scores, reflecting the increased cell type specificity of distal regulatory elements compared to promoters. Furthermore, eNs and iNs present higher enrichment scores at target bins relative to RG and IPCs, suggesting the increased relevance of neuronal cell types for these neuropsychiatric traits. We used H-MAGMA43 to identify enriched biological processes for genes interacting with non-coding variants (Extended Data Fig. 9; Supplementary Table 12). Our results recapitulate the roles of lipoprotein metabolism and transport in AD pathophysiology44 in RG. IPCs and eNs are enriched across all diseases with interactions linking SNPs to genes related to neural precursor cell proliferation, axon guidance, and axonogenesis. Finally, our results for SCZ align with extensive evidence that disruption of chromatin regulators contribute significantly to disease risk9,45.
Characterizing distal interacting regions in primary cells
Validating distal regulatory elements in primary cells has proved challenging in the past, with most experiments performed using cell lines or iPSC-derived cells. A major obstacle lies in the robust detection of transcriptional changes in complex, heterogeneous samples. We developed CRISPRview to validate cell type-specific distal regulatory elements in single cells (Fig. 5a). Specifically, primary cultures of GZ or CP samples are first infected with lentivirus expressing mCherry, dCas9-KRAB, and sgRNAs targeting open chromatin peaks interacting with a gene of interest along with lentivirus expressing GFP, dCas9-KRAB, and control sgRNAs. Next, the cells are fixed and stained using antibodies for mCherry, GFP, cell type-specific markers, DAPI, and intronic RNAscope probes targeting the gene of interest. Finally, we leverage SMART-Q46 to compare the number of nascent RNA transcripts between experimental and control sgRNA-treated cells. We validated four regions interacting with the GPX3 promoter, all of which exhibited significant downregulation in terms of GPX3 expression upon silencing (Fig. 5b–d). Meanwhile, silencing three regions interacting with the IDH1 promoter in RG and eNs resulted in the significant downregulation of IDH1 expression in the respective cell types (Extended Data Fig. 10a, b). Finally, we characterized two additional RG-specific loci in TNC and HES1, both of which are annotated as SIPs (Extended Data Fig. 10c–h). The observation of small but significant changes in gene expression supports the hypothesis that multiple interactions frequently work in concert to titrate gene expression
Figure 5. Validation of cell type-specific distal regulatory elements using CRISPRview.
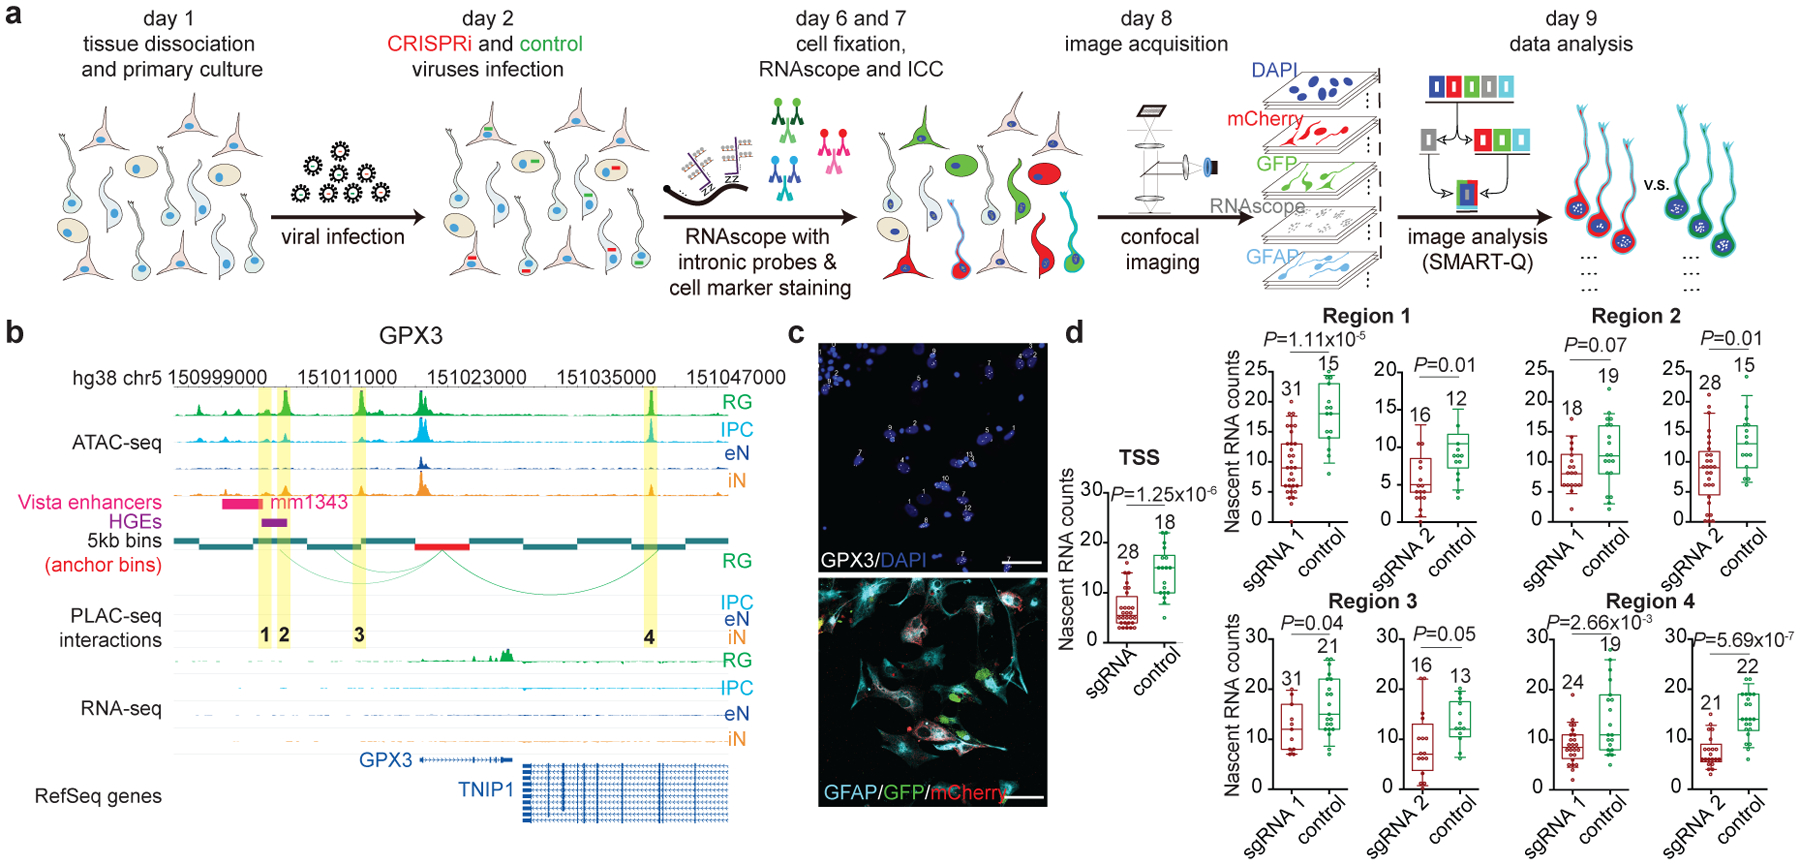
(a) Schematic of the CRISPRview workflow. Image analysis was performed using the SMART-Q pipeline. (b) Interactions between the GPX3 promoter and distal interacting regions containing open chromatin peaks that were targeted for silencing are highlighted. Notably, region 1 overlaps both an HGE and Vista enhancer element (mm1343), supporting its function as a putative enhancer. (c) Representative images show staining for intronic RNAscope probes (white), DAPI (blue), GFAP (light blue), GFP (green), and mCherry (red). The scale bar is 50 μm. (d) Box plots show results for experimental (red) and control (green) sgRNA-treated cells for each region (two-sample t-test, two-tailed). The median, upper and lower quartiles, and 10% to 90% range are indicated. Open circles represent single cells. Sample sizes are indicated above each box plot.
Discussion
Single-cell RNA sequencing studies have highlighted the heterogeneity of the developing human cortex. Despite significant differences in lineage and maturation state, many of the cell types share intriguing similarities in their transcriptional landscapes. For example, iNs express genes for TFs that are typically associated with RG proliferation, including SOX2, as well as with eN differentiation, including ASCL1 and NPAS31. By isolating specific cell types, we are able to distinguish nuanced regulatory programs driving cell type-specific differences during human corticogenesis. We identify SIPs which are enriched for key lineage-specific genes and represent distinct chromatin features from A/B compartments47, TADs48, frequently interacting regions (FIREs)49, and highly interacting regions (HIRs)50. Furthermore, we uncover a mechanism in which TEs propagate binding sites for architectural proteins such as ZNF143, facilitating the formation of multi-interaction clusters that function to sustain transcription. Lastly, by developing CRISPRview, we achieve several emergent advantages for validating distal regulatory elements in primary cells. First, we are able to focus our analysis on specific cell types, circumventing averaging effects associated with bulk measurements in complex samples. Next, we are able to directly compare experimental and control sgRNA-infected cells within the same population. Finally, we achieve enhanced sensitivity and statistical power based on the detection of nascent RNA transcripts in single cells. Future experiments leveraging CRISPRview in live tissue should continue to reveal regulatory relationships in a manner that is truly representative of the complex in vivo environment.
Methods
Ethics statement
Deidentified tissue samples were collected with prior informed consent in strict observance of legal and institutional ethical regulations. All protocols were approved by the Human Gamete, Embryo, and Stem Cell Research Committee (GESCR) and Institutional Review Board (IRB) at the University of California, San Francisco.
Tissue dissociation
The tissue dissociation protocol was adapted from Nowakowski et al, 20171. Briefly, samples were first cut into small pieces in artificial cerebrospinal fluid before being added to pre-warmed papain dissociation media (Worthington #LK003150). The samples were incubated in dissociation media for 45 minutes at 37°C. Next, they were triturated, filtered through a 70 μM nylon mesh, and centrifuged for 8 minutes at 300 g. For individual germinal zone (GZ) and cortical plate (CP) cultures, samples were first cut coronally into thin slices. As previously described, cell density drops dramatically past the outer subventricular zone, enabling the clear identification of the outer filamentous zone and subplate. Samples were dissected along this boundary to separate the GZ from the CP prior to dissociation.
Sample fixation
Mid-gestational human cortex samples between GW15 and GW22 were fixed in 2% paraformaldehyde prepared in PBS with gentle agitation for 10 minutes at room temperature. Glycine was added to a final concentration of 200 mM to quench the reactions, and the samples were centrifuged for 5 minutes at 4°C and 500 g. The samples were washed twice with PBS before being frozen at −80°C for further processing.
Permeabilization and staining
The cell pellet was thawed on ice and resuspended in PBS containing 0.1% Triton-X-100 for 15 minutes. The cells were then washed twice with PBS and resuspended in 5% BSA in PBS for staining. Staining proceeded for at least one hour with FcR Blocking Reagent (Miltenyi Biotech, 1/20 dilution), EOMES PE-Cy7 (Invitrogen, Cat 25-4877-42, Clone WD1928, Lot 1923396, 1/10 dilution), PAX6 PE (BD Biosciences, Cat 561552, Clone O18–1330, Lot 8187686, 1/10 dilution), SOX2 PerCP-Cy5.5 (BD Biosciences, Cat 561506, Clone O38– 678, Lot 8165744, 1/10 dilution), and SATB2 Alexa Fluor 647 (Abcam, Cat ab196536, Clone EPNCIR130A, Lot GR3208103-I and GR228747–2, 1/100 dilution). After staining, the cells were centrifuged for 5 minutes at 500 g, and the pellet was diluted into PBS. When sorting cells for RNA-seq, 1% RNasin Plus RNase Inhibitor (Promega) was added to all buffers, and acetylated BSA was used to prepare 5% BSA in PBS for staining.
FACS
AbC Total Antibody Compensation Beads (Thermo Fisher) were used to generate single color compensation controls prior to sorting. Sorting was conducted on either the FACSAria II, FACSAria IIu, or FACSAria Fusion instruments using a 70 μM nozzle, and cells were collected in 5 ml tubes pre-coated with FBS. A sample of each sorted cell population was reanalyzed on the same machine to assess purity. Cells were collected by centrifuging for 10 minutes at 500 g, and the cell pellet was frozen at −80°C for further processing. When sorting cells for RNA-seq, cells were collected in 5 ml tubes pre-coated with both FBS and RNAlater (Thermo Fisher).
Primary cell culture
Following dissociation, cells were plated onto Matrigel-coated coverslips in 48 well plates or chamber slides at a density of approximately 0.7×10⁶ cells per well. All cell culture was handled in sterile conditions. The cells were infected with lentivirus the day after plating, and media was changed every two days. Media was composed of 96% DMEM/F-12 with GlutaMAX, 1% N-2, 1% B-27, and 1% penicillin/streptomycin. The cells were grown in 8% oxygen and 5% carbon dioxide and harvested four days post-infection for CRISPRview. For qPCR at the ADRA2A locus, the cells were harvested six days post-infection.
PLAC-seq
PLAC-seq was performed according to Fang et al., 201611. 1 to 5 million cells were used to prepare each library. Digestion was performed using 100 U MboI for 2 hours at 37°C, and chromatin immunoprecipitation was performed using Dynabeads M-280 sheep anti-rabbit IgG (Invitrogen #11203D) superparamagnetic beads bound with 5 μg anti-H3K4me3 antibody (Millipore 04–745). Sequencing adapters were added during PCR amplification. Libraries were sent for paired-end sequencing on the HiSeq X Ten or NovoSeq 6000 instruments (150 bp paired-end reads). fastp was applied to trim reads to 100 bp for all downstream analysis.
MAPS
We used the MAPS pipeline to call significant H3K4me3-mediated chromatin interactions at a resolution of 5 kb based on our PLAC-seq data. First, bwa mem was used to map raw reads to hg38. Unmapped reads and reads with low mapping quality were discarded, and the resulting read pairs were processed as previously reported12. To define PLAC-seq anchor bins, we took the union of peaks identified by MACS2 using the options “--nolambda --nomodel --extsize 147 --call-summits -B --SPMR” and an FDR cutoff of 0.0001 for all read pairs with interaction distance < 1 kb in each cell type. Next, we classified read pairs as AND, XOR, or NOT interactions based on whether both, one, or neither of the interacting 5 kb bins overlapped anchor bins (Extended Data Fig. 3a). Since we were specifically interested in identifying long-range H3K4me3-mediated chromatin interactions, we retained only read pairs corresponding to intrachromosomal XOR and AND interactions with interaction distances between 10 kb and 1 Mb. We downsampled the number of read pairs separately for each chromosome to ensure that we started with the same number of read pairs for each cell type.
To call significant interactions, we employed a Poisson regression-based approach to normalize systematic biases from restriction sites, GC content, sequence repetitiveness, and ChIP enrichment. We fitted models separately for AND and XOR interactions and calculated FDRs for interactions based on the expected and observed contact frequencies between interacting 5 kb bins. We grouped interactions whose ends were located within 15 kb of each other into clusters and classified all other interactions as singletons. We defined our significant H3K4me3-mediated chromatin interactions as interactions with 12 or more reads, normalized contact frequency (defined as the ratio between the observed and expected contact frequency) ≥ 2, and FDR < 0.01 for clusters and FDR < 0.0001 for singletons. This was based on the reasoning that biologically meaningful interactions are more likely to appear in clusters, while singletons are more likely to represent false positives.
Reproducibility analysis
PCA was performed based on the normalized contact frequencies for interacting 5 kb bins from our PLAC-seq data. We first extracted AND and XOR interactions based on cell type-specific anchor bins for each of the 11 replicates. Next, we applied zero-truncated Poisson regression adjusting for the same biases as the MAPS pipeline. We derived normalized contact frequencies based on the ratios between the observed and expected contact frequencies for interacting 5 kb bins, with the expected contact frequencies being the fitted values from the zero-truncated Poisson regression. Normalized contact frequencies were then log-transformed and merged across the 11 replicates. The merged data was used to generate the PCA plots. We restricted our analysis to interacting 5 kb bins in both 300 and 600 kb windows for Extended Data Fig. 2d.
ATAC-seq
ATAC-seq was performed as previously described using the Nextera DNA Library Prep Kit (Illumina #FC-121–1030). Briefly, fixed cells were washed once with ice cold PBS containing 1x protease inhibitor before being resuspended in ice cold nuclei extraction buffer (10 mM Tris-HCl pH 7.5, 10 mM NaCl, 3 mM MgCl2, 0.1% Igepal CA630, and 1x protease inhibitor) for 5 minutes. 50,000 cells were aliquoted, exchanged into 50 μL 1x Buffer TD, and incubated with 2.5 μL TDE1 enzyme for 45 minutes at 37°C with shaking. Following transposition, 150 μL reverse crosslinking solution (50 μL 1 M Tris pH 8.0, 100 μL 10% SDS, 2 μL 0.5 M EDTA, 10 μL 5 M NaCl, 800 μL water, and 2.5 μL 20 mg/mL Proteinase K) was added to each tube and incubated at 65°C overnight. DNA was column purified, PCR amplified, and size-selected for fragments between 300 and 1000 bp. Libraries were sent for paired-end sequencing on the NovaSeq 6000 instrument (150 bp paired-end reads). Raw reads were trimmed to 50 bp, mapped to hg38, and processed using the ENCODE pipeline (https://github.com/kundajelab/atac_dnase_pipelines) running the default settings. The optimal naive overlap peaks for each cell type were used for all downstream analysis.
RNA-seq
We extracted total RNA from the sorted cell populations using the RNAstorm™ FFPE RNA extraction kit (Cell Data Sciences #CD501) starting with 5×10⁵ to 1.5×10⁶ cells. The quality of the extracted RNA was checked by determining the percentage of RNA fragments with size > 200 bp (DV200) from the Agilent 2100 Bioanalyzer. RNA samples with DV200 >= 40% were used for library construction. First, samples were depleted of ribosomal RNA using the KAPA RNA HyperPrep Kit with RiboErase (HMR #KK8560). Next, we performed first and second strand synthesis, dA-tailing, and sequencing adapter ligation. cDNA was cleaned up and sequencing adapters were added via PCR amplification. Libraries were sent for paired-end sequencing on the NovaSeq 6000 instrument (150 bp paired-end reads). Raw reads were trimmed using Trim Galore and aligned to hg38 using STAR running the standard ENCODE parameters, and transcript quantification was performed in a strand-specific manner using RSEM with the GENCODE 29 annotation. The edgeR package in R was used to calculate TMM-normalized RPKM values for each gene, and the mean values across all replicates were used for all downstream analysis.
GO enrichment analysis
Protein coding and non-coding RNA genes participating in cell type-specific XOR interactions were used for GO enrichment analysis. Only interactions with open chromatin peaks overlapping promoters (defined as the 1 kb region centered around a gene’s TSS) in their anchor bins and distal open chromatin peaks (defined as open chromatin peaks not overlapping promoters) in their target bins were used. A minimum RPKM of 0.5 was used to retain only genes that were expressed, and the resulting genes were input into DAVID 6.8 running functional annotation clustering using the “GOTERM_BP_ALL” ontology. Group enrichment scores based on the geometric mean of EASE scores for terms in each group are reported. To report enriched biological processes for genes interacting with non-coding variants for each disease and cell type, we assigned non-coding SNPs for each disorder and trait to genes based on interactions with the 5 kb bins containing their promoters. Next, we ran H-MAGMA using our annotations to generate ranked lists of gene-level association statistics which were used to perform functional enrichment analysis using the gprofiler2 package in R51: gost(ranked.list, organism=“hsapiens”, ordered_query=T, significant=F, correction_method=“fdr”, sources=“GO:BP”).
TF motif enrichment analysis
We used 200 bp windows centered around open chromatin peaks participating in cell type-specific XOR interactions for TF motif enrichment analysis using HOMER. We used the complete set of vertebrate motifs from the JASPAR database, specifying the “-float” option to adjust the degeneracy threshold, and the entire genome was used as the background. The binomial distribution was used to calculate p-values. For the analysis of co-expression modules in the developing human cortex, we downloaded co-expression modules from Nowakowski et al. 20171. Specifically, we used the “all” network set for all four cell types, as well as network sets matched to individual cell types as follows: “page.rg” for RG, “page.ipc” for IPCs, “page.n” for eNs, and “vage.in” for iNs. This was to capture biological variation both between and within cell types, respectively. We used HOMER to perform TF motif enrichment analysis for the set of open chromatin peaks interacting with promoters of genes assigned to each co-expression module. For ranking TFs according to the number of co-expression modules they were enriched for in each network set and cell type, an FDR threshold of 0.05 was applied.
Super interactive promoters
We used an approach similar to calling super-enhancers52 to annotate super interactive promoters (SIPs) in each cell type. For each anchor bin, we calculated the cumulative interaction score, defined as the sum of the −log10FDR for interactions overlapping each anchor bin. We used this metric as it accounts for noise and is directly associated with the interaction strength in PLAC-seq data. Next, we prepared plots of ranked cumulative interaction scores for anchor bins in each cell type and defined SIPs to be anchor bins located past the point in each curve where the slope is equal to 1.
Cell type-specific versus shared genes
We classified each gene as cell type-specific or shared according to its Shannon entropy score across all four cell types. Specifically, for each gene, we calculated its relative expression value in each cell type, defined as its RPKM in that cell type divided by the sum of its RPKMs across all four cell types. Next, we calculated the Shannon entropy score for each gene based on its relative expression values across all four cell types. We classified a gene as specific for a cell type if met the following conditions: its Shannon entropy score was < 0.01, its RPKM was > 1 in that cell type, and its RPKM in that cell type was the highest across all four cell types. All other genes with RPKM > 1 were classified as shared.
TE enrichment in SIPGs
TE enrichment in SIPGs was evaluated as follows. The foreground enrichment was defined as the number of TEs at the class, family, or subfamily levels overlapping SIPGs in each cell type. The background enrichment was defined as the number of TEs overlapping all interacting 5 kb bins (both SIPGs and non-SIPGs). At least 50% of a TE had to overlap a 5 kb bin for it to be considered overlapping. The overall enrichment was defined as the foreground enrichment divided by the background enrichment multiplied by the proportion of interacting 5 kb bins that were assigned to SIPGs.
For the enrichment of SIPGs for ERVL-MaLR TEs, the foreground enrichment for each SIPG was defined as the number of distal interacting regions containing one or more ERVL-MaLR TEs for that SIPG. The background enrichment for each SIPG was defined as the number of randomly shuffled distal interacting regions containing one or more ERVL-MaLR TEs for that SIPG. We computed the background enrichment over 100 permutations. The overall enrichment was defined as the foreground enrichment divided by the background enrichment. The significance for each SIPG was calculated using the hypergeometric distribution as follows:
where “q” is the number of distal interacting regions containing one or more ERVL-MaLR TEs for that SIPG, “m” is the number of 5 kb bins containing one or more ERVL-MaLR TEs on the same chromosome, “n” is the number of 5 kb bins containing no ERVL-MaLR TEs on the same chromosome, and “k” is the size of the SIPG.
ZNF143 motif enrichment
For the enrichment of SIPGs for ERVL-MaLR TE-localized ZNF143 motifs, the foreground enrichment for each SIPG was defined as the number of ERVL-MaLR TE-localized ZNF143 motifs in its distal interacting regions. FIMO53 was used to detect ZNF143 motifs within ERVL-MaLR TEs. The background enrichment was defined as the total number of ZNF143 motifs in the SIPG. The overall enrichment was defined as the foreground enrichment divided by the background enrichment multiplied by the proportion of the SIPG that is occupied by ERVL-MaLR TEs. The significance for each SIPG was calculated using a Poisson distribution where the number of events (k) is the foreground enrichment and the rate parameter (l) is the background enrichment multiplied by the proportion of the SIPG that is occupied by ERVL-MaLR TEs.
For evaluating the genome-wide enrichment of ZNF143 motifs in ERVL-MaLR and THE1C TEs, we first used FIMO to scan all ERVL-MaLR and THE1C TEs for instances of ZNF143 motifs. As a background, we scanned 100 sets of chromosome- and length-matched, non-overlapping sequences randomly sampled to avoid gaps and blacklisted regions in the human genome. We used a similar approach to evaluate the enrichment of ZNF143 motifs in ERVL-MaLR TEs in SIPGs. For evaluating the enrichment of ZNF143 motifs in SIPGs, we compared the mean numbers of ZNF143 motifs per 5 kb bin for distal interacting regions across all SIPGs to 100 sets of chromosome- and length-matched, non-overlapping sequences randomly sampled to avoid gaps and blacklisted regions in the human genome. For comparing the distributions of the mean numbers of ZNF143 motifs per 5 kb bin for actual versus shuffled SIPGs, we sampled distal interacting regions for each SIPG 100 times on the same chromosome in a non-overlapping manner.
Target gene annotation for enhancers and GWAS SNPs
To determine whether a human-gained enhancer, Vista enhancer element, or GWAS SNP interacted with a gene, we determined whether any of its promoters participated in interactions with the element of interest on the other end. All human-gained enhancers and Vista enhancer elements were expanded to a minimum width of 5 kb, and all GWAS SNPs were expanded to a minimum width of 1 kb to account for potential functional sequences around each element. Furthermore, we determined the proportion of GWAS SNPs interacting with their nearest and more distal genes, except when all the promoters for the nearest gene fell within the same 5 kb bin as the GWAS SNAP and could not be resolved for interactions.
Partitioning SNP heritability for complex disorders and traits.
We leveraged linkage disequilibrium score regression (LDSC) to partition SNP heritability separately for each complex neuropsychiatric disorder and trait based on joint models incorporating PLAC-seq anchor or target bins across all cell types. We also ran LDSC using a baseline model42 consisting of coding, UTR, promoter, and intron regions, histone marks, DNase I hypersensitive sites, ChromHMM/Segway predictions, regions that are conserved in mammals, super-enhancers, FANTOM5 enhancers, and LD-related annotations (recombination rate, nucleotide diversity CpG content, etc.) that are not specific to any cell type. This informs us whether our epigenomic annotations for a given cell type are informative for SNP heritability enrichment compared to a comprehensive set of genomic features that has been widely adopted in the field. To compare different epigenomic annotations for each cell type, we used both distal open chromatin peaks and 100 kb windows around the transcription start and end sites of cell type-specific genes according to their Shannon entropy scores and RPKM > 1.
Validating ERVL-MaLR-localized ZNF143 motifs
CRISPRi and qRT-PCR were used to validate ERVL-MaLR TE-localized ZNF143 motifs at distal interacting regions in the ADRA2A SIPG. Of the 12 distal interacting regions containing ERVL-MaLR TE-localized ZNF143 motifs, we were able to design sgRNAs to target ZNF143 motifs overlapping open chromatin peaks for 7 of the regions. ZNF143 motifs were extended by 100 bp in both directions for designing sgRNAs. To maximize CRISPRi efficiency, we designed two sgRNAs for each region and cloned them into the dual expression cassette in the CRISPRi vector as described for CREST-seq54. sgRNA sequences were confirmed by Sanger sequencing and packaged into lentivirus. Primary cell cultures enriched for eNs based on SATB2 staining were infected with lentivirus for 24 hours, and mRNA was extracted on day 7. qRT-PCR was used to quantify ADRA2A expression using the following primers: TCGTCATCATCGCCGTGTTC (forward) and AAGCCTTGCCGAAGTACCAG (reverse). All sgRNA sequences used for validation can be found in Supplementary Table 13.
Validating distal interacting regions using CRISPRview
The CRISPRi vector was modified from the Mosaic-seq55 and CROP-seq vectors56. The hU6-sgRNA expression cassette from the CROPseq-Guide-Puro vector (Addgene #86708) was cloned and inserted downstream of the WPRE element in the Lenti-dCas9-KRAB-blast vector (Addgene #89567). The blasticidin resistance gene was replaced with either mCherry or EGFP. sgRNAs targeting open chromatin peaks in distal interacting regions were designed using CHOPCHOP57. Single-stranded DNA was annealed and ligated into the CRISPRi vector at the BsmBI cutting locus. Single clones were picked following transformation, and the sgRNA sequences were confirmed by Sanger sequencing. For lentiviral packaging, the CRISPRi vector, pMD2.G (Addgene #12259), and psPAX (Addgene #12260) were transformed into 293T cells using PolyJet (SignaGen Laboratories #SL100688) according to the manufacturer’s instructions. Virus-containing media was collected three times over 16 to 20 hours and concentrated using Amicon 10K columns. All lentivirus was immediately stored at −80°C. Primary cell cultures were infected with virus (MOI < 1) 24 hours after plating, and cells were fixed with 4% PFA four days post-infection for FISH and immunostaining. All sgRNA sequences used for validation can be found in Supplementary Table 13.
FISH experiments were performed using the RNAScope Multiplex Fluorescent V2 Assay kit (ACDBio #323100). Probes targeting intronic regions for GPX3 (ACDBio #572341), IDH1 (ACDBio #832031), TNC (ACDBio #572361), and HES1 (ACDBio #560881) were custom-designed, synthesized, and labeled with TSA Cyanine 5 (Perkin Elmer #NEL705A001KT, 1:1000 dilution). Fixed cells were pretreated with hydrogen peroxide for 10 minutes and Protease III for 15 minutes, and probes were hybridized and amplified according to the manufacturer’s instructions. Slides were washed with PBS before blocking with 5% donkey serum in PBS for 30 minutes at room temperature. Next, slides were incubated with primary antibodies against mCherry (Abcam ab205402, 1/200), GFP (Abcam ab1218, 1/500), and GFAP (Abcam ab7260, 1/400) for RG or SATB2 (Abcam ab92446, 1/300) for eNs overnight at 4°C, followed by incubation with Alexa Fluor 488 donkey anti-mouse IgG (Thermo Fisher Scientific #A21202, 1/800), Alexa-546 nm donkey anti-rabbit IgG (Thermo Fisher Scientific #A10040, 1/500), and Alexa-594 nm goat anti-chicken IgG (Thermo Fisher Scientific #A11042, 1/500) for 1 hour at room temperature. 3D confocal microscopy images were captured using a Leica TCS SP8 with a 40x oil-immersion objective lens (NA = 1.30). The z-step size was 0.4 μm. For five color multiplexed imaging, three sequential scans were performed to avoid overlapping spectra. The excitation lasers were 405 nm and 594 nm, 488 nm and 633 nm, and 561 nm. All images were obtained using the same acquisition settings. For FISH analysis, we developed a Python-based pipeline called Single-Molecule Automatic RNA Transcription Quantification (SMART-Q) for quantifying nascent RNA transcripts in single cells. Briefly, the RNAscope channel was first filtered and fitted in three dimensions using a Gaussian model. Next, segmentation was performed in two dimensions on the DAPI channel to ascertain the location of each nucleus. Finally, segmentation was performed on the remaining channels to identify experimental and control sgRNA-infected RG or eNs for nascent RNA transcript quantification.
Extended Data
Extended Data Figure 1. Representative contour plots depicting FACS gating strategy.
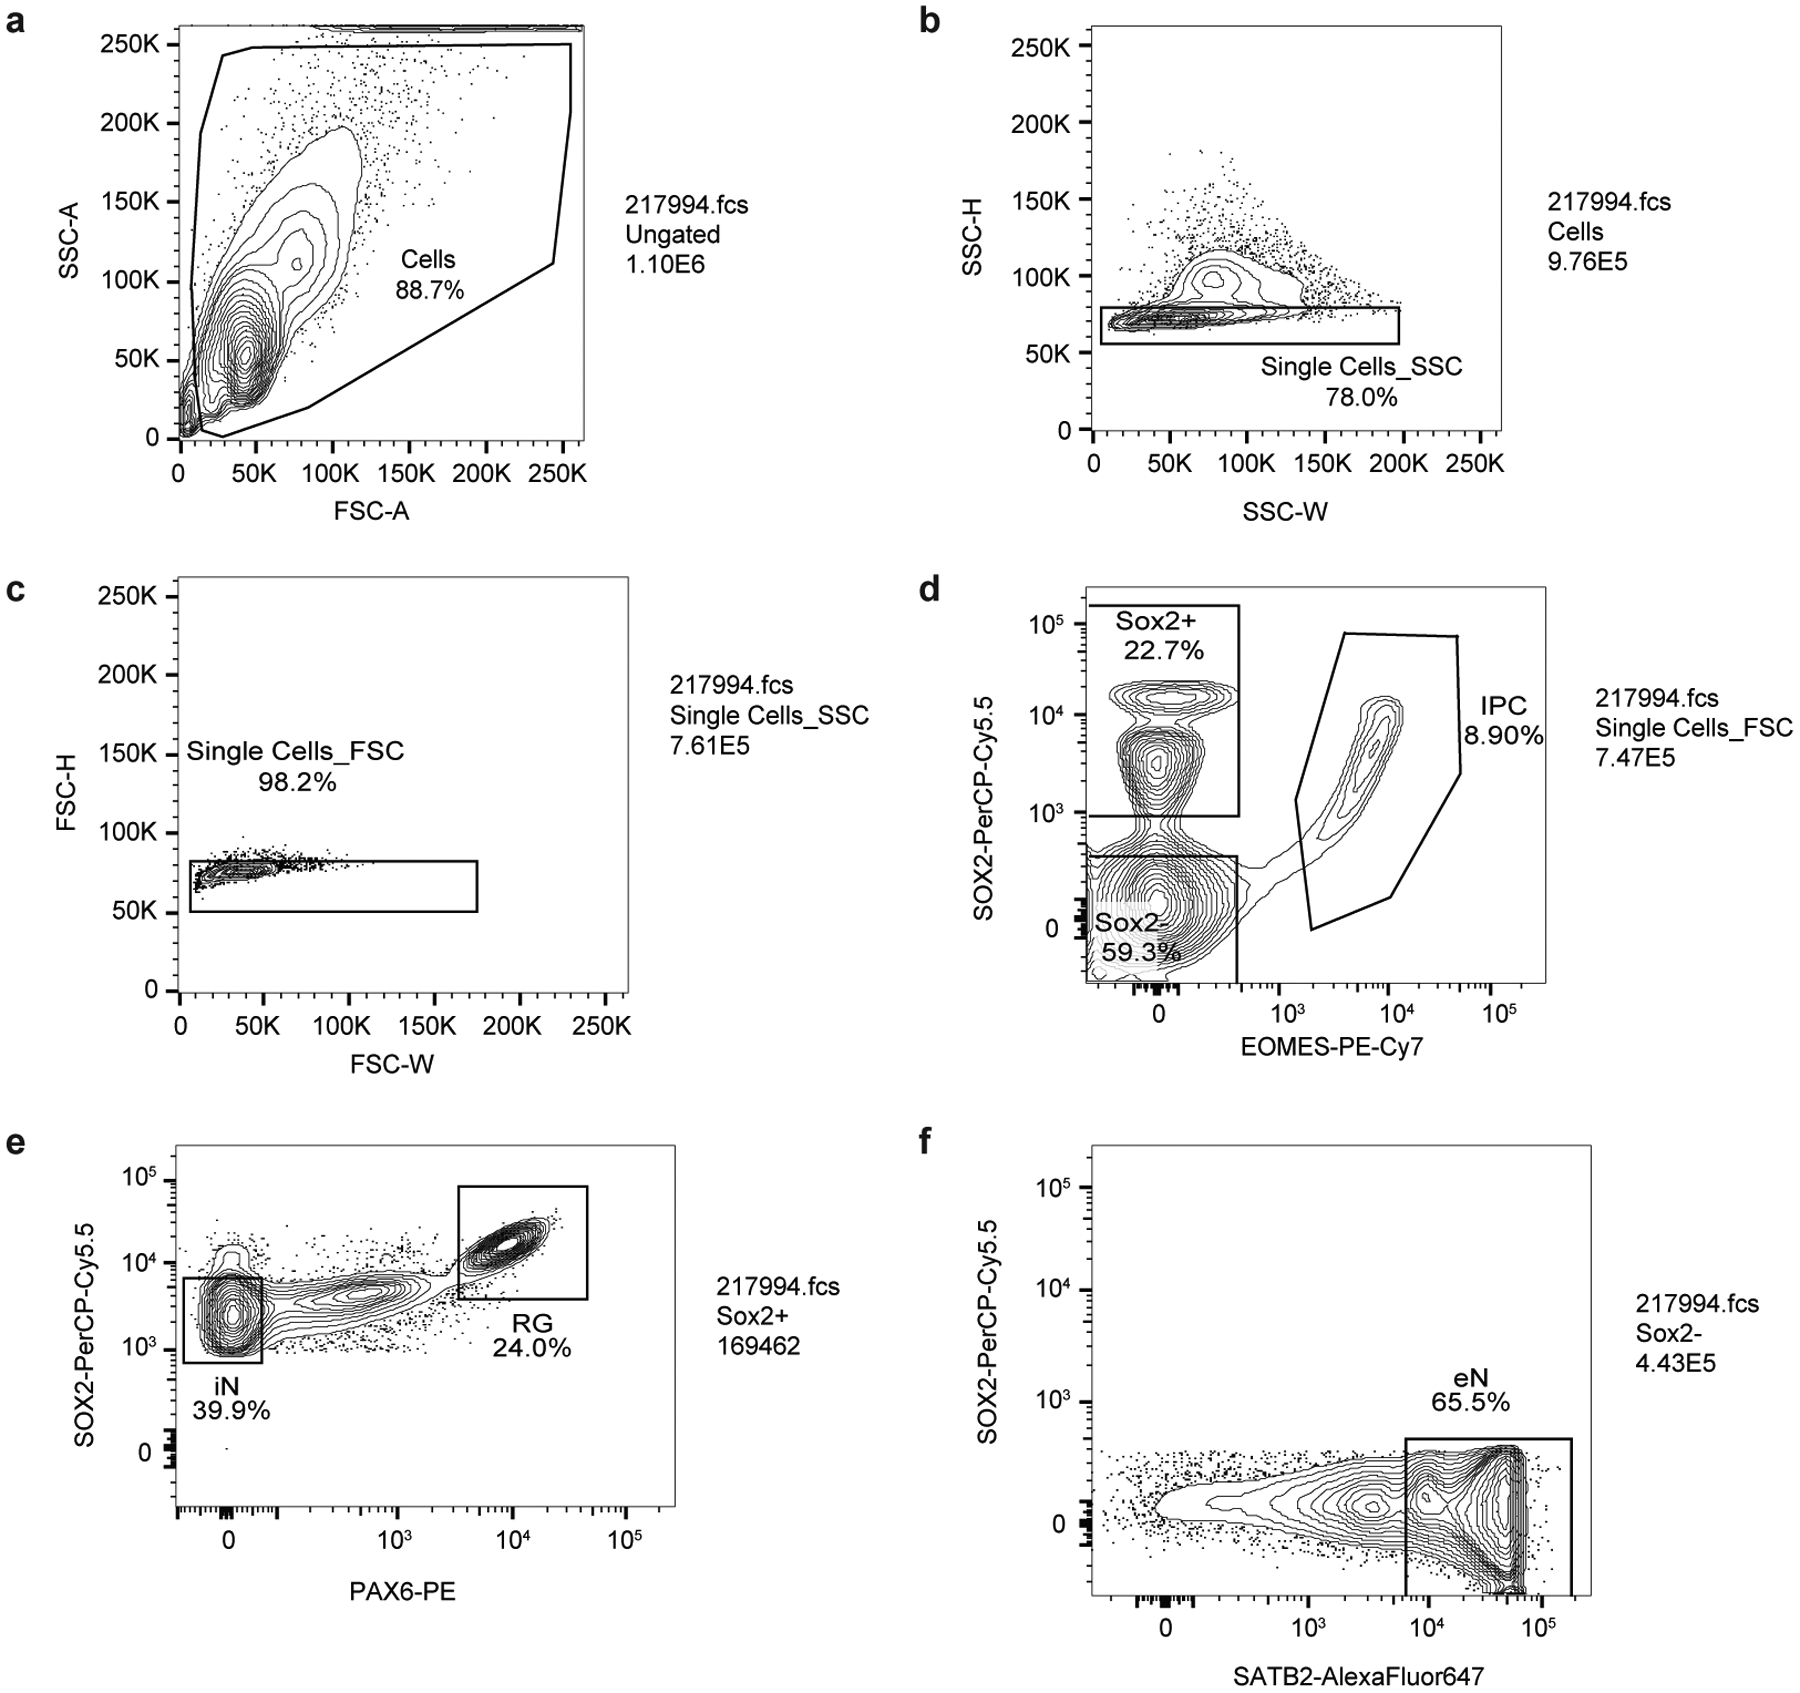
(a) Cells were separated from debris of various sizes based on the forward scatter area (FSC-A) and side scatter area (SSC-A). Specifically, they were passed through two singlet gates using the width and height metrics of the (b) side scatter (SSC-H versus SSC-W) and (c) forward scatter (FSC-H versus FSC-W). (d) SOX2+, and SOX2-, and intermediate progenitor (IPC) populations were isolated by gating on EOMES-PE-Cy7 and SOX2-PerCP-Cy5.5 staining. (e) Radial glia (RG) and interneurons (iNs) were isolated based on high PAX6/high SOX2 and medium SOX2/low PAX6 staining, respectively. (f) Excitatory neurons (eNs) were isolated from the SOX2- population by gating on SATB2-Alexa Fluor 647 staining.
Extended Data Figure 2. Reproducibility between RNA-seq, ATAC-seq, and PLAC-seq replicates.
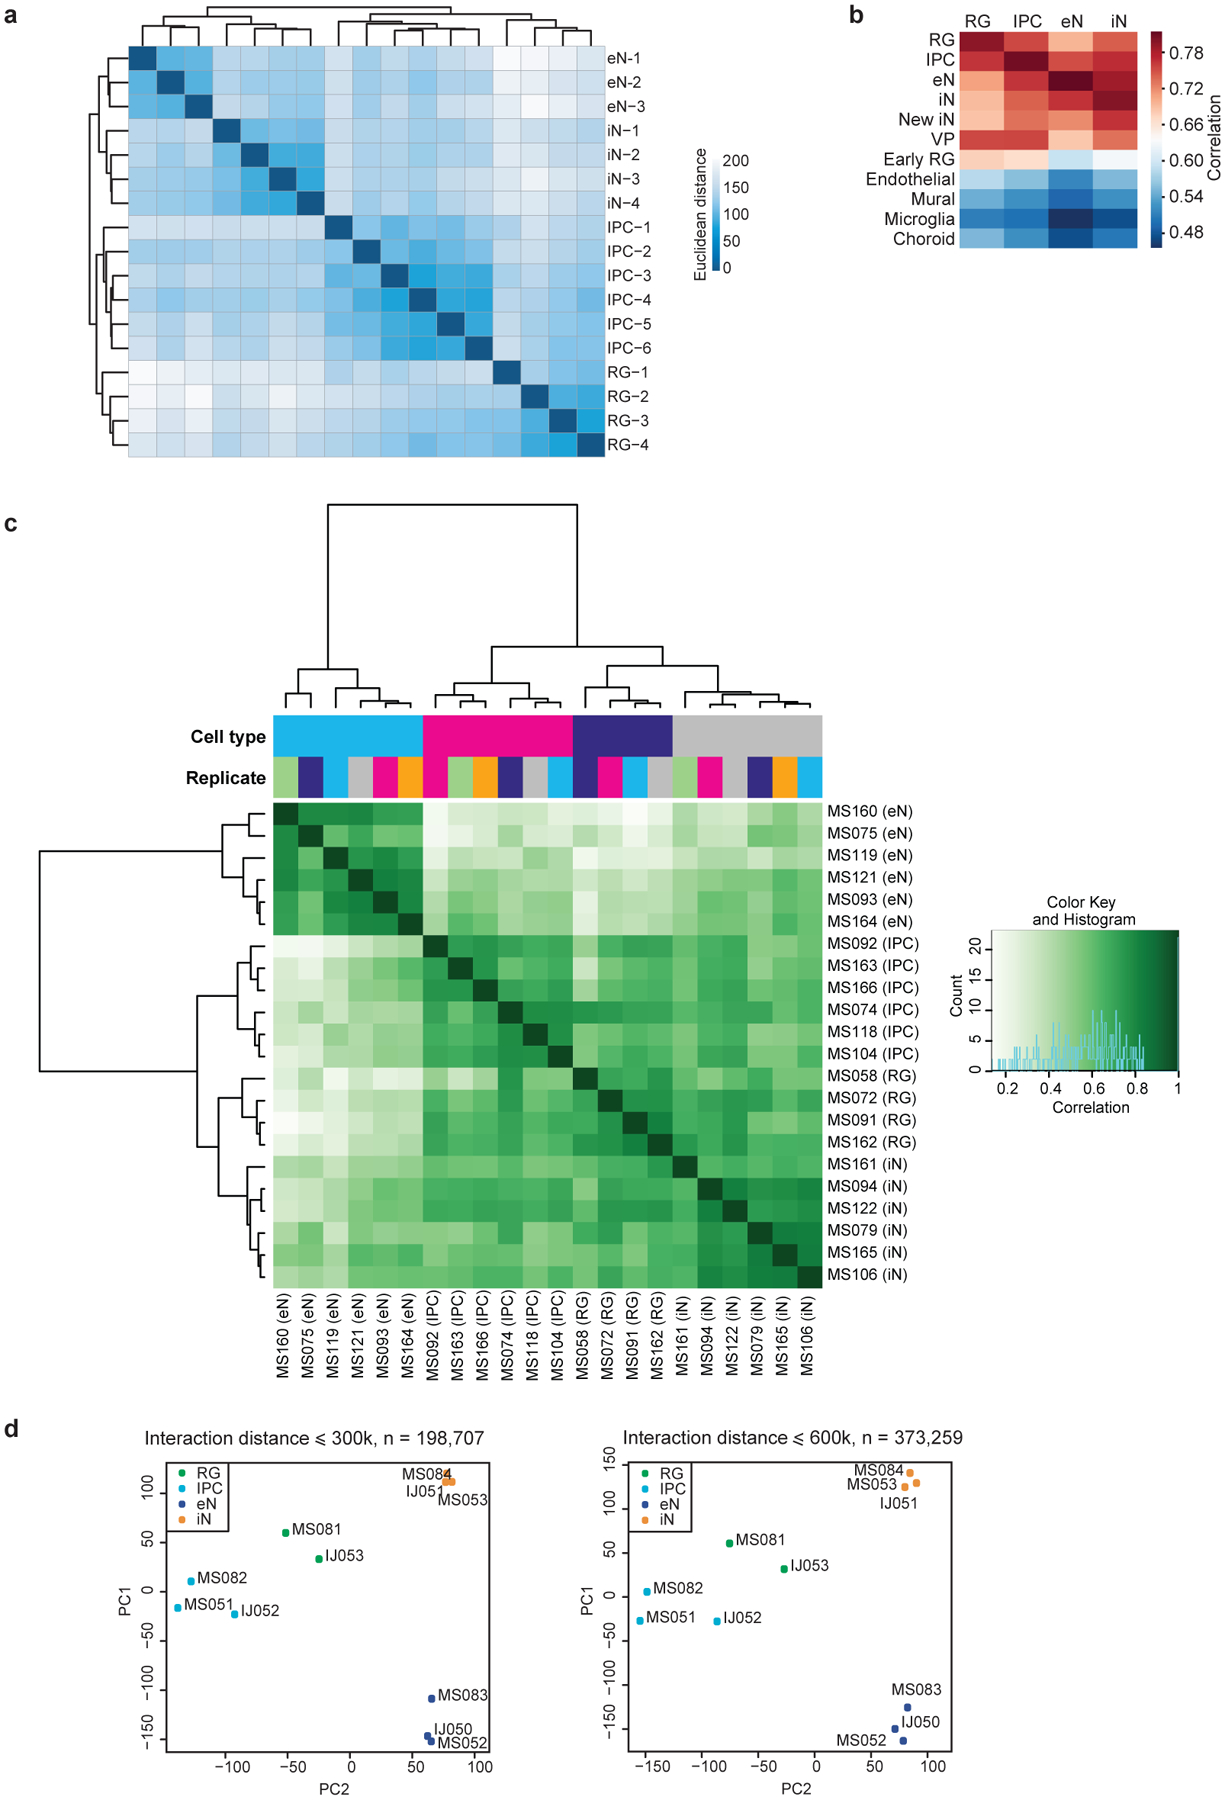
(a) RNA-seq replicates were hierarchically clustered according to gene expression sample distances using DESeq2. (b) Heatmap showing correlations between gene expression profiles for the sorted cell populations and single-cell RNA sequencing (scRNA-seq) data in the developing human cortex. The sorted cell populations exhibited the highest correlation with their corresponding subtypes while exhibiting reduced correlation with the endothelial, mural, microglial, and choroid plexus lineages. (c) Heatmap showing correlations and hierarchical clustering for read densities at open chromatin peaks across all ATAC-seq replicates. (d) Principle component analysis (PCA) was performed based on normalized contact frequencies across all PLAC-seq replicates (see methods). PCA was performed using interacting 5 kb bins in both 300 and 600 kb windows.
Extended Data Figure 3. Identification of significant H3K4me3-mediated chromatin interactions.
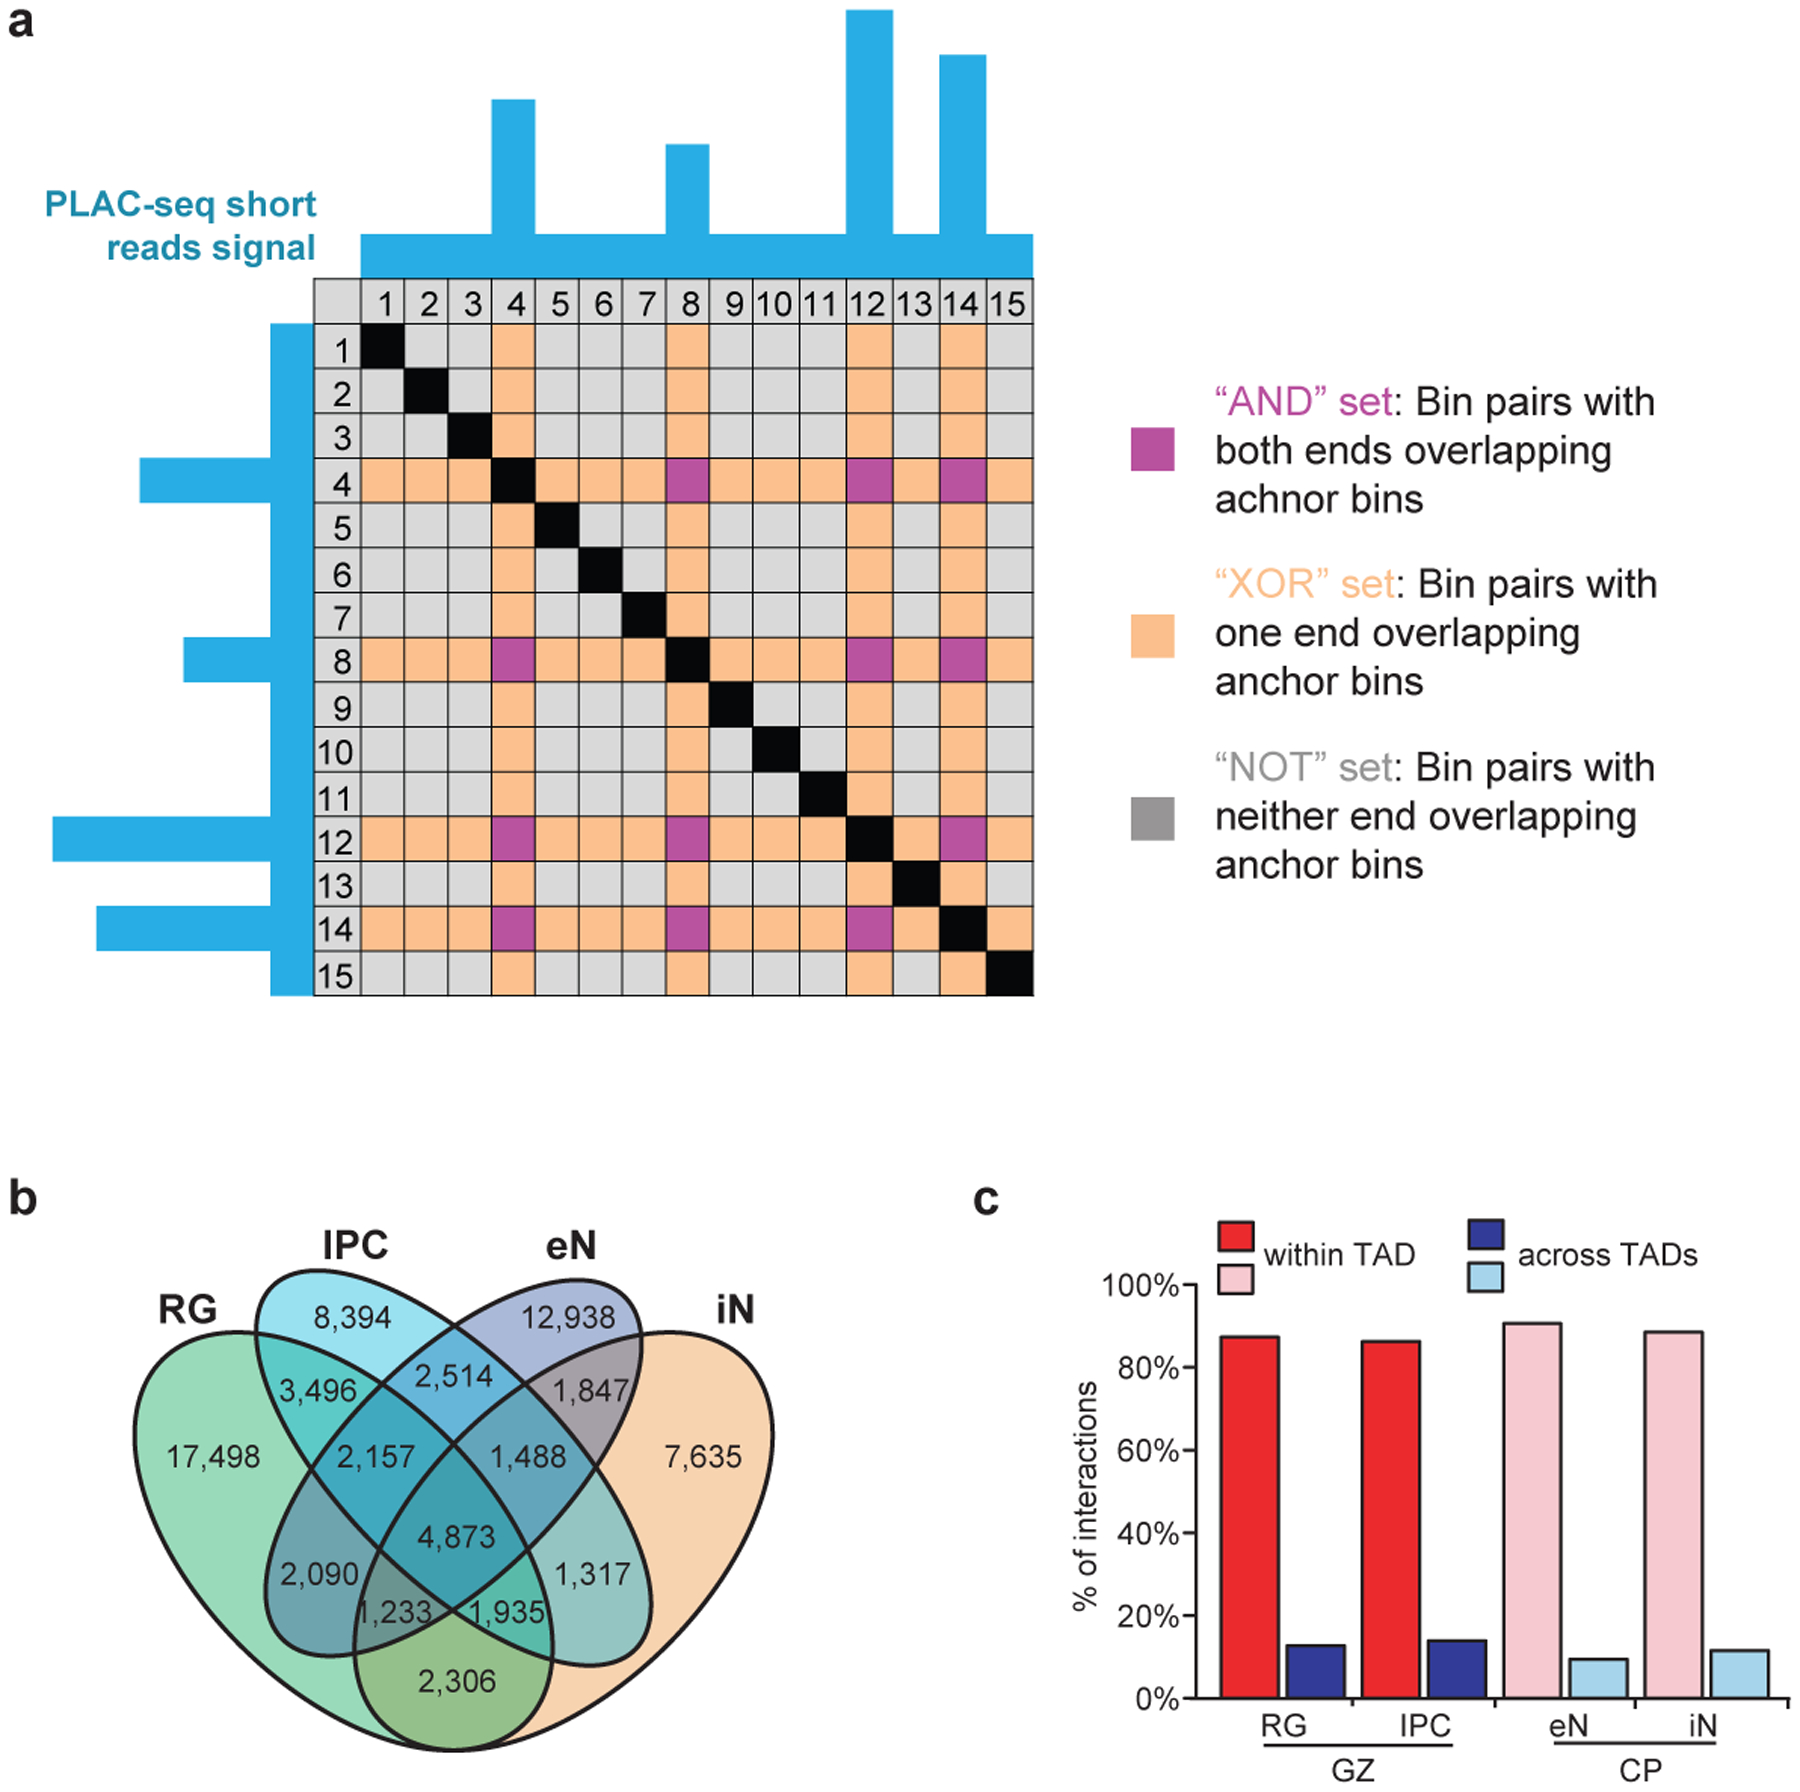
(a) Illustration of XOR and AND interactions in a representative PLAC-seq contact matrix. The blue tracks represent H3K4me3 peaks at anchor bins. Purple cells represent AND interactions where both of the interacting bins are anchor bins. Orange cells represent XOR interactions where only one of the interacting bins is an anchor bin. Grey cells represent NOT interactions where neither of the interacting bins are anchor bins. (b) Venn diagram displaying cell type-specificity for interactions in each cell type. (c) Proportions of interactions occurring within and across TADs in the GZ and CP for matching cell types.
Extended Data Figure 4. Chromatin interactions influence cell type-specific transcription.
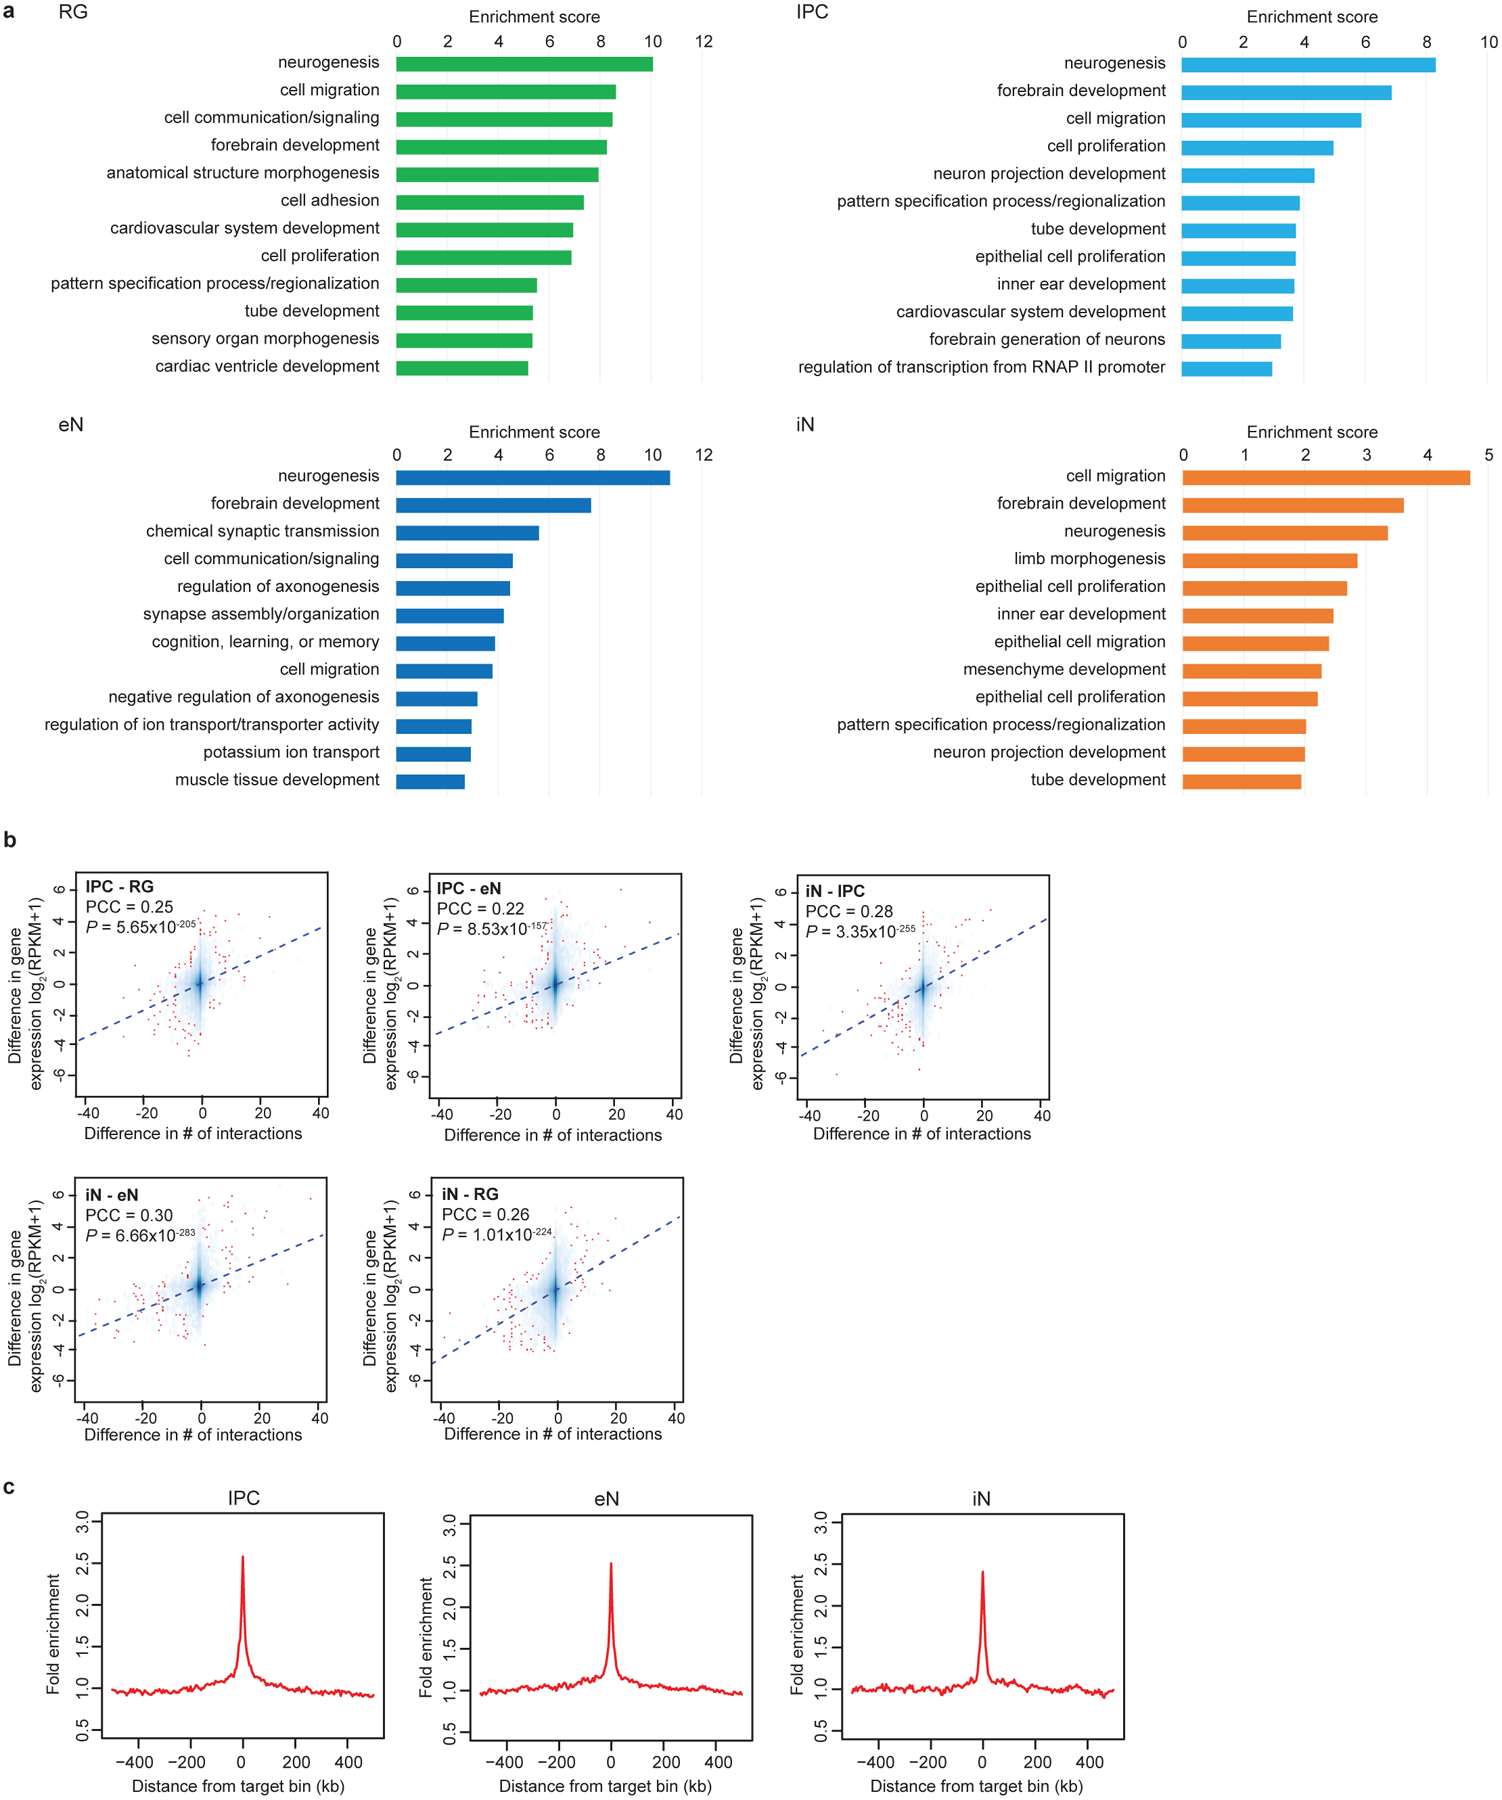
(a) GO enrichment analysis for genes participating in cell type-specific interactions. The top annotation clusters from DAVID are reported along with their group enrichment scores for each cell type (see methods). (b) Scatterplots showing the correlation between the difference in the number of interactions for each promoter and the difference in the expression of the corresponding genes across all cell types (Pearson product-moment correlation coefficient, two-tailed, n = 13,996 anchor bins with promoters). The trendline from linear regression is shown. (c) Fold enrichment of open chromatin peaks over distance-matched background regions in 1 Mb windows around distal interacting regions for IPCs, eNs, and iNs.
Extended Data Figure 5. Super interactive promoters are enriched for lineage-specific genes.
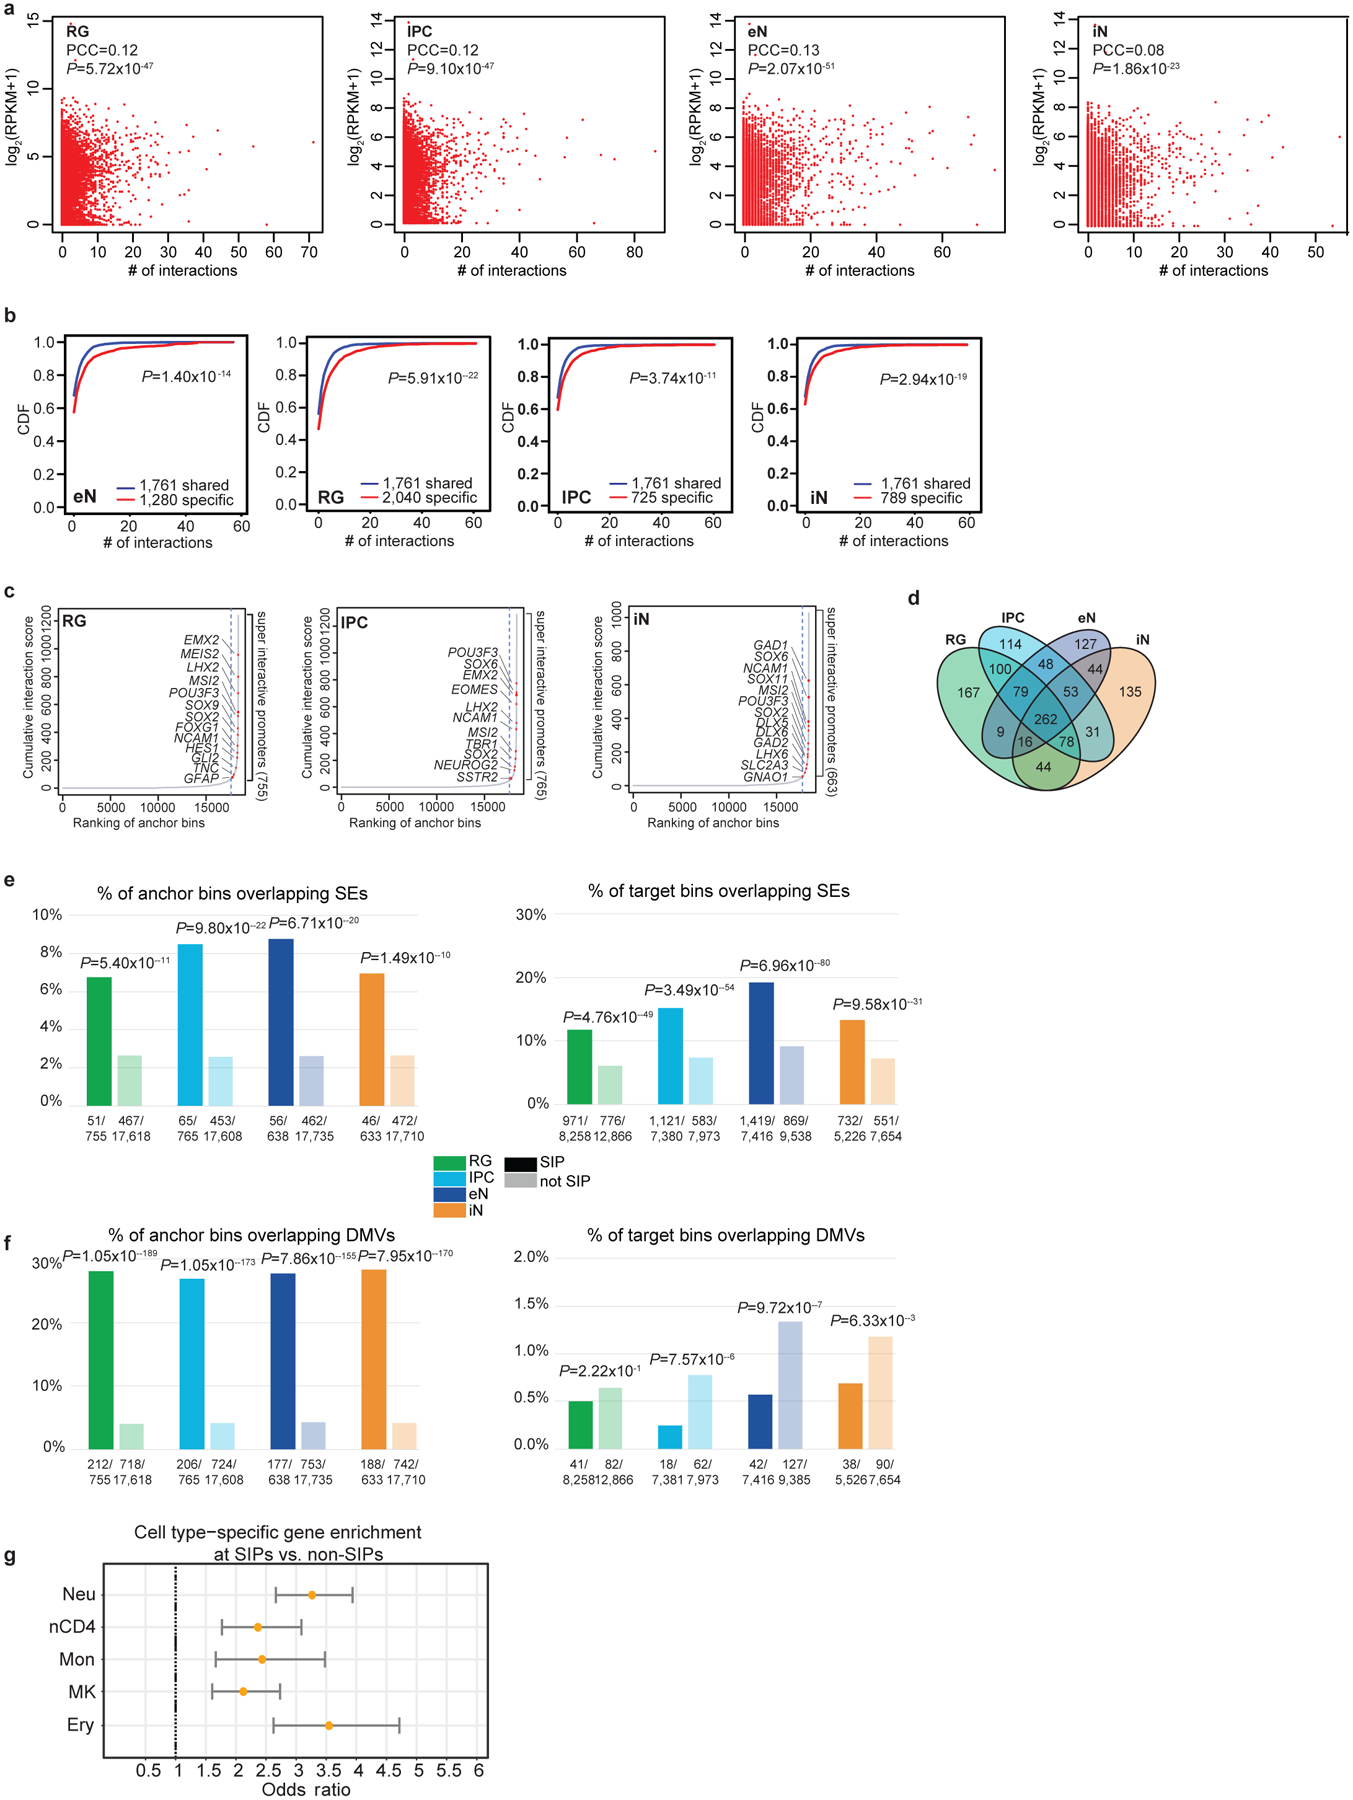
(a) Scatterplots showing the correlation between interaction counts and gene expression at promoters for each cell type (Pearson product-moment correlation coefficient, two-tailed, n = 13,996 anchor bins with promoters). (b) CDF plots of the numbers of interactions for shared versus cell type-specific genes for each cell type (two-sample t-test, two-tailed). (c) Anchor bins were ranked according to their cumulative interaction scores in RG, IPCs, and iNs. Super interactive promoters (SIPs) are located past the point in each curve where the slope is equal to 1. (d) Venn diagram displaying cell type-specificity for SIPs in each cell type. (e-f) Enrichment of super-enhancers and DMVs at SIPs versus non-SIPs (left) and distal interacting regions for SIPs versus non-SIPs (right) (Fisher’s exact test, two-tailed). Super-enhancers were based on data in the fetal brain and adult cortex, while DMVs were based on data in 40 and 60 day cerebral organoids with closely matched gene expression profiles to mid-fetal cortex samples. (g) Forrest plot showing that SIPs identified in hematopoietic cells are analogously enriched for cell type-specific over shared genes. Odds ratios and 95% confidence intervals are shown. We identified 554, 709, 460, 712, and 401 SIPs in neutrophils, naive CD4+ T cells, monocytes, megakaryocytes, and erythroblasts, respectively.
Extended Data Figure 6. Transposable elements in SIP formation.
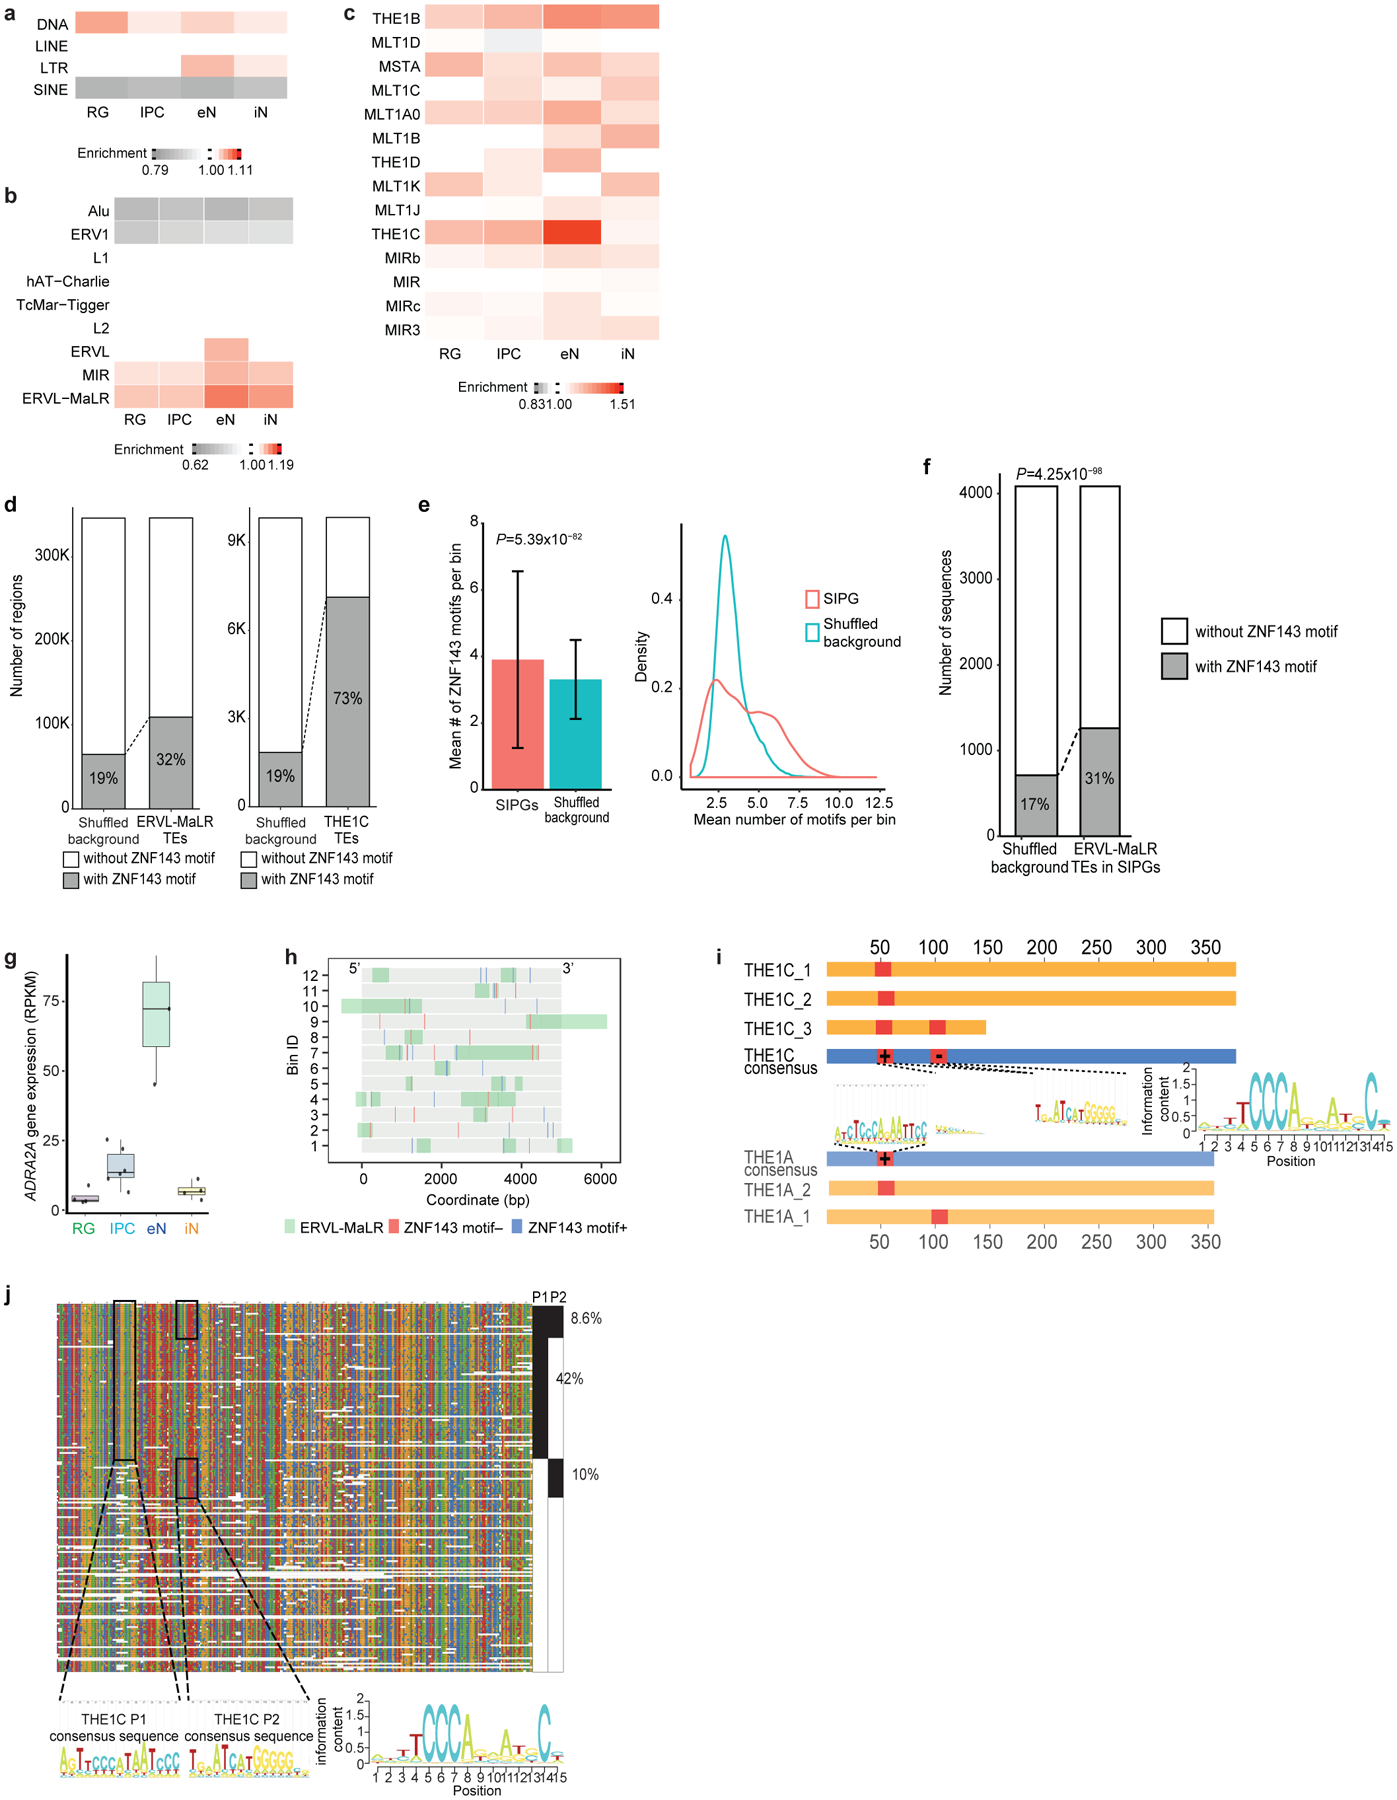
(a-c) Enrichment of TEs at the class (a), family (b), and subfamily (c) levels in SIPGs for each cell type. Only TE families occupying more than 1% of the genome are shown in (b). Only TE subfamilies from the MIR and ERVL-MaLR TE families occupying more than 0.1% of the genome are shown in (c). (d) Both ERVL-MaLR TEs (left, 32% versus 19% of sequences, P < 2.2*10−16, binomial test, two-tailed) and THE1C TEs (right, 73% versus 19% of sequences, P < 2.2*10−16, binomial test, two-tailed) are enriched over background sequences for ZNF143 motifs in eNs. (e) ZNF143 motifs are enriched at SIPGs in eNs (left, P = 5.39×10−82, two-sample t-test, two-tailed, n = 8,894 distal interacting regions). Means are indicated and error bars represent the SEM. Distributions comparing the number of ZNF143 motifs per bin for actual versus shuffled SIPGs are shown (right, P < 2.2*10−16, Kolmogorov-Smirnov test, two-tailed, n = 638 SIPGs). (f) ERVL-MaLR TEs in SIPGs are enriched over background sequences for ZNF143 motifs in eNs (31% versus 17% of sequences, P = 4.3×10−98, binomial test, two-tailed). (g) Box plots showing elevated ADRA2A gene expression in eNs. The median, upper and lower quartiles, minimum, and maximum are indicated. (h) Illustration of the 12 distal interacting regions containing ERVL-MaLR TE-localized ZNF143 motifs in the ADRA2A SIPG. ZNF143 motifs are colored by strand. The bin numbers correspond to Fig. 3j. (i) Conservation of ERVL-MaLR TEs in the ADRA2A SIPG. Blue bars indicate consensus sequences, yellow bars indicate ERVL-MaLR TEs, and red bars indicate ZNF143 motifs. (j) Alignment of THE1C TEs in the human genome to their consensus sequence. The THE1C subfamily contains two ZNF143 motifs, one at positions 47–61 (P1), and another at positions 96–110 (P2).
Extended Data Figure 7. Developmental trajectories and mapping complex disorder- and trait-associated variants to their target genes.
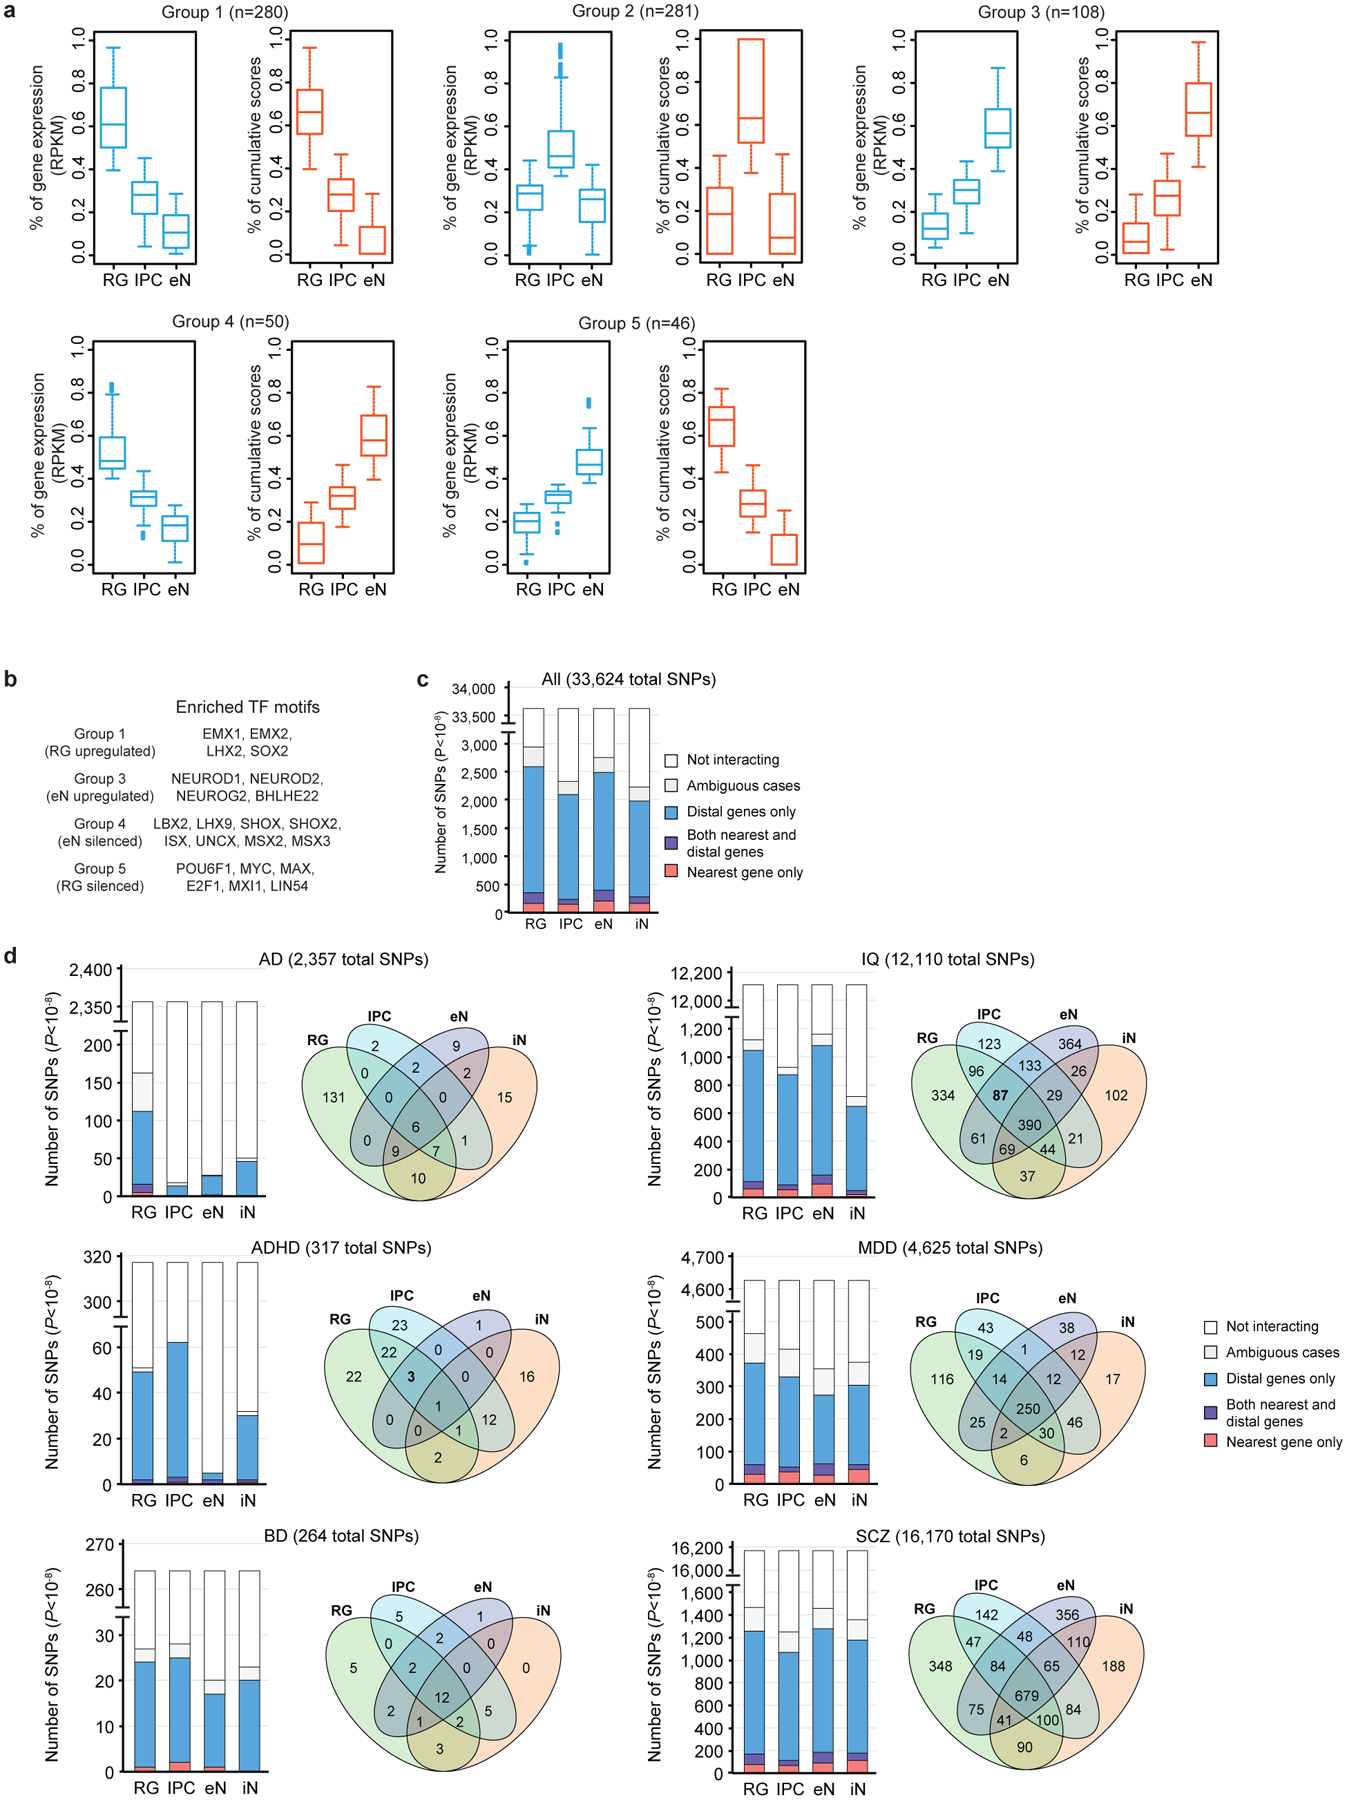
(a) Box plots showing the distributions of gene expression and cumulative interaction scores for the groups identified in Fig. 4a. The median, upper and lower quartiles, minimum, and maximum are indicated. (b) Groups 4 and 5 are enriched for interactions with TFs containing domains associated with transcriptional repression. (c-d) Counts of the numbers of GWAS SNPs (P < 10−8) interacting with their nearest gene only, with both their nearest and more distal genes, and with more distal genes only across all diseases (c) and specific disorders and traits (d).
Extended Data Figure 8. Partitioning SNP heritability for complex disorders and traits using alternative epigenomic annotations.
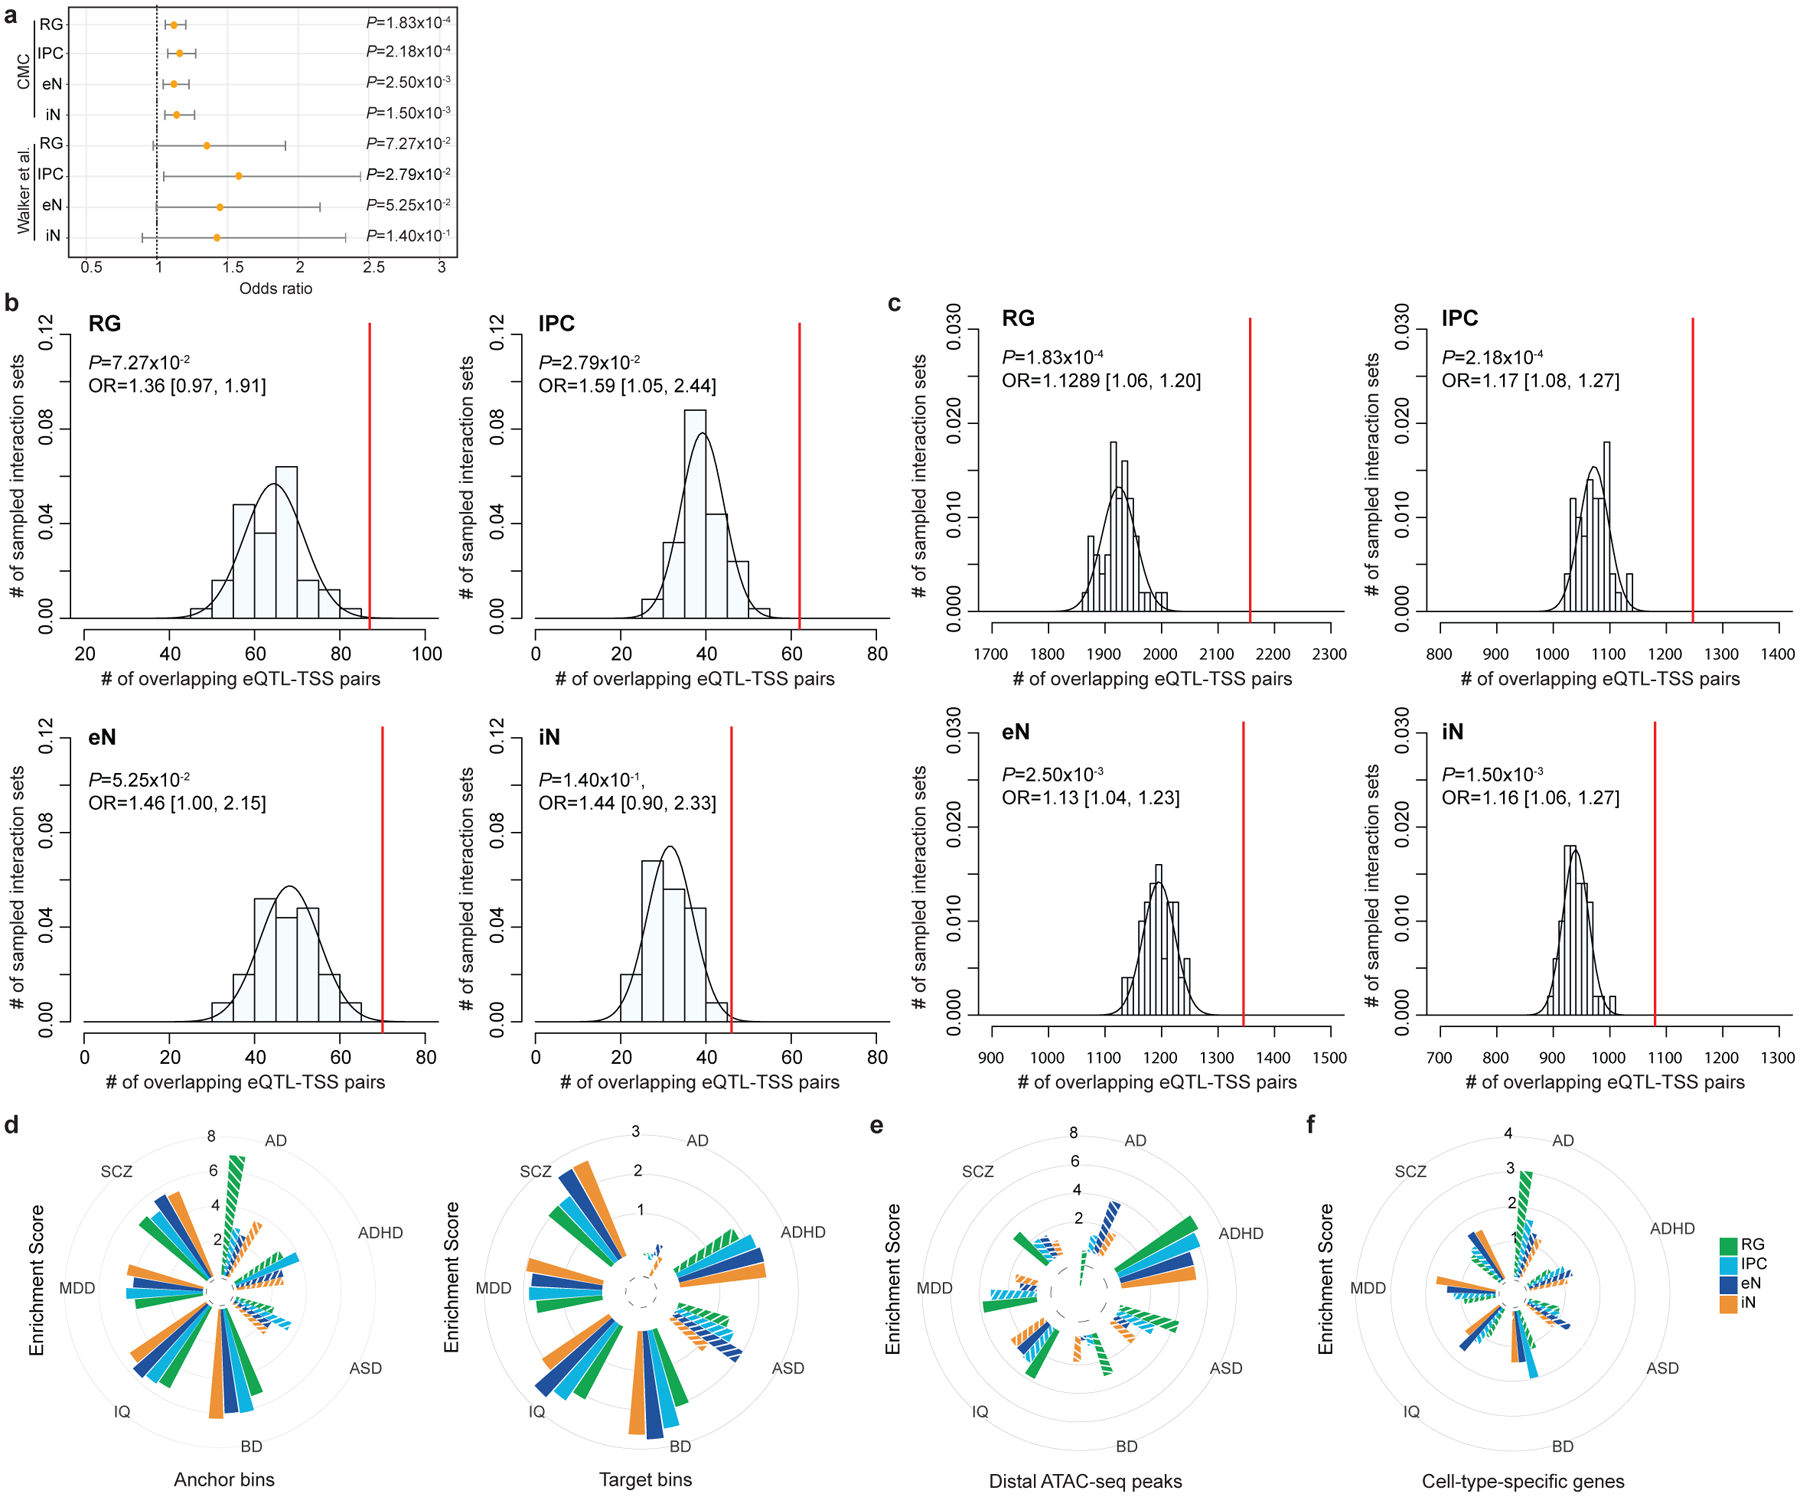
(a) Forrest plot showing the enrichment of fetal and adult brain eQTL-TSS pairs in our interactions compared to n = 50 sets of distance-matched control interactions (Fisher’s exact test, two-tailed). Odds ratios and 95% confidence intervals are shown. The increased significance of adult brain eQTLs can be attributed to the larger sample size of the CommonMind Consortium (CMC) study (n = 1,332,863), while larger odds ratios were observed for the more closely matched fetal brain eQTLs (n = 6,446). (b-c) Histograms displaying the numbers of adult and fetal brain eQTL-TSS pairs recapitulated by n = 50 sets of distance-matched control interactions in each cell type. The numbers of Eqtl-TSS pairs recapitulated by our interactions are indicated by red lines (Fisher’s exact test, two-tailed). (d) LDSC enrichment scores for each disease and cell type, conditioned on the baseline model from Gazal et al. 2017 and stratified by PLAC-seq anchor and target bins. Non-significant enrichment scores are shown as striped bars. (e-f) LDSC enrichment scores for each disease and cell type, conditioned on the baseline model from Gazal et al. 2017 and using either distal open chromatin peaks (e) or cell type-specific genes (f). Non-significant enrichment scores are shown as striped bars.
Extended Data Figure 9. Enriched biological processes for genes interacting with non-coding variants for each disease and cell type.
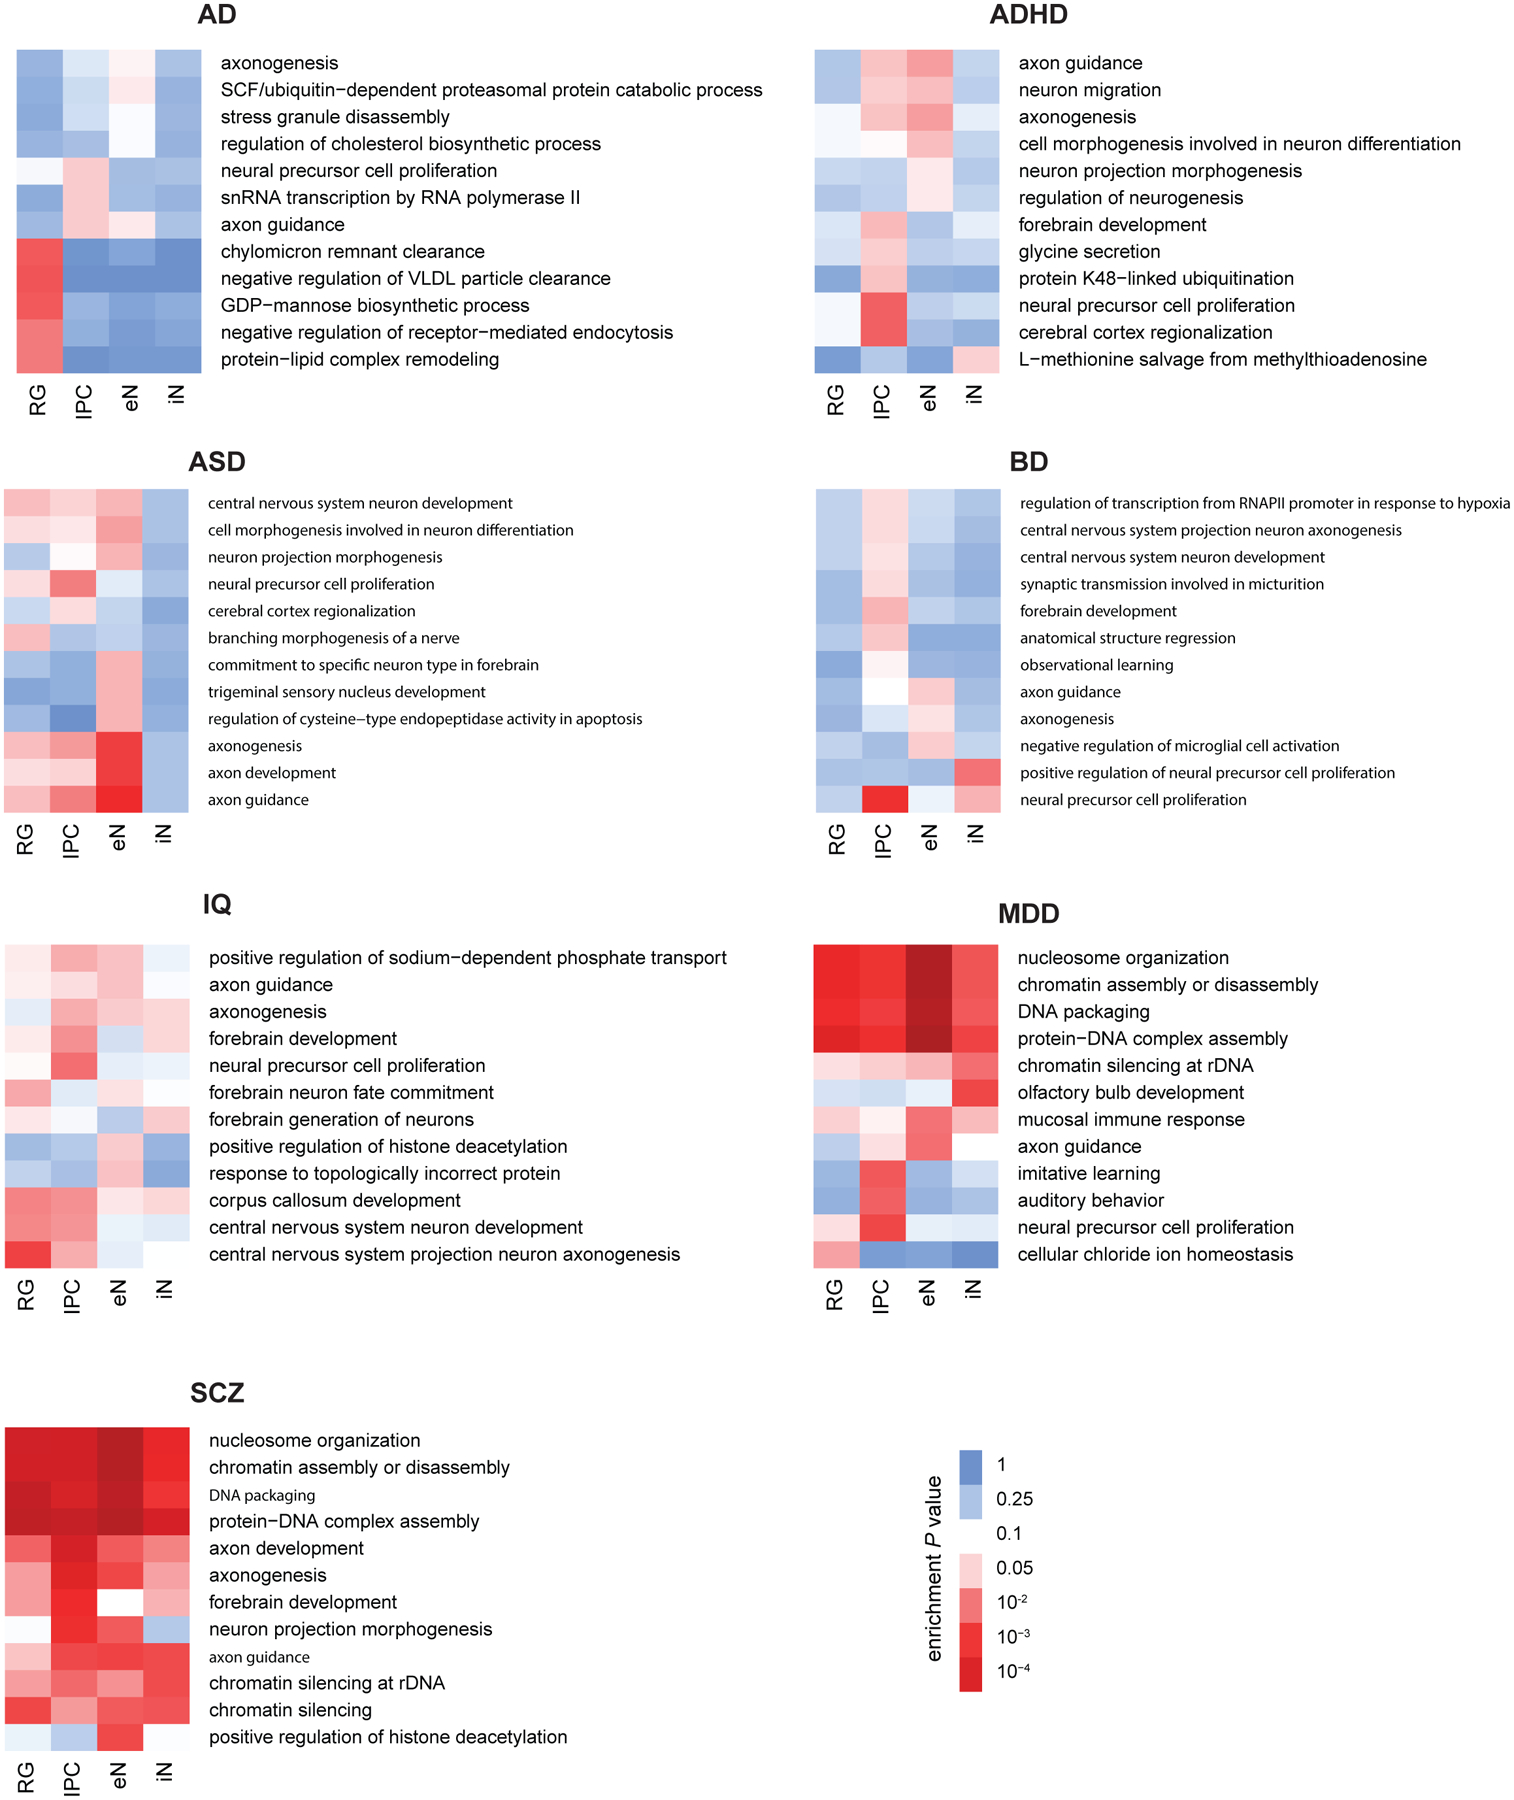
GO enrichment analysis for genes interacting with non-coding variants for each disease and cell type using H-MAGMA and gProfileR (Fisher’s exact test, two-tailed, BH method). The full results can be found in Supplementary Table 12.
Extended Data Figure 10. Characterization of RG- and eN-specific loci using CRISPRview.
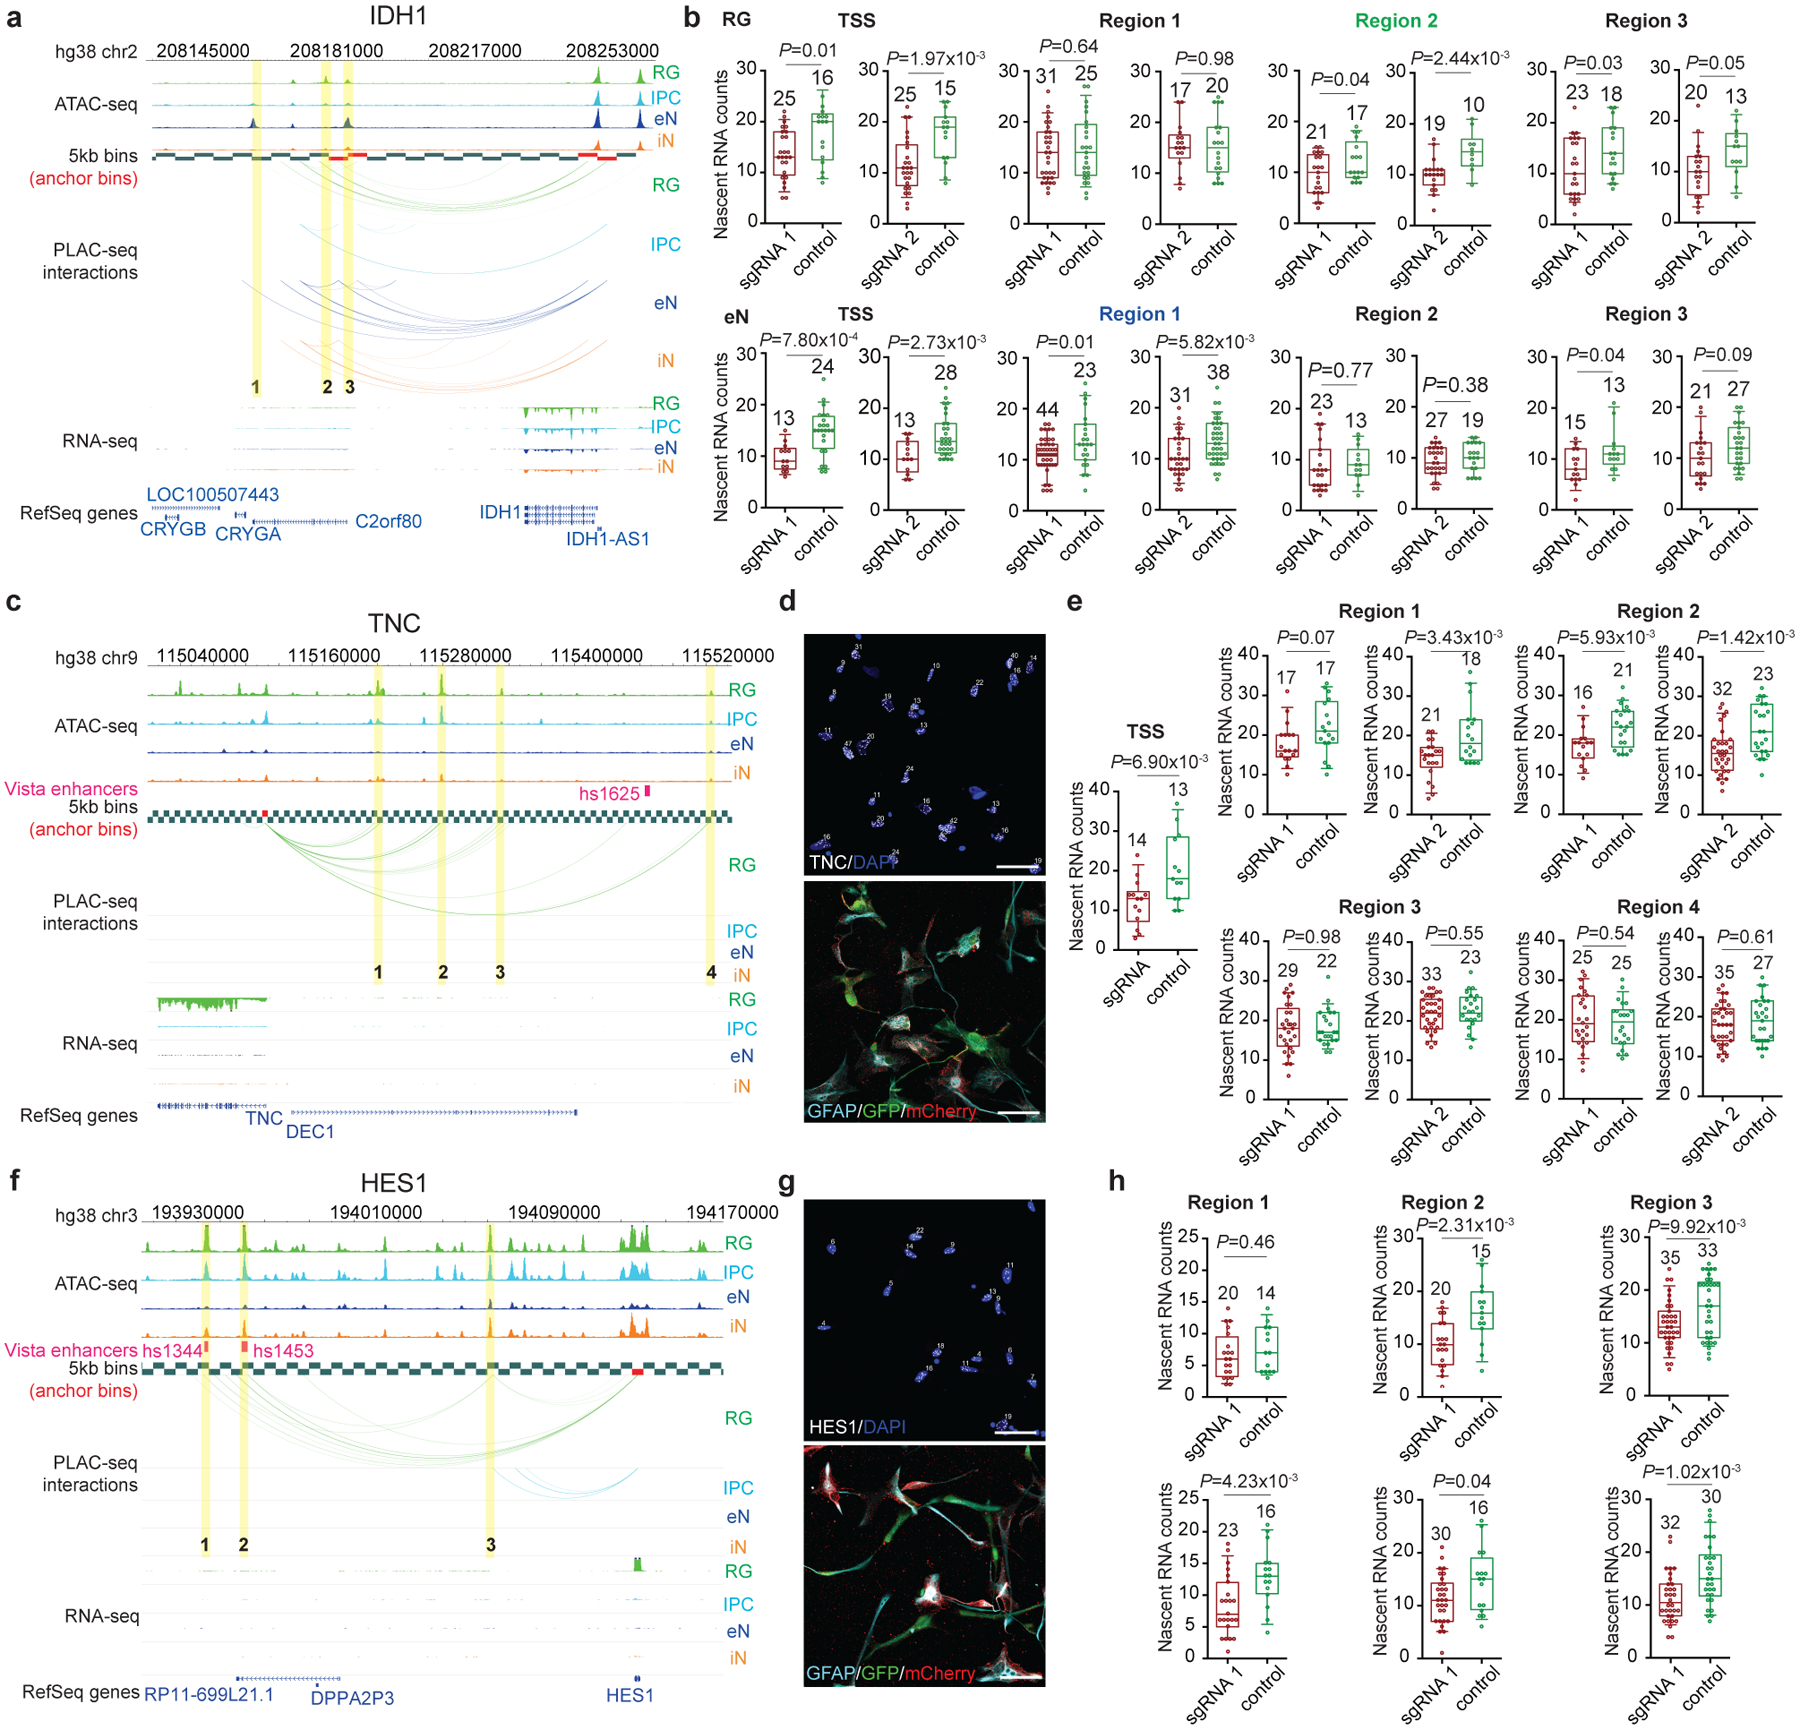
(a-b) Validation of distal interacting regions at the IDH1 locus in RG and eNs. Silencing region 1, which interacts with the IDH1 promoter only in eNs, results in the significant downregulation of IDH1 expression in eNs but not in RG. Silencing region 2, which interacts with the IDH1 promoter only in RG, results in the significant downregulation of IDH1 expression in RG but not in eNs. Silencing region 3, which interacts with the IDH1 promoter in both RG and eNs, results in the significant downregulation of IDH1 expression in both cell types. Interactions between the promoter of IDH1 and distal interacting regions containing open chromatin peaks that were targeted for silencing are highlighted. Box plots show results for experimental (red) and control (green) sgRNA-treated cells for each region (two-sample t-test, two-tailed). The median, upper and lower quartiles, and 10% to 90% range are indicated. Open circles represent single cells. Sample sizes are indicated above each box plot. (c-h) Validation of distal interacting regions at the TNC and HES1 loci in RG. Interactions between the promoters of TNC and HES1 and distal interacting regions containing open chromatin peaks that were targeted for silencing are highlighted. Representative images show staining for intronic RNAscope probes (white), DAPI (blue), GFAP (light blue), GFP (green), and mCherry (red). The scale bar is 50 μm.
Supplementary Material
Acknowledgements
This work was supported by the UCSF Weill Institute for Neuroscience Innovation Award (to Y.S. and A.R.K.), the National Institutes of Health (NIH) grants R01AG057497, R01EY027789, and UM1HG009402 (to Y.S.) and R35NS097305 (to A.R.K.), the Hillblom Foundation, and the American Federation for Aging Research New Investigator Award in Alzheimer’s Disease (to Y.S). This work was also supported by the NIH grants R01HL129132, U544HD079124, and R01MH106611 (to Y.L.), R01HG007175, U24ES026699, and U01HG009391 (to T.W.), and the American Cancer Society grant RSG-14-049-01-DMC (to T.W). M.S. is supported by T32GM007175. M.P. is supported by the National Science Foundation Graduate Research Fellowship Program grant 1650113. U.C.E. is supported by 5T32GM007618-42. This work was made possible in part by the NIH grants P30EY002162 to the UCSF Core Grant for Vision Research, P30DK063720, and S101S10OD021822-01 to the UCSF Parnassus Flow Cytometry Core.
Footnotes
Competing interests statement
The authors declare no competing financial interests.
Code availability statement
All of the software used in this study are listed in the reporting summary along with their versions.
Data availability statement
All datasets used in this study (PLAC-seq, ATAC-seq, RNA-seq) are available at the Neuroscience Multi-Omic Archive (NeMO Archive) under controlled access. Chromatin interactions, open chromatin peaks, and gene expression profiles for each cell type can be downloaded from the NeMO Archive using the following link: https://assets.nemoarchive.org/dat-uioqy8b
Cell type-specific 3D epigenomes can be visualized on the WashU Epigenome Browser using the datahub at the following link: http://epigenomegateway.wustl.edu/browser/?genome=hg38&position=chr17:72918238–73349675&hub=https://shen-msong.s3-us-west-1.amazonaws.com/hfb_submission/hfb_datahub.json
References
- 1.Nowakowski TJ et al. Spatiotemporal gene expression trajectories reveal developmental hierarchies of the human cortex. Science 358, 1318–1323, doi: 10.1126/science.aap8809 (2017). [DOI] [PMC free article] [PubMed] [Google Scholar]
- 2.Zhong S et al. A single-cell RNA-seq survey of the developmental landscape of the human prefrontal cortex. Nature 555, 524–528, doi: 10.1038/nature25980 (2018). [DOI] [PubMed] [Google Scholar]
- 3.Hansen DV, Lui JH, Parker PR & Kriegstein AR Neurogenic radial glia in the outer subventricular zone of human neocortex. Nature 464, 554–561, doi: 10.1038/nature08845 (2010). [DOI] [PubMed] [Google Scholar]
- 4.Pontious A, Kowalczyk T, Englund C & Hevner RF Role of intermediate progenitor cells in cerebral cortex development. Dev Neurosci 30, 24–32, doi: 10.1159/000109848 (2008). [DOI] [PubMed] [Google Scholar]
- 5.Anderson S, Mione M, Yun K & Rubenstein JL Differential origins of neocortical projection and local circuit neurons: role of Dlx genes in neocortical interneuronogenesis. Cereb Cortex 9, 646–654, doi: 10.1093/cercor/9.6.646 (1999). [DOI] [PubMed] [Google Scholar]
- 6.Zheng H & Xie W The role of 3D genome organization in development and cell differentiation. Nat Rev Mol Cell Biol 20, 535–550, doi: 10.1038/s41580-019-0132-4 (2019). [DOI] [PubMed] [Google Scholar]
- 7.Li Y, Hu M & Shen Y Gene regulation in the 3D genome. Hum Mol Genet 27, R228–R233, doi: 10.1093/hmg/ddy164 (2018). [DOI] [PMC free article] [PubMed] [Google Scholar]
- 8.Schoenfelder S & Fraser P Long-range enhancer-promoter contacts in gene expression control. Nat Rev Genet 20, 437–455, doi: 10.1038/s41576-019-0128-0 (2019). [DOI] [PubMed] [Google Scholar]
- 9.Won H et al. Chromosome conformation elucidates regulatory relationships in developing human brain. Nature 538, 523–527, doi: 10.1038/nature19847 (2016). [DOI] [PMC free article] [PubMed] [Google Scholar]
- 10.Thomsen ER et al. Fixed single-cell transcriptomic characterization of human radial glial diversity. Nat Methods 13, 87–93, doi: 10.1038/nmeth.3629 (2016). [DOI] [PMC free article] [PubMed] [Google Scholar]
- 11.Fang R et al. Mapping of long-range chromatin interactions by proximity ligation-assisted ChIP-seq. Cell Res 26, 1345–1348, doi: 10.1038/cr.2016.137 (2016). [DOI] [PMC free article] [PubMed] [Google Scholar]
- 12.Juric I et al. MAPS: Model-based analysis of long-range chromatin interactions from PLAC-seq and HiChIP experiments. PLoS Comput Biol 15, e1006982, doi: 10.1371/journal.pcbi.1006982 (2019). [DOI] [PMC free article] [PubMed] [Google Scholar]
- 13.Heinz S et al. Simple combinations of lineage-determining transcription factors prime cis-regulatory elements required for macrophage and B cell identities. Mol Cell 38, 576–589, doi: 10.1016/j.molcel.2010.05.004 (2010). [DOI] [PMC free article] [PubMed] [Google Scholar]
- 14.Englund C et al. Pax6, Tbr2, and Tbr1 are expressed sequentially by radial glia, intermediate progenitor cells, and postmitotic neurons in developing neocortex. J Neurosci 25, 247–251, doi: 10.1523/JNEUROSCI.2899-04.2005 (2005). [DOI] [PMC free article] [PubMed] [Google Scholar]
- 15.Lim L, Mi D, Llorca A & Marin O Development and Functional Diversification of Cortical Interneurons. Neuron 100, 294–313, doi: 10.1016/j.neuron.2018.10.009 (2018). [DOI] [PMC free article] [PubMed] [Google Scholar]
- 16.Liu SJ et al. Single-cell analysis of long non-coding RNAs in the developing human neocortex. Genome Biol 17, 67, doi: 10.1186/s13059-016-0932-1 (2016). [DOI] [PMC free article] [PubMed] [Google Scholar]
- 17.Luo C et al. Cerebral Organoids Recapitulate Epigenomic Signatures of the Human Fetal Brain. Cell Rep 17, 3369–3384, doi: 10.1016/j.celrep.2016.12.001 (2016). [DOI] [PMC free article] [PubMed] [Google Scholar]
- 18.Javierre BM et al. Lineage-Specific Genome Architecture Links Enhancers and Non-coding Disease Variants to Target Gene Promoters. Cell 167, 1369–1384 e1319, doi: 10.1016/j.cell.2016.09.037 (2016). [DOI] [PMC free article] [PubMed] [Google Scholar]
- 19.Choudhary MN et al. Co-opted transposons help perpetuate conserved higher-order chromosomal structures. Genome Biol 21, 16, doi: 10.1186/s13059-019-1916-8 (2020). [DOI] [PMC free article] [PubMed] [Google Scholar]
- 20.Feschotte C Transposable elements and the evolution of regulatory networks. Nat Rev Genet 9, 397–405, doi: 10.1038/nrg2337 (2008). [DOI] [PMC free article] [PubMed] [Google Scholar]
- 21.Zhang Y et al. Transcriptionally active HERV-H retrotransposons demarcate topologically associating domains in human pluripotent stem cells. Nat Genet, doi: 10.1038/s41588-019-0479-7 (2019). [DOI] [PMC free article] [PubMed] [Google Scholar]
- 22.Bailey SD et al. ZNF143 provides sequence specificity to secure chromatin interactions at gene promoters. Nat Commun 2, 6186, doi: 10.1038/ncomms7186 (2015). [DOI] [PMC free article] [PubMed] [Google Scholar]
- 23.Ngondo-Mbongo RP, Myslinski E, Aster JC & Carbon P Modulation of gene expression via overlapping binding sites exerted by ZNF143, Notch1 and THAP11. Nucleic Acids Res 41, 4000–4014, doi: 10.1093/nar/gkt088 (2013). [DOI] [PMC free article] [PubMed] [Google Scholar]
- 24.Sundaram V & Wang T Transposable Element Mediated Innovation in Gene Regulatory Landscapes of Cells: Re-Visiting the “Gene-Battery” Model. Bioessays 40, doi: 10.1002/bies.201700155 (2018). [DOI] [PMC free article] [PubMed] [Google Scholar]
- 25.Davis CA et al. The Encyclopedia of DNA elements (ENCODE): data portal update. Nucleic Acids Res 46, D794–D801, doi: 10.1093/nar/gkx1081 (2018). [DOI] [PMC free article] [PubMed] [Google Scholar]
- 26.Miller DJ, Bhaduri A, Sestan N & Kriegstein A Shared and derived features of cellular diversity in the human cerebral cortex. Curr Opin Neurobiol 56, 117–124, doi: 10.1016/j.conb.2018.12.005 (2019). [DOI] [PMC free article] [PubMed] [Google Scholar]
- 27.Suzuki IK et al. Human-Specific NOTCH2NL Genes Expand Cortical Neurogenesis through Delta/Notch Regulation. Cell 173, 1370–1384 e1316, doi: 10.1016/j.cell.2018.03.067 (2018). [DOI] [PMC free article] [PubMed] [Google Scholar]
- 28.Rani N et al. A Primate lncRNA Mediates Notch Signaling during Neuronal Development by Sequestering miRNA. Neuron 90, 1174–1188, doi: 10.1016/j.neuron.2016.05.005 (2016). [DOI] [PMC free article] [PubMed] [Google Scholar]
- 29.Carbon S et al. AmiGO: online access to ontology and annotation data. Bioinformatics 25, 288–289, doi: 10.1093/bioinformatics/btn615 (2009). [DOI] [PMC free article] [PubMed] [Google Scholar]
- 30.Reilly SK et al. Evolutionary genomics. Evolutionary changes in promoter and enhancer activity during human corticogenesis. Science 347, 1155–1159, doi: 10.1126/science.1260943 (2015). [DOI] [PMC free article] [PubMed] [Google Scholar]
- 31.Visel A, Minovitsky S, Dubchak I & Pennacchio LA VISTA Enhancer Browser--a database of tissue-specific human enhancers. Nucleic Acids Res 35, D88–92, doi: 10.1093/nar/gkl822 (2007). [DOI] [PMC free article] [PubMed] [Google Scholar]
- 32.Walker RL et al. Genetic Control of Expression and Splicing in Developing Human Brain Informs Disease Mechanisms. Cell 179, 750–771 e722, doi: 10.1016/j.cell.2019.09.021 (2019). [DOI] [PMC free article] [PubMed] [Google Scholar]
- 33.Hoffman GE et al. CommonMind Consortium provides transcriptomic and epigenomic data for Schizophrenia and Bipolar Disorder. Sci Data 6, 180, doi: 10.1038/s41597-019-0183-6 (2019). [DOI] [PMC free article] [PubMed] [Google Scholar]
- 34.Bulik-Sullivan BK et al. LD Score regression distinguishes confounding from polygenicity in genome-wide association studies. Nat Genet 47, 291–295, doi: 10.1038/ng.3211 (2015). [DOI] [PMC free article] [PubMed] [Google Scholar]
- 35.Finucane HK et al. Partitioning heritability by functional annotation using genome-wide association summary statistics. Nat Genet 47, 1228–1235, doi: 10.1038/ng.3404 (2015). [DOI] [PMC free article] [PubMed] [Google Scholar]
- 36.Demontis D et al. Discovery of the first genome-wide significant risk loci for attention deficit/hyperactivity disorder. Nat Genet 51, 63–75, doi: 10.1038/s41588-018-0269-7 (2019). [DOI] [PMC free article] [PubMed] [Google Scholar]
- 37.Grove J et al. Identification of common genetic risk variants for autism spectrum disorder. Nat Genet 51, 431–444, doi: 10.1038/s41588-019-0344-8 (2019). [DOI] [PMC free article] [PubMed] [Google Scholar]
- 38.Stahl EA et al. Genome-wide association study identifies 30 loci associated with bipolar disorder. Nat Genet 51, 793–803, doi: 10.1038/s41588-019-0397-8 (2019). [DOI] [PMC free article] [PubMed] [Google Scholar]
- 39.Savage JE et al. Genome-wide association meta-analysis in 269,867 individuals identifies new genetic and functional links to intelligence. Nat Genet 50, 912–919, doi: 10.1038/s41588-018-0152-6 (2018). [DOI] [PMC free article] [PubMed] [Google Scholar]
- 40.Howard DM et al. Genome-wide meta-analysis of depression identifies 102 independent variants and highlights the importance of the prefrontal brain regions. Nat Neurosci 22, 343–352, doi: 10.1038/s41593-018-0326-7 (2019). [DOI] [PMC free article] [PubMed] [Google Scholar]
- 41.Pardinas AF et al. Common schizophrenia alleles are enriched in mutation-intolerant genes and in regions under strong background selection. Nat Genet 50, 381–389, doi: 10.1038/s41588-018-0059-2 (2018). [DOI] [PMC free article] [PubMed] [Google Scholar]
- 42.Gazal S et al. Linkage disequilibrium-dependent architecture of human complex traits shows action of negative selection. Nat Genet 49, 1421–1427, doi: 10.1038/ng.3954 (2017). [DOI] [PMC free article] [PubMed] [Google Scholar]
- 43.Sey NYA et al. A computational tool (H-MAGMA) for improved prediction of brain-disorder risk genes by incorporating brain chromatin interaction profiles. Nat Neurosci, doi: 10.1038/s41593-020-0603-0 (2020). [DOI] [PMC free article] [PubMed] [Google Scholar]
- 44.Andersen OM & Willnow TE Lipoprotein receptors in Alzheimer’s disease. Trends Neurosci 29, 687–694, doi: 10.1016/j.tins.2006.09.002 (2006). [DOI] [PubMed] [Google Scholar]
- 45.Akbarian S Epigenetic mechanisms in schizophrenia. Dialogues Clin Neurosci 16, 405–417 (2014). [DOI] [PMC free article] [PubMed] [Google Scholar]
- 46.Yang X et al. SMART-Q: An Integrative Pipeline Quantifying Cell Type-Specific RNA Transcription. PLoS One 15, e0228760, doi: 10.1371/journal.pone.0228760 (2020). [DOI] [PMC free article] [PubMed] [Google Scholar]
- 47.Lieberman-Aiden E et al. Comprehensive mapping of long-range interactions reveals folding principles of the human genome. Science 326, 289–293, doi: 10.1126/science.1181369 (2009). [DOI] [PMC free article] [PubMed] [Google Scholar]
- 48.Dixon JR et al. Topological domains in mammalian genomes identified by analysis of chromatin interactions. Nature 485, 376–380, doi: 10.1038/nature11082 (2012). [DOI] [PMC free article] [PubMed] [Google Scholar]
- 49.Schmitt AD et al. A Compendium of Chromatin Contact Maps Reveals Spatially Active Regions in the Human Genome. Cell Rep 17, 2042–2059, doi: 10.1016/j.celrep.2016.10.061 (2016). [DOI] [PMC free article] [PubMed] [Google Scholar]
- 50.Sobhy H, Kumar R, Lewerentz J, Lizana L & Stenberg P Highly interacting regions of the human genome are enriched with enhancers and bound by DNA repair proteins. Sci Rep 9, 4577, doi: 10.1038/s41598-019-40770-9 (2019). [DOI] [PMC free article] [PubMed] [Google Scholar]
- 51.Reimand J, Kull M, Peterson H, Hansen J & Vilo J g:Profiler--a web-based toolset for functional profiling of gene lists from large-scale experiments. Nucleic Acids Res 35, W193–200, doi: 10.1093/nar/gkm226 (2007). [DOI] [PMC free article] [PubMed] [Google Scholar]
- 52.Hnisz D et al. Super-enhancers in the control of cell identity and disease. Cell 155, 934–947, doi: 10.1016/j.cell.2013.09.053 (2013). [DOI] [PMC free article] [PubMed] [Google Scholar]
- 53.Grant CE, Bailey TL & Noble WS FIMO: scanning for occurrences of a given motif. Bioinformatics 27, 1017–1018, doi: 10.1093/bioinformatics/btr064 (2011). [DOI] [PMC free article] [PubMed] [Google Scholar]
- 54.Diao Y et al. A tiling-deletion-based genetic screen for cis-regulatory element identification in mammalian cells. Nat Methods 14, 629–635, doi: 10.1038/nmeth.4264 (2017). [DOI] [PMC free article] [PubMed] [Google Scholar]
- 55.Xie S, Duan J, Li B, Zhou P & Hon GC Multiplexed Engineering and Analysis of Combinatorial Enhancer Activity in Single Cells. Mol Cell 66, 285–299 e285, doi: 10.1016/j.molcel.2017.03.007 (2017). [DOI] [PubMed] [Google Scholar]
- 56.Datlinger P et al. Pooled CRISPR screening with single-cell transcriptome readout. Nat Methods 14, 297–301, doi: 10.1038/nmeth.4177 (2017). [DOI] [PMC free article] [PubMed] [Google Scholar]
- 57.Labun K et al. CHOPCHOP v3: expanding the CRISPR web toolbox beyond genome editing. Nucleic Acids Res 47, W171–W174, doi: 10.1093/nar/gkz365 (2019). [DOI] [PMC free article] [PubMed] [Google Scholar]
Associated Data
This section collects any data citations, data availability statements, or supplementary materials included in this article.


