

Abstract
Cardiovascular disease is the leading cause of death in the United States. While abundant research has been conducted to identify risk factors for cardiovascular disease at the individual level, less is known about factors that may influence population cardiovascular health outcomes at the neighborhood level. The purpose of this study is to use Bayesian Additive Regression Trees, a state-of-the-art machine learning approach, to rank sociodemographic, health behavior, prevention, and environmental factors in predicting neighborhood cardiovascular health. We created a new neighborhood health dataset by combining three datasets at the census tract level, including the 500 Cities Data from the Centers for Disease Control and Prevention, the 2011-2015 American Community Survey 5-Year Estimates from the Census Bureau, and the 2015-2016 Environmental Justice Screening database from the Environmental Protection Agency in the United States. Results showed that neighborhood behavioral factors such as the proportions of people who are obese, do not have leisure-time physical activity, and have binge drinking emerged as top five predictors for most of the neighborhood cardiovascular health outcomes. Findings from this study would allow public health researchers and policymakers to prioritize community-based interventions and efficiently use limited resources to improve neighborhood cardiovascular health.
Keywords: Health Behaviors, Prevention, Cardiovascular Health, Neighborhood, Machine Learning
INTRODUCTION
Cardiovascular disease (CVD) is the leading cause of death in the United States (US) and globally. Despite billions of dollars have been invested in new medication and advanced technology to prevent and control CVD at the individual level, there is no clear sign of a decrease in the prevalence of CVD in the US.1 Over the past few decades, public health researchers, practitioners, and policymakers have increasingly adopted a neighborhood perspective in the prevention and management of CVD. Neighborhood community-based interventions have been shown to be more effective and cost-effective in reducing the burden of CVD and curbing health care costs compared to individual-based interventions.2 Neighborhood cardiovascular health becomes an important measure of success for community-based interventions and, thus, is being increasingly used in evidence-based decision-making.
Despite the importance of neighborhood cardiovascular health, there is an insufficient understanding of its key contributors and predictors. Previous studies have shown that neighborhood sociodemographic and physical and social environment may play an important role in shaping neighborhood cardiovascular health and explaining disparities in disease outcomes across different neighborhoods.3 Some recent studies have applied machine learning approaches to predict cardiovascular health outcomes at the individual level.4-6 However, no studies have examined and ranked the effects of different factors across multiple levels in predicting neighborhood cardiovascular health. The current study fills this research gap by using a state-of-the-art machine learning approach to rank cardiovascular health related factors in four domains—sociodemographic factors, health behaviors, prevention measures, and environmental factors—using a data set consisted of 26,697census tracts from 500 major cities in the US. The ranking of these factors may help public health practitioners and policymakers prioritize community-based interventions and efficiently use limited resources to improve neighborhood cardiovascular health.
METHODS
We created a new neighborhood health dataset by combining three datasets at the census tract level—the 500 Cities Data from the Centers for Disease Control and Prevention (CDC),7 the 2011-2015 American Community Survey 5-Year Estimates from the US Census Bureau, and the 2015-2016 Environmental Justice Screening (EJSCREEN) database from the Environmental Protection Agency (EPA).8 Census tract was used as a proxy of neighborhood. We focused on five prevalent cardiovascular health outcomes: hypertension, high cholesterol, diabetes, coronary heart disease (CHD), and stroke. The potential predictors considered include five unhealthy behaviors (i.e., binge drinking, smoking, no leisure-time physical activity, insufficient sleep, and obesity), four prevention measures (i.e., lack of health insurance, routine checkup, cholesterol screening), sociodemographic indicators (i.e., age, sex, race/ethnicity, income, and education), and environmental measures (i.e., ozone level in air, PM2.5 level in air, traffic proximity and volume, and house built prior to 1960). Both cardiovascular health outcomes and potential predictors were measured at the neighborhood level (no person-level data were used). More detailed descriptions of the selected variables and their data sources were shown in Table S1 in the supplemental document. There are 28,004 census tracts in the combined dataset. We excluded 875 census tracts due to missing data on health measures, 137 census tracts due to missing data on socio-demographic measures, and additional 295 census tracts due to missing data on environmental measures. Our final analytical dataset included 26,697 census tracts.
We used a high-performance machine learning technique—Bayesian Additive Regression Trees (BART)—to identify and rank important predictors of neighborhood cardiovascular health outcomes.9 BART is a Bayesian “sum-of-trees” model where each tree is constrained by a regularization prior to ensure the iterative Bayesian back-fitting Markov chain Monte Carlo (MCMC) algorithm—that generates samples from a posterior—remarkably stable and to avoid overfitting. BART has a proven track record of better predictive performance against a multitude of competing machine learning methods, including random forests, boosted models and neural nets, in a variety of settings.9-12 For this study, we compared the predictive accuracy between BART and random forests for each of the five cardiovascular health outcomes and showed that BART consistently has a better predictive accuracy (Table S2 in the supplemental document). The full posterior samples generated from the BART fit allow for both point and interval estimates of variable importance. In addition, we can evaluate the marginal effects of predictors using the posterior samples.
In each of the models, we used default values for the number of burn-in steps and MCMC iterations (i.e., 200 burn-in steps and 1,000 MCMC iterations). These numbers are set to be large to ensure the convergence of the MCMC chains. For each outcome, the BART model used 1200 posterior draws with the first 200 discarded as burn-in and additional 1000 draws to ensure a stationary process. We measured and ranked all the predicting variables by the proportion of times each predictor is chosen as a splitting rule divided by the total number of splitting rules presenting in the model, with a higher value representing higher importance. The 95% confidence interval for each measure was computed from the MCMC iterations. To understand how a predictor affects the outcome on average after controlling for other predictors, we used the partial dependence function to assess the marginal relationship between the top three predictors and their respective outcomes. We present the results in Figure S1. Analyses were performed in R 3.5.3 using the bartMachine package.13
RESULTS
Our analysis showed that sociodemographic factors, health behaviors, prevention, and environmental factors explained most of the variance for neighborhood cardiovascular health: 95.7% for hypertension, 88.2% for high cholesterol, 97.9% for diabetes, 94.7% for CHD, and 97.2% for stroke. Figure 1 shows the ranking of different factors predicting the five cardiovascular health outcomes at the neighborhood level. For hypertension, the topic five ranked predictors are the proportions of people who have binge drinking, are obese, have cholesterol screening, do not have leisure-time physical activity, and are aged 65 years or over. For high cholesterol, the top five predictors were the proportions of people who have cholesterol screening, have binge drinking, are aged 65 years or over, do not have leisure-time physical activity, and are obese. For diabetes, the top five predictors were the proportions of people who have cholesterol screening, are obesity, do not have leisure-time physical activity, have binge drinking, and aged 65 years or over. For CHD, the top five predictors were the proportions of people who have cholesterol screening, do not have leisure-time physical activity, have binge drinking, are aged 65 years or over, and have low income. For stroke, the top five important predictors were the proportions of people who have cholesterol screening, have binge drinking, have no leisure-time physical activity, are aged 65 years or over, and have dental checkup. We also explored marginal relationships between the top predictors and their respective neighborhood cardiovascular health outcomes (Figure S1 in the supplemental document).
Figure 1. Variable importance measured by inclusion proportion in the BART models for each of the five cardiovascular health outcomes—the proportion of population who have hypertension, high cholesterol, diabetes, CHD, and stroke.
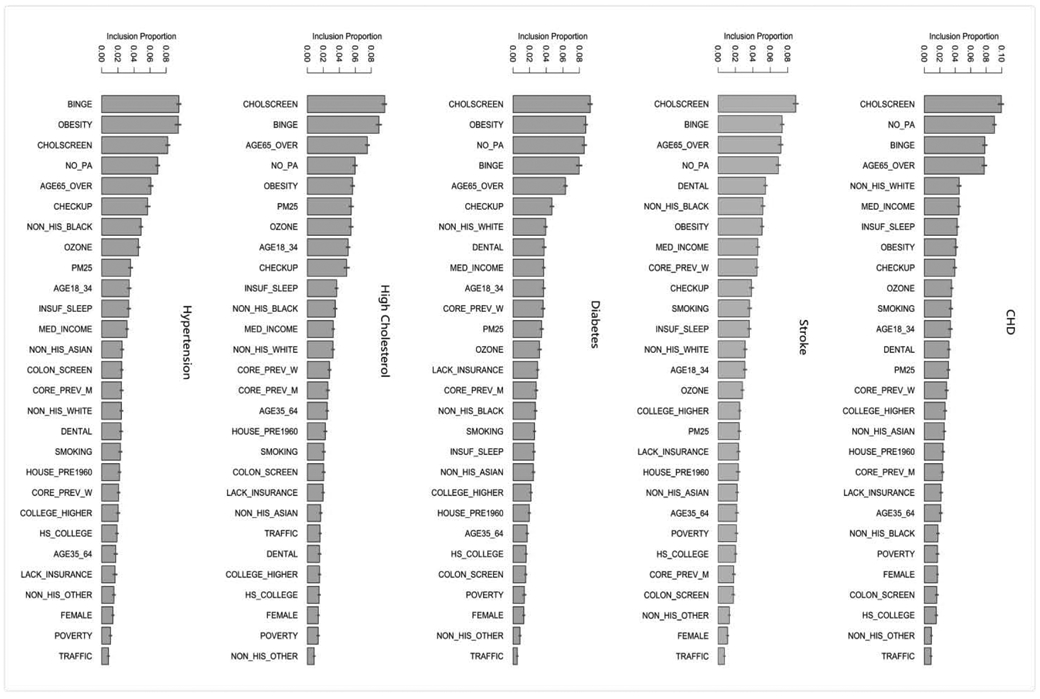
Note: The segments atop the bars represent 95% confidence intervals.
Variable definition: BPHIGH= High blood pressure among adults; HIGHCHOL= High cholesterol among adults who have been screened in the past 5 years; CHD= Coronary heart disease among adults; DIABETES= Diagnosed diabetes among adults; STROKE= Stroke among adults; BINGE= Binge drinking among adults; SMOKING= Current smoking among adults; NO_PA= No leisure-time physical activity among adults; OBESITY= Obesity among adults; INSUF_SLEEP= Sleeping less than 7 hours among adults; LACK_INSURANCE= Current lack of health insurance among adults; CHECKUP= Visits to doctor for routine checkup within the past year among adults; DENTAL= Visits to dentist or dental clinic among adults; COLSCREEN= Cholesterol screening among adults; POVERTY= Percent below poverty level; MED_INCOME= Median household income in the past 12 months; HOUSE_PRE1960= Percent pre-1960 housing (lead paint indicator); TRAFFIC= Traffic proximity and volume; OZONE= Ozone level in air; and PM25= PM2.5 level in air.
Overall, neighborhood behavioral factors such as the proportions of people who are obese, do not have leisure-time physical activity, and have binge drinking emerged as top five predictors for most of the neighborhood cardiovascular health outcomes. Among sociodemographic factors, the proportion of people who are aged 65 years or over appeared to be a more important predictor of neighborhood cardiovascular health than the other factors. Among prevention measures, the proportions of people who have cholesterol screening was the most important predictor. None of the environmental factors appeared to be top predictors of neighborhood cardiovascular health outcomes.
DISCUSSION
This study uses a state-of-the-art machine learning approach to identify and rank factors across multiple levels in predicting neighborhood cardiovascular health based on a combined dataset consisting of more than 20,000 census tracts in the 500 cities of US. Although important predictors varied by the specific cardiovascular health outcome (e.g., hypertension, CHD, stroke), some of them emerged as common predictors, including the proportion of people who have cholesterol screening, are obesity, do not have leisure-time physical activity, have binge drinking, and aged 65 years or over.
Identifying important predictors of neighborhood cardiovascular health would allow public health researchers and policymakers to have a deeper understanding of the drivers of neighborhood population health. Some of the common predictors—such as binge drinking, obesity, and lack of leisure-time physical activity—can provide important avenues for potential interventions. The clustering of common predictors also implies that improving one factor may improve multiple cardiovascular health outcomes at the neighborhood level. The findings from this study are in general consistent with our previous pilot study in which we used a simple random forest approach to identify important predictors for CHD and stroke.14 This study significantly expanded the pilot study by applying a more robust machine learning approach to identify important predictors across four domains (i.e., sociodemographic, health behaviors, prevention, and environment) for five neighborhood cardiovascular health outcomes. Thus, findings from this study are more accurate and comprehensive compared to the previous study.14
Compared to frequentist methods, Bayesian methods have several advantages, including 1) they yield coherent uncertainty intervals; 2) the posterior samples provide the entire distribution of the target parameter estimate, which can be further used to estimate a variety of functionals of the target parameter without fitting another model; and 3) they are data-adaptive, which means the updating process of the Bayesian approaches allows borrowing and integrating information from prior experiments to best inform the underlying true processes. Due to these reasons, Bayesian methods become more and more popular in healthcare research. For example, Bayesian methods have been used to precisely evaluate the comparative effectiveness of various treatment plans for a given disease.15 In addition, Bayesian adaptive design has been used in clinical trials.16 The disadvantages of Bayesian methods are mainly about intensive computational requirement and strong priors. These advantages can be addressed by using more efficient algorithm and programming language to speed up the computational speed and using weakly or non-informative priors to minimize the impact of prior distributions.
There are several limitations in this study. First, some behavioral and health outcome measures available in the 500 Cities Data were estimated by the CDC using a small area estimation approach. Although these estimated measures may not be accurate as real statistics, they provide the best available data for these small areas and the approach has been well validated.17 Second, we did not identify the causal relationship between predictors and health outcomes due to the nature of the cross-sectional data and ecological design. However, our results identified important factors of neighborhood cardiovascular health and can potentially stimulate future research on causal relationships. Finally, there could be other important variables we should have included in the analysis due to the complexity of the neighborhood cardiovascular health. Despite the potential unmeasured variables, by combining data from three different large datasets and using an innovative machine learning approach, we believe the scope and depth of our analysis can provide important insights on policymaking and lead to more innovative investigations in the area of neighborhood population health.
Supplementary Material
Acknowledgments
Funding: This study is supported, in part, by a grant from the National Heart, Lung, And Blood Institute of the NIH under Award Number R01HL141427. The contents of this publication are solely the responsibility of the authors and do not necessarily represent the official views of the NIH.
Footnotes
Publisher's Disclaimer: This is a PDF file of an unedited manuscript that has been accepted for publication. As a service to our customers we are providing this early version of the manuscript. The manuscript will undergo copyediting, typesetting, and review of the resulting proof before it is published in its final form. Please note that during the production process errors may be discovered which could affect the content, and all legal disclaimers that apply to the journal pertain.
Disclosures: The authors have no relationships with industry.
REFERENCES
- 1.Mozaffarian D, Benjamin EJ, Go AS, et al. Heart disease and stroke statistics-2016 update a report from the American Heart Association. Circulation. 2016;133(4):e38–e48. [DOI] [PubMed] [Google Scholar]
- 2.Mensah GA, Cooper RS, Siega-Riz AM, et al. Reducing cardiovascular disparities through community-engaged implementation research: A National Heart, Lung, and Blood Institute workshop report. Circ Res. 2018;122(2):213–230. [DOI] [PMC free article] [PubMed] [Google Scholar]
- 3.Diez Roux AV, Merkin SS, Arnett D, et al. Neighborhood of residence and incidence of coronary heart disease. N Engl J Med. 2001;345(2):99–106. [DOI] [PubMed] [Google Scholar]
- 4.Mezzatesta S, Torino C, De Meo P, Fiumara G, Vilasi A. A machine learning-based approach for predicting the outbreak of cardiovascular diseases in patients on dialysis. Comput Methods Programs Biomed. 2019;177:9–15. [DOI] [PubMed] [Google Scholar]
- 5.Bernardini M, Morettini M, Romeo L, Frontoni E, Burattini L. TyG-er: An ensemble Regression Forest approach for identification of clinical factors related to insulin resistance condition using Electronic Health Records. Comput Biol Med. 2019; 112:103358. [DOI] [PubMed] [Google Scholar]
- 6.Kumar NK, Sindhu GS, Prashanthi DK, Sulthana AS. Analysis and Prediction of Cardio Vascular Disease using Machine Learning Classifiers. In: 2020 6th International Conference on Advanced Computing and Communication Systems (ICACCS) IEEE; 2020:15–21. [Google Scholar]
- 7.Centers for Disease Control and Prevention. 500 Cities: Local Data for Better Health.; 2017. https://www.cdc.gov/500cities/index.htm
- 8.EPA. Environmental Justice Mapping and Screening Tool. United States Environmental Protection Agency; 2016. Accessed July 25, 2017 https://www.epa.gov/ejscreen [Google Scholar]
- 9.Chipman HA, George EI, McCulloch RE. BART: Bayesian additive regression trees. Ann Appl Stat. 2010;4(1):266–298. [Google Scholar]
- 10.Murphy KP. Machine Learning: A Probabilistic Perspective. MIT press; 2012. [Google Scholar]
- 11.Hill JL. Bayesian nonparametric modeling for causal inference. J Comput Graph Stat. 2011;20(1):217–240. [Google Scholar]
- 12.Bleich J, Kapelner A, George EI, Jensen ST. Variable selection for BART: an application to gene regulation. Ann Appl Stat. Published online 2014:1750–1781. [Google Scholar]
- 13.Kapelner A, Bleich J. bartMachine: Machine learning with Bayesian additive regression trees. Stat Softw. 2016;70(4):1–40. [Google Scholar]
- 14.Li Y, Liu SH, Niu L, Liu B. Unhealthy Behaviors, Prevention Measures, and Neighborhood Cardiovascular Health: A Machine Learning Approach. J Public Health Manag Pract. 2019;25(1):E25–E28. [DOI] [PubMed] [Google Scholar]
- 15.Hu L, Gu C, Lopez M, Ji J, Wisnivesky J. Estimation of causal effects of multiple treatments in observational studies with a binary outcome. Stat Methods Med Res. Published online 2020:0962280220921909. [DOI] [PMC free article] [PubMed] [Google Scholar]
- 16.Pallmann P, Bedding AW, Choodari-Oskooei B, et al. Adaptive designs in clinical trials: why use them, and how to run and report them. BMC Med. 2018;16(1):1–15. [DOI] [PMC free article] [PubMed] [Google Scholar]
- 17.Zhang X, Holt JB, Yun S, Lu H, Greenlund KJ, Croft JB. Validation of multilevel regression and poststratification methodology for small area estimation of health indicators from the behavioral risk factor surveillance system. Am J Epidemiol. 2015; 182(2): 127–137. [DOI] [PMC free article] [PubMed] [Google Scholar]
Associated Data
This section collects any data citations, data availability statements, or supplementary materials included in this article.