

Abstract
Background/Aims.
Best-corrected visual acuity (BCVA) is the most common primary endpoint in treatment trials for Choroideremia (CHM) but the long-term natural history of BCVA is unclear.
Methods.
We searched in 7 databases to identify studies that reported BCVA of untreated eyes with CHM. We sought individual-level data and performed segmented regression between BCVA and age. For eyes followed longitudinally, we introduced a horizontal translation factor to each dataset to account for different ages at onset of a rapid BCVA decline.
Results.
We included 1004 eyes from 23 studies. BCVA of the right and left eyes was moderately correlated (r=0.60). BCVA as a function of age followed a 2-phase decline (slow followed by rapid decline), with an estimated transition age of 39.1 years (95% CI 33.5 to 44.7). After the introduction of horizontal translation factors to longitudinal datasets, BCVA followed a 2-phase decline until it reached 0 letters (r2=0.90). The BCVA decline rate was 0.33 letters/year (95% CI −0.38 to 1.05) before 39 years, and 1.23 letters/year (95% CI 0.55 to 1.92) after 39 years (P=0.004).
Conclusion.
BCVA in eyes with CHM follows a 2-phase linear decline with a transition age of approximately 39 years. Future trials enrolling young patients may not be able to use BCVA as a primary or sole endpoint, but rather, may need to employ additional disease biomarkers that change before age 39. BCVA may still have utility as a primary endpoint for patients older than 39 years who have measurable BCVA decline rates.
Choroideremia (CHM) is a progressive X-linked recessive disease due to mutations in the CHM gene.1 The prevalence of CHM is approximately 1 in 50000 individuals.2 Currently, there are no approved treatment options for CHM. However, phase I/II human clinical trials of gene therapy showed promising results,2–7 with several other trials currently underway (clinicaltrials.gov). Since best-corrected visual acuity (BCVA) is the primary endpoint in the treatment trials,2–7 it is essential to establish the natural history of BCVA and examine the reliability of BCVA as an endpoint in trials for CHM.
Several recent studies propose that the decline of BCVA in eyes with CHM follows a 2-phase linear model, in which BCVA declines very slowly in the first decades of life (i.e., slow decline phase) and then drops rapidly after a transition age (i.e., rapid decline phase).8–14 However, significant controversy exists regarding the transition age and rate of BCVA decline. The mean transition ages proposed by previous studies vary widely from 30 to 60 years.8–14 Also, the mean BCVA decline rates in previous studies vary significantly from 0.001 to 0.02 logMAR/year in young patients and from 0.025 to 0.06 logMAR/year in elder patients.9–11, 13, 14 The large discrepancy between different studies may result from the limited number of eyes in most previous studies (<100 eyes),3–5, 8–13, 15–30 and a subjective method of choosing the transition age in some studies.8, 10, 12, 13 The inconsistency in clinical data presents challenges for treatment trials to identify patients with a measurable BCVA decline rate over a few years and to interpret study results.
To address the controversies in the clinical data, we performed a systematic review and meta-analysis of individual-level data from 1004 eyes to investigate the long-term natural history of BCVA in CHM.
Methods
We conducted the present meta-analysis in accordance with the Preferred Reporting Items for a Systematic Review and Meta-analysis of Individual Participant Data statement (PRISMA-IPD).31
Literature Search and Selection
An experienced medical librarian (H.K.G.N.) advised on methodology and conducted a literature search in 7 databases up through 17 July 2019: MEDLINE, EMBASE, Web of Science Core Collection, NLM PubMed, BIOSIS Citations, Scopus, and Clinicaltrials.gov. The detailed search strategy is in online supplementary method.
We included studies that met the following criteria: (1) recruited a group of patients (≥5) diagnosed with CHM without any previous or active treatment; (2) measured BCVA of 1 or both eyes on at least 1 occasion; (3) reported data of individual patients’ ages and BCVA. We did not restrict the method of CHM diagnosis or BCVA measurement. If either eye of a patient received treatment, we only included data prior to any treatment initiation. We selected articles with the largest and most recent dataset when there were multiple publications from the same or overlapping study population.
Data Collection and Study Quality Assessment
Two reviewers (L.L.S. and M.S.) separately screened all articles from the literature search to identify eligible studies and resolved differences through discussion. For each included study, 2 reviewers (L.L.S. and A.A.) independently extracted data regarding study designs, demographic characteristics, and BCVA of individual eyes (online supplementary table 1 detailed the data extraction method). If the data were unavailable in the original manuscripts, we contacted the primary authors to request the data. We converted all BCVA measurements into Early Treatment Diabetic Retinopathy Study (ETDRS) letter score,32 which was commonly used in previous CHM trials.2–6 We used 2 letters to represent BCVA of counting fingers and 0 letters to represent BCVA worse than counting fingers or 2 letters.32, 33
Two reviewers (M.S. and A.A.) assessed the quality of studies and risk of bias using the Quality In Prognosis Studies (QUIPS) tool.34 We removed the “prognostic factor measurement” item from the QUIPS tool since we did not aim to assess any prognostic factors. A third reviewer (L.L.S) resolved the disagreements between the 2 reviewers.
Data Synthesis and Statistical Analysis
We performed the statistical analysis in MATLAB (The MathWorks, Inc., Natick, MA, USA) and R 3.5.1 (R Foundation for Statistical Computing, Vienna, Austria). To determine the age at which the decline of BCVA transitions from the slow to rapid decline phase, we performed a segmented regression analysis of BCVA as a function of age (based on the first visit) using the “Segmented” package in R 3.5.1.35 The segmented regression is a widely applied method to assess the existence and location of a transition point at which the slope of a linear regression changes significantly. To test the robustness of the estimation, we performed a sensitivity analysis by removing 1 study at a time and conducted a subgroup analysis stratified by study design. To further validate the estimated transition age, we used an alternative segmented regression analysis method by fitting BCVA as a function of age using a piecewise linear regression with a preset transition age; then, we iteratively changed the preset transition age 1 year at a time from 25 to 55 years until the r2 of the piecewise linear trendline was maximized.
Kaplan-Meier survival analyses of BCVA as a function of age were conducted using 3 endpoints, which include <85 letters (impaired VA), <70 letters (subnormal VA), and ≤35 letters (legal blindness)36. A BCVA lower than the cut-off was defined as an “event” in each survival analysis.12 The Kaplan-Meier survival analysis was conducted separately for the right, left, worse-seeing, and better-seeing eyes (defined based on the first available visit).
We analyzed the longitudinal BCVA data by first plotting BCVA as a function of age at examination for eyes followed over ≥2 visits. To account for different transition ages among different eyes, we introduced a horizontal translation factor (in negative years) to the dataset of each eye, which essentially converted the horizontal axis from “age” to “inferred duration of the rapid decline phase”, where [“inferred duration of the rapid decline phase” = “age” + “translation factor”].37–45 On the new horizontal axis, time 0 represented the onset time of the rapid decline phase. Since the transition age for each eye was unknown, we estimated the translation factors by adjusting 1 translation factor by 1 month at a time within a large interval between −50 years and baseline age; then, we repeated this process iteratively until the r2 was maximized for the cumulative 2-phase linear regression.37–45 We also performed the same analysis to assess a 1-phase linear model, in which BCVA was hypothesized to decline linearly as a function of time from 85 to 0 letters. The “entry time realignment” analysis was performed using a custom automated MATLAB based program, which was described and applied in our previous studies.37–43
We determined the natural decline rate of BCVA in each phase using a 2-stage approach,31 in which we first performed a linear mixed-effects regression (“lme4” package46 in R) to estimate the mean and standard error (SE) of the BCVA decline rate for each study, and then we conducted a random-effects meta-analysis (metafor package47 in R) to synthesize the aggregate data. We assessed the heterogeneity by the I2 statistic,48 and performed a sensitivity analysis by removing 1 study at a time from the meta-analysis.
Results
Database and Study Quality
We included 25 articles from 23 eligible studies (online supplementary figure 1 and online supplementary table 1).3–5, 8–13, 15–30 Online supplementary table 2 shows the reasons for exclusions of studies. We obtained cross-sectional data of individual eyes from all included studies (1004 eyes in 693 patients). Seventeen studies reported BCVA data of both eyes of a patient (612 eyes), and all but 1 of the 17 studies reported the laterality of the eyes (600 eyes). Four studies reported longitudinal BCVA data of individual eyes (287 visits from 102 eyes). The included eyes represented a broad spectrum of CHM, with age at examination ranging from 3 to 84 years, and BCVA ranging from 0 to 95 letters. The included studies had a low or moderate risk of bias in each assessed bias domain (online supplementary table 3).
The Transition Age from Slow to Rapid BCVA Decline Was Approximately 39 Years
The segmented regression analysis35 of 1004 eyes shows that the BCVA followed a 2-phase linear decline (figure 1). The BCVA initially declined at a very slow rate (0.24 letter/year, 95% confidence interval (CI) 0.04 to 0.45) before 39.1 years, and then dropped at a significantly faster rate (1.16 letters/year, 95% CI 0.93 to 1.39) after 39.1 years (p<0.001). The estimated transition age was 39.1 years (95% CI 33.5 to 44.7).
Figure 1.
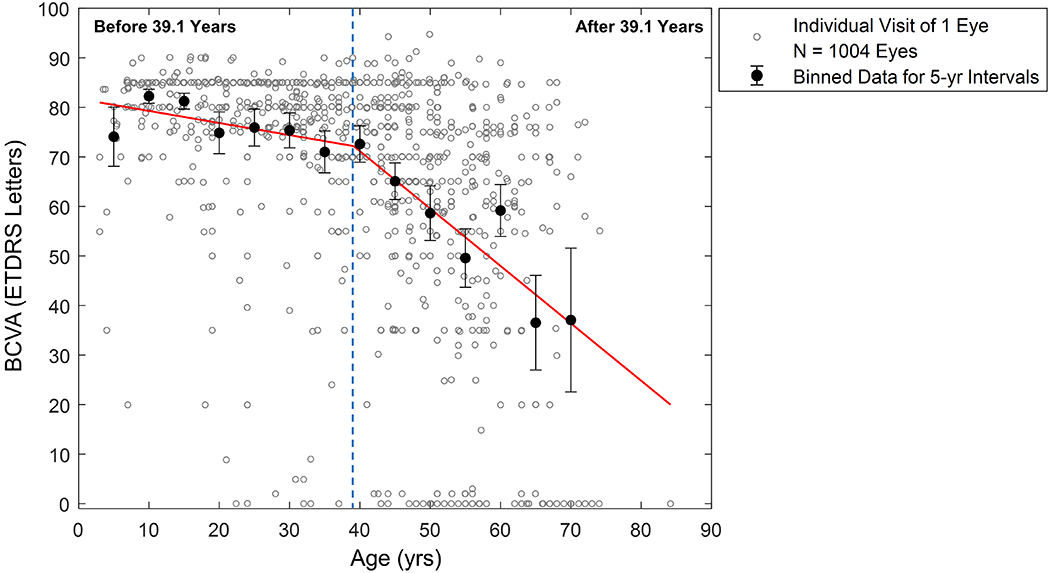
Best-corrected visual acuity (BCVA) as a function of age in 1004 untreated eyes with choroideremia from 23 studies. Each grey circle represents data from the first available visit of one eye. Each black filled circle represents the mean ± 95% CI of BCVA for every five-year interval. We estimated the segmented linear regression (red line) based on the segmented regression analysis without a preset transition age. The BCVA decline appears to follow a 2-phase linear model with an estimated transition age of 39.1 years (95% CI = 33.5-44.7) (r2 = 0.23). The estimated BCVA decline rate is 0.24 letters/year (95% CI = 0.04-0.45) before 39.1 years versus 1.16 letters/year (95% CI = 0.93-1.39) after 39.1 years (P < 0.001 from the Davies’ test). CI = confidence interval.
After the removal of 1 study at a time, the estimated mean transition age was relatively unaffected (38.1 to 40.6 years). Furthermore, the estimated transition age was comparable between studies with cross-sectional design (40.6 years; 95% CI = 33.6-47.6) and with longitudinal design (38.8 years; 95% CI 29.3 to 48.2). Based on the alternative segmented regression method (online supplementary figure 2), we found that the highest r2 was also achieved at 39 years.
Patients with CHM Exhibited Inter-eye Symmetry of BCVA
The BCVA of the right and left eyes showed a moderate correlation (r=0.60) (figure 2A). The Kaplan-Meier survival plots of BCVA of the right and left eyes were nearly identical (figure 2B and C, and online supplementary figure 3), indicating that the laterality of the eye was not a prognostic factor for the BCVA decline.
Figure 2.

Symmetry between the best-corrected visual acuity (BCVA) of the right (OD) and left (OS) eyes with choroideremia (N = 300 patients from 16 studies). A, We found a moderate correlation between the BCVA of OD and OS (Pearson’s r = 0.60). B, The Kaplan-Meier survival plot estimated the proportion of eyes retaining BCVA of 85 letters as a function of age (the shaded area represents the 95% confidence interval). The survival plots for the OD and OS have significant overlaps and the estimated median age when the BCVA drops below 85 letters is 45 years for both eyes. C, The Kaplan-Meier survival plot estimated the proportion of eyes with BCVA above 35 letters (equivalent to 20/200) as a function of age. The estimated median age when the BCVA drops to 35 letters or below is 69 and 67 years for the OD and OS, respectively.
The survival plots of BCVA in the worse- and better-seeing eyes were shown in figure 3A and B, and online supplementary figure 4. For the worse-seeing eyes, the estimated median age when BCVA dropped to impaired VA, subnormal VA, and legal blindness was 45, 52, and 66 years, respectively. For the better-seeing eyes, the median age at which BCVA reached impaired VA, subnormal VA, and legal blindness was 47, 58, and 72 years, respectively.
Figure 3.

Kaplan-Meier survival plots of best-corrected visual acuity (BCVA) for the worse- and better-seeing eyes (based on BCVA at the first available visit) in 306 patients with choroideremia from 17 studies. A, The survival plot estimated the proportion of eyes retaining BCVA of 85 letters (equivalent to 20/20) as a function of age (the shaded area represents the 95% confidence interval). The estimated median age when the BCVA drops below 85 letters is 45 and 47 years for the worse- and better-seeing eyes, respectively. B, The survival plot estimated the proportion of eyes with BCVA above 35 letters (equivalent to 20/200) as a function of age. The estimated median age when the BCVA dropped to 35 letters or below is 66 and 72 years for the worse- and better-seeing eyes, respectively.
The Longitudinal Data Further Supported the 2-Phase Linear Model
Figure 4A shows BCVA of 102 eyes followed over 287 visits. At the time of enrollment, the BCVA varied widely among individual eyes, suggesting that different eyes might be at different time points in the natural BCVA decline course. After converting the horizontal axis to the age (figure 4B), we found that the BCVA appeared relatively stable at young ages but declined rapidly at more advanced ages. Before 39 years, the decline rate of BCVA was 0.33 letters/year (95% CI −0.38 to 1.05), not significantly different from 0 (p=0.36, online supplementary figure 5A). In contrast, after 39 years, BCVA declined at a significantly faster rate of 1.23 letters/year (95% CI 0.55 to 1.92), significantly higher than 0 letters/year (p<0.001, online supplementary figure 5B). The estimated difference in the decline rate of BCVA before and after 39 years was 1.05 letters/year (95% CI 0.34 to 1.75, p=0.004, figure 5A).
Figure 4.

Best-corrected visual acuity (BCVA) as a function of time in 102 untreated individual eyes with Choroideremia (CHM) over 287 visits. A, Individual-level raw data from prior publications. The plot shows a series of 102 lines representing the change of BCVA after enrolment into each study. Each dashed line represents one eye with untreated CHM, and the markers on the dashed line represent the BCVA at baseline and subsequent follow-up(s). Note that the initial BCVA (scattering of marks vertically at time = zero) varies widely among different patients. B, After we changed the x-axis to age at time of examination, the slopes of the datasets (i.e., the BCVA decline rate) appear to be relatively small in young ages and are larger for advanced ages (note most of the dramatic drops in vision tend to occur beyond age 40), suggesting a 2-phase model. However, the datasets are still scattered. Some eyes appear to have high BCVA decline rate at young ages (e.g., the dataset marked in red), while some other eyes appear to have low BCVA decline rate at advanced ages (e.g., the dataset marked in blue). C, Data were generated by adding a horizontal translation factor (expressed in years) to each dataset in (B) to account for different ages of onset of the rapid decline phase. The x-axis now represents the inferred duration of the rapid decline phase, and the time zero represents the onset of the rapid decline phase. After the horizontal shifts of the raw datasets, the individual datasets (grey dashed lines) now follow a two-phase linear model (red line) over time until the BCVA drops to 0 letter (r2 = 0.90).
Figure 5.

Difference in the decline rate of the best-corrected visual acuity (BCVA) between (A) patients below and above 39 years, and (B) the slow and rapid decline phases in 102 eyes with longitudinal follow-up data. The diamond represents the overall effect estimate (width of the diamond represents the 95% confidence interval (CI)). A, The estimated BCVA decline rate after 39 years (1.23 letters/year, 95% CI = 0.55-1.92]) was significantly higher than the BCVA decline rate before 39 years (0.33 letters/year, 95% CI = −0.38-1.05) (P = 0.004), suggesting 39 years can serve as a marker to identify patients with faster BCVA decline. B, After introducing horizontal translation factors to account for different ages of onset the rapid decline phase, we realigned the raw datasets into 2 phases (Figure 4C). We found that the BCVA decline rate in the rapid decline phase (3.02 letters/year, 95% CI = 2.73-3.30) was significantly higher than the BCVA decline rate in the slow decline phase (0.27 letters/year, 95% CI = −0.02 0.56) (P < 0.001).
The datasets in figure 4B appeared very scattered and demonstrated considerable variation among individual eyes. For example, the BCVA of 1 eye at around 10 years old (the red dashed line) declined rapidly, while the BCVA of another eye at approximately 70 years old (the blue dashed line) was only mildly affected. One potential source of the substantial inter-individual variation of BCVA was that different eyes might have different ages at onset of the rapid decline phase (i.e., transition ages). After the introduction of horizontal translation factors to each dataset to account for the different transition ages, the datasets became much more uniform and fit along with a 2-phase linear model until the BCVA dropped to 0 letters (r2=0.90; compare figure 4C and 4B). The BCVA decline rate in the slow and rapid decline phase was 0.27 letters/year (95% CI −0.02 to 0.56) and 3.02 letters/year (95% CI 2.73 to 3.30), respectively (online supplementary figure 6), with an estimated difference as 2.67 letters/year (95% CI 2.12 to 3.21, p<0.001, figure 5B). In comparison, a 1-phase linear model resulted in a poor fit (r2 = 0.65; online supplementary figure 7).
The I2 was 72.6% in the comparison between the BCVA decline rate before and after 39 years (figure 5A), and 74.1% in the comparison between the BCVA decline rate in the slow and rapid decline phase (figure 5B). Sensitivity analysis showed that after removing data from 1 study (Van Schuppen et al.)12, the I2 in both meta-analyses dropped to a minimal value (I2 = 11.6% and 0%, respectively), suggesting the single study12 may explain most of the heterogeneity between the studies. After we removed the data by Van Schuppen et al.12 from the meta-analysis, we found that the effect size of the meta-analyses shown in figure 5A (0.65 letters/year, 95% CI 0.15 to 1.15, p=0.01) and figure 5B (2.39 letters/year, 95% CI 2.02 to 2.76, p<0.001) remained statistically significant with relatively unaffected effect size.
Discussion
The present meta-analysis was motivated by our desire to resolve the substantial discrepancy in clinical data among eyes with CHM. After examining BCVA as a function of age (figure 4B), we were struck by the apparent differences in BCVA of individual eyes even at equivalent ages. A priori, the reasons for the differences are unknown, but there are at least 2 possibilities. First, different eyes may represent different subpopulations of CHM, with each subpopulation following a unique pattern of BCVA decline. However, a more unifying hypothesis is that the decline of BCVA in different eyes follows the same 2-phase linear model, but they may have different transition ages. In other words, BCVA of some eyes may remain relatively unaffected for several decades before it starts to decline rapidly, while BCVA of some other eyes may start to decline rapidly at a much younger age. Examination of figure 4B implies that this is indeed the case. BCVA of most eyes appeared to follow a trend of a 2-phase decline, but the transition ages were widely scattered (figure 4B). After the introduction of a horizontal translation factor to each dataset to account for different transition ages,37–42, 44, 45 the datasets followed the 2-phase linear model uniformly over time (r2=0.90; figure 4C) with significantly different BCVA decline rates between the 2 phases (p<0.001). Our study suggests that the BCVA in eyes with CHM follows the 2-phase linear decline model, with an estimated transition age of 39.1 years (95% CI 33.5 to 44.7). Before 39 years, the BCVA decline rate (0.33 letters/year, 95%CI −0.38 to 1.05) was not significantly different from 0 (p=0.36); but after 39 years, the BCVA decline rate (1.23 letters/year, 95% CI 0.55 to 1.92) became significantly higher than 0 letters/year (p<0.001). We also found moderate symmetry between the BCVA of the right and left eyes (r=0.60) and generated Kaplan-Meier survival plots of BCVA as a function of age.
Our meta-analysis provides several insights. Current gene therapy trials often use BCVA as the primary endpoint and have a follow-up duration around 2 years.3–5, 7 Thus, for future trials that will continue to use BCVA as a primary endpoint, investigators need to identify patients who have a measurable BCVA decline in the relatively short time frame. We suggest that the age may serve as a biomarker for trials to recruit patients with measurable BCVA decline using 39 years as a potential cut-off. Alternatively, investigators may follow a patient cohort over time to identify eyes likely in the rapid BCVA decline phase. Furthermore, our study showed a moderate correlation between the BCVA of right and left eyes (r=0.60), and the BCVA decline rate was independent of the laterality (Figure 2). These findings indicate that CHM is a bilateral disease, but there are concerns about using the fellow eyes as controls in treatment trials. Some patients had extremely different BCVA between the right and left eyes (figure 2A), and the BCVA decline rate between the worse- and better-seeing eyes may not always be the same. For example, figure 3B shows a 6-year difference in the median age of legal blindness (≤35 letters) between the worse- and better-seeing eyes. Also, from age 40 to 50 years, the percentage of eyes reaching legal blindness increased by 13.5% among the worse-seeing eyes but only by 4.7% among the better-seeing eyes. Thus, treatment trials that assign the worse-seeing eyes in the treatment group and the better-seeing eyes in the control group4, 7 should interpret the results with caution and account for different baseline BCVA between the 2 groups.
Alternative biomarkers are needed to monitor CHM progression in patients younger than 39 years, who often have a relatively stable BCVA over short term. One promising biomarker is the residual retinal pigment epithelium (RPE) area assessed by fundus autofluorescence, which was proposed in previous studies3–5, 7 and supported by our recent meta-analysis (257 eyes).42 We showed that the decline rate of log transformed residual RPE area was consistent across 12 to 72 years of age (r = 0.06; P = 0.63).42 Another potential biomarker is the central retinal thickness measured by optical coherence tomography, which was shown to be negatively associated with age and BCVA in patients with CHM.8, 10, 15, 49 Moreover, Khan et al retrospectively reviewed 29 children with CHM and found that patients in whom BCVA declined over the follow-up period recorded a reduction in central retinal thickness; in comparison, patients with stable BCVA had an increase in central retinal thickness.49 Khan et al proposed that the central retinal thickness might be a surrogate marker of early photoreceptor death.49 Other alternative outcomes may include retinal sensitivity, visual field, color vision, reading speed, and subfoveal choroidal thickness.3–5, 7 Future longitudinal studies including a large cohort of patients with CHM are needed to establish the reliability of these early biomarkers and endpoints for treatment trials. An intervention in young patients may slow down or reverse the disease progression before patients enter the rapid BCVA decline phase.
The underlying mechanism responsible for the 2-phase linear decline of BCVA is unclear. One possible explanation is that insults may accumulate in the central retina affected by CHM over the first decades of life, and eventually pass a critical threshold at around age 40 years, triggering an accelerated deterioration of the central retina. An alternative explanation for the 2-phase linear decline of BCVA is the preservation of the central retina from atrophy until later in the course of CHM.9, 10 This hypothesis is consistent with the data in our recent meta-analysis of RPE atrophy in CHM.42 We estimated the decline rate of residual RPE area as 10.88%/year and the mean age at 20° residual RPE in diameter as 27.0 years.42 Using these data, we projected the residual RPE area at 39 years as 6.54 mm2, equivalent to approximately 2.89 mm (or 10 degrees)50 in diameter. Moreover, Aleman et al found that BCVA loss usually occurred when the edge of atrophy was within approximately 2 mm of the foveal center.10 To further investigate the hypothesis, future longitudinal studies are needed to follow the changes in retinal structure (e.g., residual RPE area, central retinal thickness, central choroidal thickness, pigment clumping at the level of RPE, macular hole formation, and outer retinal tubulation)10, 49 in patients affected by CHM around 39 years and correlate the anatomic findings with BCVA.
Our results may also be useful for patient care and counseling. We found the median age when BCVA of the better-seeing eye drops below 70 letters as 58 years, suggesting that BCVA may not limit the daily function of most CHM patients until the sixth decade of life. However, the prognosis of other visual measures is much less favorable as patients with CHM may experience nyctalopia,9 visual field restriction,9, 42 and abnormal color vision8 years before BCVA is affected. Thus, to fully assess the severity of CHM in affected patients, clinicians may need to perform a comprehensive assessment involving functional measures (e.g., color vision, visual field, BCVA, and macular sensitivity) and multimodal retinal imaging (e.g., fundus autofluorescence to assess the residual RPE area, and optical coherence tomography to evaluate central retinal and choroidal thickness as well as rare complications like macular hole formation).10, 42, 49, 51, 52
Strengths of the study include the large number of eyes (1004 eyes) in our meta-analysis, which is more than 5-fold larger than the number of eyes in any single study identified in our literature search. Moreover, the included eyes represent a broad spectrum of CHM with age ranging from 3 to 84 years, and BCVA ranging from 0 to 95 letters. Both cross-sectional and longitudinal data showed consistent results regarding the decline pattern and rates of BCVA. The included studies have relatively high quality with low to moderate risk of bias in bias domains.
The present meta-analysis has several limitations. First, the amount of longitudinal data is relatively small. Although we performed an exhaustive literature search of 7 databases, we only identified 4 studies that followed and reported BCVA in untreated patients (287 visits from 102 eyes) over at least 2 visits. Second, all 4 longitudinal studies that followed BCVA are retrospective, which may be subject to selection bias. To the best of our knowledge, there is only 1 ongoing prospective, longitudinal study on the natural history of BCVA in untreated patients with CHM (NCT02994368). Third, we found a large amount of heterogeneity (I2>70%) in the BCVA decline rate between different studies, which may be due to a single study12 based on our sensitivity analysis. Fourth, since we only had access to the reported data, we were unable to assess the impact of potential prognostic factors on BCVA. For example, the ethnicity of individual patients was not reported in most of the included studies. Future studies are needed to understand the relationship between ethnicity (as well as other patient characteristics) and BCVA decline in patients with CHM. Last, since only 4 studies reported longitudinal data of BCVA, we did not perform funnel plots to assess potential publication bias.48
In conclusion, this meta-analysis of individual-level data from 1004 eyes demonstrates that the decline of BCVA follows a 2-phase linear model with a transition at 39 years of age. The BCVA declines very slowly at a rate of 0.33 letters/year before 39 years but drops significantly faster after 39 years (1.23 letters/year). Future studies need to establish better biomarkers than BCVA to monitor CHM progression in patients younger than 39 years. Examples of such biomarkers could include anatomic markers from imaging modalities (e.g., fundus autofluorescence, optical coherence tomography) or other functional tests (e.g., reading speed, visual field, color vision). BCVA may still have utility as a primary endpoint for patients older than 39 years who have measurable BCVA decline rates.
Supplementary Material
SYNOPSIS.
In the meta-analysis of 1004 eyes with choroideremia, visual acuity declined slowly (0.33 letters/year) before and rapidly (1.23 letters/year) after 39 years, suggesting age as a biomarker to identify patients with measurable visual acuity decline.
Acknowledgments
The authors would like to thank Dr. Mark E. Pennesi (Casey Eye Institute, Oregon Health & Science University, Portland, OR), Dr. Immanuel P. Seitz (University Eye Hospital, University of Tübingen, Tübingen, Germany), and Dr. M. Dominik Fischer (University Eye Hospital, University of Tübingen, Tübingen, Germany) for agreeing to share us the data of their study. We also thank Mary Hughes, and Vermetha Polite (Cushing/Whitney Medical Library, Yale University, New Haven, CT) for technical support and Alyssa Grimshaw (Cushing/Whitney Medical Library, Yale University, New Haven, CT) for peer review of the search strategies. This publication was made possible by the Yale School of Medicine Medical Student Research Fellowship.
Financial Support: Research reported in this publication was supported by the Yale School of Medicine Medical Student Research Fellowship (Recipient: Shen).
Footnotes
Publisher's Disclaimer: Disclaimers: The sponsor or funding organization had no role in the design or conduct of this research. The content is solely the responsibility of the authors and does not necessarily represent the official views of the institution or funder.
Competing interests: LVDP, Astellas Institute for Regenerative Medicine (consultant), CavtheRx (scientific and clinical advisors), LambdaVision (consultant), and Tissue Regeneration Sciences (scientific advisory board).
References
- 1.Cremers FP, van de Pol DJ, van Kerkhoff LP, Wieringa B, Ropers H-H. Cloning of a gene that is rearranged in patients with choroideraemia. Nature. 1990;347:674–7. [DOI] [PubMed] [Google Scholar]
- 2.MacLaren RE, Groppe M, Barnard AR, Cottriall CL, Tolmachova T, Seymour L, et al. Retinal gene therapy in patients with choroideremia: initial findings from a phase 1/2 clinical trial. Lancet. 2014;383:1129–37. [DOI] [PMC free article] [PubMed] [Google Scholar]
- 3.Fischer MD, Ochakovski GA, Beier B, Seitz IP, Vaheb Y, Kortuem C, et al. Changes in retinal sensitivity after gene therapy in choroideremia. Retina. 2020;40:160–8. [DOI] [PubMed] [Google Scholar]
- 4.Lam BL, Davis JL, Gregori NZ, MacLaren RE, Girach A, Verriotto JD, et al. Choroideremia gene therapy phase 2 clinical trial: 24-month results. Am J Ophthalmol. 2019;197:65–73. [DOI] [PubMed] [Google Scholar]
- 5.Xue K, Jolly JK, Barnard AR, Rudenko A, Salvetti AP, Patricio MI, et al. Beneficial effects on vision in patients undergoing retinal gene therapy for choroideremia. Nat Med. 2018;24:1507–12. [DOI] [PMC free article] [PubMed] [Google Scholar]
- 6.Fischer MD, Ochakovski GA, Beier B, Seitz IP, Vaheb Y, Kortuem C, et al. Efficacy and safety of retinal gene therapy using adeno-associated virus vector for patients with choroideremia: a randomized clinical trial. JAMA ophthalmology. 2019;137:1247–54. [DOI] [PMC free article] [PubMed] [Google Scholar]
- 7.Dimopoulos IS, Hoang SC, Radziwon A, Binczyk NM, Seabra MC, MacLaren RE, et al. Two-year results after aav2-mediated gene therapy for choroideremia: the alberta experience. Am J Ophthalmol. 2018;193:130–42. [DOI] [PubMed] [Google Scholar]
- 8.Heon E, Alabduljalil T, McGuigan ID, Cideciyan AV, Li S, Chen S, et al. Visual function and central retinal structure in choroideremia. Invest Ophthalmol Vis Sci. 2016;57:OCT377–87. [DOI] [PubMed] [Google Scholar]
- 9.Freund PR, Sergeev YV, MacDonald IM. Analysis of a large choroideremia dataset does not suggest a preference for inclusion of certain genotypes in future trials of gene therapy. Molecular genetics & genomic medicine. 2016;4:344–58. [DOI] [PMC free article] [PubMed] [Google Scholar]
- 10.Aleman TS, Han G, Serrano LW, Fuerst NM, Charlson ES, Pearson DJ, et al. Natural history of the central structural abnormalities in choroideremia: a prospective cross-sectional study. Ophthalmology. 2017;124:359–73. [DOI] [PMC free article] [PubMed] [Google Scholar]
- 11.Di Iorio V, Esposito G, De Falco F, Boccia R, Fioretti T, Colucci R, et al. CHM/REP1 transcript expression and loss of visual function in patients affected by choroideremia. Invest Ophthalmol Vis Sci. 2019;60:1547–55. [DOI] [PubMed] [Google Scholar]
- 12.van Schuppen SM, Talib M, Bergen AA, Ten Brink JB, Florijn RJ, Boon CJF, et al. Long-term follow-up of patients with choroideremia with scleral pits and tunnels as a novel observation. Retina. 2018;38:1713–24. [DOI] [PubMed] [Google Scholar]
- 13.Roberts MF, Fishman GA, Roberts DK, Heckenlively JR, Weleber RG, Anderson RJ, et al. Retrospective, longitudinal, and cross sectional study of visual acuity impairment in choroideraemia. Br J Ophthalmol. 2002;86:658–62. [DOI] [PMC free article] [PubMed] [Google Scholar]
- 14.Coussa RG, Kim J, Traboulsi EI. Choroideremia: effect of age on visual acuity in patients and female carriers. Ophthalmic Genet. 2012;33:66–73. [DOI] [PubMed] [Google Scholar]
- 15.Abbouda A, Lim WS, Sprogyte L, Webster AR, Moosajee M. Quantitative and qualitative features of spectral-domain optical coherence tomography provide prognostic indicators for visual acuity in patients with choroideremia. Ophthalmic Surg Lasers Imaging Retina. 2017;48:711–6. [DOI] [PubMed] [Google Scholar]
- 16.Duncan JL, Aleman TS, Gardner LM, De Castro E, Marks DA, Emmons JM, et al. Macular pigment and lutein supplementation in choroideremia. Exp Eye Res. 2002;74:371–81. [DOI] [PubMed] [Google Scholar]
- 17.Dimopoulos IS, Freund PR, Knowles JA, MacDonald IM. The natural history of full-field stimulus threshold decline in choroideremia. Retina. 2018;38:1731–42. [DOI] [PubMed] [Google Scholar]
- 18.Dysli C, Wolf S, Zinkernagel MS. Autofluorescence lifetimes in geographic atrophy in patients with age-related macular degeneration. Invest Ophthalmol Vis Sci. 2016;57:2479–87. [DOI] [PubMed] [Google Scholar]
- 19.Genead MA, Fishman GA. Cystic macular oedema on spectral-domain optical coherence tomography in choroideremia patients without cystic changes on fundus examination. Eye (Lond). 2011;25:84–90. [DOI] [PMC free article] [PubMed] [Google Scholar]
- 20.Han X, Li H, Wu S, Sun Z, Zhou Q, Sui R. Study of natural history of Chinese patients with choroideremia. Chinese Journal of Experimental Ophthalmology. 2018;36:519–25. [Google Scholar]
- 21.Hayakawa M, Fujiki K, Hotta Y, Ito R, Ohki J, Ono J, et al. Visual impairment and REP-1 gene mutations in Japanese choroideremia patients. Ophthalmic Genet. 1999;20:107–15. [DOI] [PubMed] [Google Scholar]
- 22.Jain N, Jia Y, Gao SS, Zhang X, Weleber RG, Huang D, et al. Optical coherence tomography angiography in choroideremia: correlating choriocapillaris loss with overlying degeneration. JAMA Ophthalmol. 2016;134:697–702. [DOI] [PMC free article] [PubMed] [Google Scholar]
- 23.Lazow MA, Hood DC, Ramachandran R, Burke TR, Wang YZ, Greenstein VC, et al. Transition zones between healthy and diseased retina in choroideremia (CHM) and Stargardt disease (STGD) as compared to retinitis pigmentosa (RP). Invest Ophthalmol Vis Sci. 2011;52:9581–90. [DOI] [PMC free article] [PubMed] [Google Scholar]
- 24.Li S, Guan L, Fang S, Jiang H, Xiao X, Yang J, et al. Exome sequencing reveals CHM mutations in six families with atypical choroideremia initially diagnosed as retinitis pigmentosa. 2014;34:573–7. [DOI] [PubMed] [Google Scholar]
- 25.Morgan JI, Han G, Klinman E, Maguire WM, Chung DC, Maguire AM, et al. High-resolution adaptive optics retinal imaging of cellular structure in choroideremia. Invest Ophthalmol Vis Sci. 2014;55:6381–97. [DOI] [PMC free article] [PubMed] [Google Scholar]
- 26.Renner AB, Kellner U, Cropp E, Preising MN, MacDonald IM, van den Hurk J, et al. Choroideremia: Variability of clinical and electrophysiological characteristics and first report of a negative electroretinogram. Ophthalmology. 2006;113:2066–73. [DOI] [PubMed] [Google Scholar]
- 27.Sanchez-Alcudia R, Garcia-Hoyos M, Lopez-Martinez MA, Sanchez-Bolivar N, Zurita O, Gimenez A, et al. A comprehensive analysis of choroideremia: From genetic characterization to clinical practice. PLoS One. 2016;11:e0151943. [DOI] [PMC free article] [PubMed] [Google Scholar]
- 28.Sandberg MA, Gaudio AR. Reading speed of patients with advanced retinitis pigmentosa or choroideremia. Retina. 2006;26:80–8. [DOI] [PubMed] [Google Scholar]
- 29.Seitz IP, Zhour A, Kohl S, Llavona P, Peter T, Wilhelm B, et al. Multimodal assessment of choroideremia patients defines pre-treatment characteristics. Graefes Arch Clin Exp Ophthalmol. 2015;253:2143–50. [DOI] [PubMed] [Google Scholar]
- 30.Simunovic MP, Jolly JK, Xue K, Edwards TL, Groppe M, Downes SM, et al. The spectrum of CHM gene mutations in choroideremia and their relationship to clinical phenotype. Invest Ophthalmol Vis Sci. 2016;57:6033–9. [DOI] [PMC free article] [PubMed] [Google Scholar]
- 31.Stewart LA, Clarke M, Rovers M, Riley RD, Simmonds M, Stewart G, et al. Preferred reporting items for a systematic review and meta-analysis of individual participant data: the PRISMA-IPD statement. JAMA. 2015;313:1657–65. [DOI] [PubMed] [Google Scholar]
- 32.Gregori NZ, Feuer W, Rosenfeld PJ. Novel method for analyzing snellen visual acuity measurements. Retina. 2010;30:1046–50. [DOI] [PubMed] [Google Scholar]
- 33.Lange C, Feltgen N, Junker B, Schulze-Bonsel K, Bach M. Resolving the clinical acuity categories “hand motion” and “counting fingers” using the Freiburg Visual Acuity Test (FrACT). Graefes Arch Clin Exp Ophthalmol. 2009;247:137–42. [DOI] [PubMed] [Google Scholar]
- 34.Hayden JA, van der Windt DA, Cartwright JL, Côté P, Bombardier C. Assessing bias in studies of prognostic factors. Ann Intern Med. 2013;158:280–6. [DOI] [PubMed] [Google Scholar]
- 35.Muggeo VM. Segmented: an R package to fit regression models with broken-line relationships. R news. 2008;8:20–5. [Google Scholar]
- 36.Social Security Administration. Disability evaluation under social security. SSA pub; 2002. [Google Scholar]
- 37.Shen L, Liu F, Grossetta Nardini H, Del Priore LV. Natural history of geographic atrophy in untreated eyes with nonexudative age-related macular degeneration: a systematic review and meta-analysis. Ophthalmol Retina. 2018;2:914–21. [DOI] [PubMed] [Google Scholar]
- 38.Shen LL, Liu F, Nardini HG, Del Priore LV. Reclassification of fundus autofluorescence patterns surrounding geographic atrophy based on progression rate: a systematic review and meta-analysis. Retina. 2019;39:1829–39. [DOI] [PubMed] [Google Scholar]
- 39.Shen LL, Liu F, Grossetta Nardini HK, Del Priore LV. Fellow eye status is a biomarker for the progression rate of geographic atrophy: a systematic review and meta-analysis. Ophthalmol Retina. 2019;3:305–15. [DOI] [PubMed] [Google Scholar]
- 40.Shen LL, Sun M, Grossetta Nardini HK, Del Priore LV. Natural history of autosomal recessive Stargardt disease in untreated eyes: a systematic review and meta-analysis of study- and individual-level data. Ophthalmology. 2019;126:1288–96. [DOI] [PubMed] [Google Scholar]
- 41.Shen LL, Sun M, Khetpal S, Grossetta Nardini HK, Del Priore LV. Topographic variation of the growth rate of geographic atrophy in nonexudative age-related macular degeneration: a systematic review and meta-analysis. Invest Ophthalmol Vis Sci. 2020;61:2. [DOI] [PMC free article] [PubMed] [Google Scholar]
- 42.Shen LL, Ahluwalia A, Sun M, Young BK, Grossetta Nardini HK, Del Priore LV. Long-term natural history of atrophy in eyes with choroideremia-a systematic review and meta-analysis of individual-level data. Ophthalmol Retina (in press). 2020. [DOI] [PMC free article] [PubMed] [Google Scholar]
- 43.Shen LL, Sun M, Grossetta Nardini HK, Del Priore LV. Progression of unifocal vs. multifocal geographic atrophy in age-related macular degeneration: a systematic review and meta-analysis. Ophthalmol Retina (in press). 2020. [DOI] [PMC free article] [PubMed] [Google Scholar]
- 44.Shah AR, Del Priore LV. Progressive visual loss in subfoveal exudation in age-related macular degeneration: a meta-analysis using Lineweaver-Burke plots. Am J Ophthalmol. 2007;143:83–9. [DOI] [PubMed] [Google Scholar]
- 45.Liu TYA, Shah AR, Del Priore LV. Progression of lesion size in untreated eyes with exudative age-related macular degeneration: a meta-analysis using Lineweaver-Burk plots. JAMA Ophthalmol. 2013;131:335–40. [DOI] [PubMed] [Google Scholar]
- 46.Bates D, Mächler M, Bolker B, Walker S. Fitting linear mixed-effects models using lme4. Journal of Statistical Software. 2015;67:1–48. [Google Scholar]
- 47.Viechtbauer W Conducting meta-analyses in R with the metafor package. Journal of statistical software. 2010;36:1–48. [Google Scholar]
- 48.Green S, Higgins J. Cochrane handbook for systematic reviews of interventions version 5.1.0 [updated March 2011]. The Cochrane Collaboration. 2011. [Google Scholar]
- 49.Khan KN, Islam F, Moore AT, Michaelides M. Clinical and genetic features of choroideremia in childhood. Ophthalmology. 2016;123:2158–65. [DOI] [PubMed] [Google Scholar]
- 50.Kolb H. Facts and figures concerning the human retina. Webvision: The Organization of the Retina and Visual System [Internet]. 2007. [Google Scholar]
- 51.Jolly JK, Xue K, Edwards TL, Groppe M, MacLaren RE. Characterizing the natural history of visual function in choroideremia using microperimetry and multimodal retinal imaging. Invest Ophthalmol Vis Sci. 2017;58:5575–83. [DOI] [PMC free article] [PubMed] [Google Scholar]
- 52.Jolly JK, Groppe M, Birks J, Downes SM, MacLaren RE. Functional defects in color vision in patients with Choroideremia. Am J Ophthalmol. 2015;160:822–31 e3. [DOI] [PubMed] [Google Scholar]
Associated Data
This section collects any data citations, data availability statements, or supplementary materials included in this article.