

Abstract
BACKGROUND
Rates of maternal mortality are increasing in the United States with significant rural-urban disparities. Pre-pregnancy hypertension is a well-established risk factor for adverse maternal and offspring outcomes.
OBJECTIVES
To inform community-engaged prevention and policy strategies, this study sought to describe trends in maternal pre-pregnancy hypertension among women in rural and urban areas in 2007 to 2018.
METHODS
We performed a nationwide, serial cross-sectional study using maternal data from all live births in women age 15 to 44 years between 2007 and 2018 (CDC Natality Database). Rates of pre-pregnancy hypertension were calculated per 1,000 live births overall and by urbanization status. Subgroup analysis in standard 5-year age categories was performed. We quantified average annual percentage change using Joinpoint Regression and rate ratios (95% confidence intervals [CIs]) to compare yearly rates between rural and urban areas.
RESULTS
Among 47,949,381 live births to women between 2007 and 2018, rates of pre-pregnancy hypertension per 1,000 live births increased among both rural (13.7 to 23.7) and urban women (10.5 to 20.0). Two significant inflection points were identified in 2010 and 2016, with highest annual percentage changes between 2016 and 2018 in rural and urban areas. Although absolute rates were lower in younger compared with older women in both rural and urban areas, all age groups experienced similar increases. The rate ratios of pre-pregnancy hypertension in rural compared with urban women ranged from 1.18 (95% CI: 1.04 to 1.35) for ages 15 to 19 years to 1.51 (95% CI: 1.39 to 1.64) for ages 40 to 44 years in 2018.
CONCLUSIONS
Maternal burden of pre-pregnancy hypertension has nearly doubled in the past decade and the rural-urban gap has persisted.
Keywords: disparities, hypertension, maternal morbidity, race/ethnicity, rural
Maternal mortality in the United States has more than doubled over the past 3 decades, increasing from 7.2 to 17.4 deaths per 100,000 live births in 1989 and 2018, respectively (1). Although changes in the reporting of maternal mortality on death certificates may have contributed, in part, to the increases observed over time (2), U.S. maternal mortality rates are still among the highest in the developed world (1). Cardiovascular disease (CVD) is now the leading cause of pregnancy-related deaths, and hypertension is a well-established risk factor for these potentially preventable deaths (1). Hypertension in women prior to pregnancy is associated with increased risks of pre-eclampsia/eclampsia, renal failure, and CVD postpartum, as well as offspring complications in the peri-natal period and across the life course (3–8). Rates of hypertension among pregnant women in the United States increased by 13-fold between 1970 and 2010, which has been attributed, in part, to an increasing number of women entering pregnancy at an older age (9).
Both the American Heart Association (AHA) and American College of Obstetricians and Gynecologists emphasize the importance of recognizing and reducing risk of CVD in reproductive-age and pregnant women (10,11). However, there are unique challenges faced by women in rural communities in achieving these goals. Place-based health disadvantages related to urbanization have emerged as a major public health problem in the general U.S. population over the past century, with more than a 3-year life expectancy gap and 26% to 40% higher rates of cardiovascular disease and hypertension in rural compared with urban areas (12,13). Similarly, women in rural areas die at a higher rate from pregnancy-related complications compared with women in urban areas, and the rural-urban gap in severe maternal morbidity and mortality is projected to continue to grow (14,15). Limited access to health care prior to and during pregnancy, childbirth, and postpartum may render rural women particularly vulnerable to experience adverse maternal outcomes, and the rural-urban gap may be more pronounced among certain racial and ethnic groups, further amplifying known disparities by race/ethnicity in maternal hypertension (16,17).
Therefore, we aimed to describe trends in rates of pre-pregnancy hypertension in rural and urban areas in the United States between 2007 and 2018, overall and stratified by age and race/ethnicity.
METHODS
We performed a nationwide ecological study using maternal data from all live births in the United States from 2007 to 2018 in the Centers for Disease Control and Prevention (CDC) WONDER (Wide-ranging Online Data for Epidemiologic Research) WONDER) and Natality Database (18). This study was exempt from review by the institutional review board due to the deidentified nature of the dataset. We included maternal data from all live births to mothers age 15 to 44 years (N = 47,949,38). Registration of live births, including data on maternal health, is completed by the professional attendant at birth (e.g., physician or midwife) who integrates data from a variety of sources including the individual and their health records based on guidance from the National Vital Statistics System and CDC. Specifically, pre-existing hypertension defined as a diagnosis prior to the onset of this pregnancy is documented under “risk factors in this pregnancy” and does not include new-onset hypertension in pregnancy (such as gestational hypertension or preeclampsia).
Rates of pre-pregnancy hypertension per 1,000 live births were calculated overall and by urbanization status using the 2013 National Center for Health Statistics urban-rural classification scheme for counties, based on mother’s legal residence at time of birth. Rural areas were designated as counties in metropolitan statistical areas with populations <50,000 (19). Subgroup analysis in 5-year standardized age categories (15 to 19, 20 to 24, 25 to 29, 30 to 34, 35 to 39, and 40 to 44 years) and by race/ethnicity (non-Hispanic White [NHW], non-Hispanic Black [NHB], and Hispanic/Latinx) was performed. As this was a serial cross-sectional study, multiple pregnancies resulting in live births to the same individual were included. Therefore, we also performed a secondary analysis using data only available between 2016 and 2018 to restrict the analysis to nulliparous women only.
We used Joinpoint statistical software to analyze trends in the prevalence of pre-pregnancy hypertension from 2007 to 2018. The Joinpoint analysis models consecutive linear segments on a log scale to define points in time (joinpoints) in which there are statistically significant changes in trends (20,21). Once joinpoints (i.e., statistically significant inflection points) were identified in the overall rates, we calculated the slopes (average annual percent change [APC]) of the segments connecting the joinpoints overall and by rural-urban maternal status. Subgroup analyses were performed, and APC was calculated for each age and race/ethnicity subgroup applying the inflection points identified in the overall rates between 2007 and 2018 to allow standardized comparisons. To examine the potential impact on pre-pregnancy hypertension trends of the 2017 updates to the American College of Cardiology/AHA hypertension guideline, which recommended using a lower systolic and diastolic blood pressure threshold to define hypertension (22), we also separately calculated the percent change in the prevalence of pre-pregnancy hypertension for each year (2016 to 2017, 2017 to 2018) spanning before and after the release of the updated guidelines.
To compare yearly rates of pre-pregnancy hypertension between rural and urban areas, we calculated annual rate ratios (RRs) overall and for each age and race/ethnicity subgroup. RRs were calculated by dividing the rate of live births to mothers with pre-pregnancy hypertension (per 1,000 live births in the same year) in rural areas by that in urban areas. Corresponding 95% confidence intervals (CIs) were calculated using established methods (23,24).
A p value <0.05 was considered statistically significant, and analyses were performed using Stata version 14.2 (College Station, Texas) (25).
RESULTS
STUDY POPULATION DEMOGRAPHICS.
Of the 47,949,381 births to women age 15 to 44 years with live births between 2007 and 2018 in the United States, 54% were NHW, 15% NHB, and 24% Hispanic/Latinx (Table 1). Most had completed a high school education or greater (68%) and initiated prenatal care within the first 5 months of pregnancy (73%). The proportion of women with live births who were younger than 25 years was higher in rural compared with urban areas (41% vs. 29%). Fewer women residing in rural areas had completed greater than a high school education compared with urban areas (23% vs. 32%). A similar percentage of women in both rural and urban areas received any prenatal care within the first trimester.
TABLE 1.
Descriptive Statistics for All Women in the United States Age 15 to 44 Years With Live Births Between 2007 and 2018, Overall and Stratified by Rural or Urban Status
| Total (N = 47,949,381) | Rural (n = 6,563,968) | Urban (n = 41,385,413) | |
|---|---|---|---|
| n | |||
| Age, yrs | |||
| 15–19 | 7.57 | 10.38 | 7.12 |
| 20–24 | 22.65 | 30.12 | 21.46 |
| 25–29 | 28.67 | 30.47 | 28.38 |
| 30–34 | 25.74 | 19.51 | 26.73 |
| 35–39 | 12.63 | 7.91 | 13.37 |
| 40–44 | 2.75 | 1.62 | 2.93 |
| Race/ethnicity | |||
| Non-Hispanic White | 53.60 | 73.34 | 50.46 |
| Non-Hispanic Black | 14.81 | 9.34 | 15.67 |
| Hispanic/Latinx | 23.53 | 12.08 | 25.35 |
| Asian/Pacific Islander | 6.34 | 1.38 | 7.13 |
| Education | |||
| Less than high school | 13.79 | 14.89 | 13.62 |
| High school/GED | 21.18 | 25.39 | 20.51 |
| Some college | 17.12 | 18.50 | 16.90 |
| Bachelor’s/associate’s degree | 21.87 | 18.48 | 22.40 |
| Master’s or doctorate degree | 8.63 | 4.26 | 9.32 |
| Initiation of prenatal care | |||
| Never | 1.32 | 1.08 | 1.36 |
| During months 1–5 | 73.00 | 72.13 | 73.14 |
Values are percentages unless otherwise indicated.
OVERALL TRENDS IN PRE-PREGNANCY HYPERTENSION.
The overall prevalence of pre-pregnancy maternal hypertension increased from 10.9 to 20.5 per 1,000 live births between 2007 and 2018, representing 77,652 births in 2018 (Figure 1, Central Illustration). Women in rural areas had a higher prevalence of pre-pregnancy hypertension compared with urban women who gave birth each year, and the prevalence of pre-pregnancy hypertension increased among both rural (13.7 to 23.7) and urban residents (10.5 to 20.0) over the entire study period (Online Table 1). The overall APC in the prevalence of maternal pre-pregnancy hypertension from 2007 to 2018 was 5.3%/year (95% CI: 4.8% to 5.8%/year) in both rural and urban areas (Table 2). Joinpoint analysis revealed 2 significant inflection points (2010 and 2016) in the overall trends; APCs were 7.2%/year (95% CI: 6.6% to 7.8%/year) in 2007 to 2010, decreased to 4.0%/year (95% CI: 3.5% to 4.4%/year) in 2010 to 2016, and then increased to the highest level of 9.1%/year (95% CI: 8.0% to 10.3%/year) in the most recent period, 2016 to 2018. From 2007 to 2010, the APC was significantly higher among women in urban areas (7.9 %/year [95% CI: 7.4% to 8.4%/year]) compared with women in rural areas (3.7%/year [95% CI: 2.0% to 5.6%/year]). From 2010 to 2016 and 2016 to 2018, rates of pre-pregnancy hypertension significantly increased, and APCs were similar among women residing in rural and urban areas. Rural-urban differences in the rates of pre-pregnancy hypertension persisted over time, with RRs significantly greater than 1 in each year (Central Illustration, Table 3).
FIGURE 1. Prevalence of Maternal Pre-Pregnancy Hypertension per 1,000 Live Births and Average Annual Percentage Change in Rural and Urban United States, 2007 to 2018.
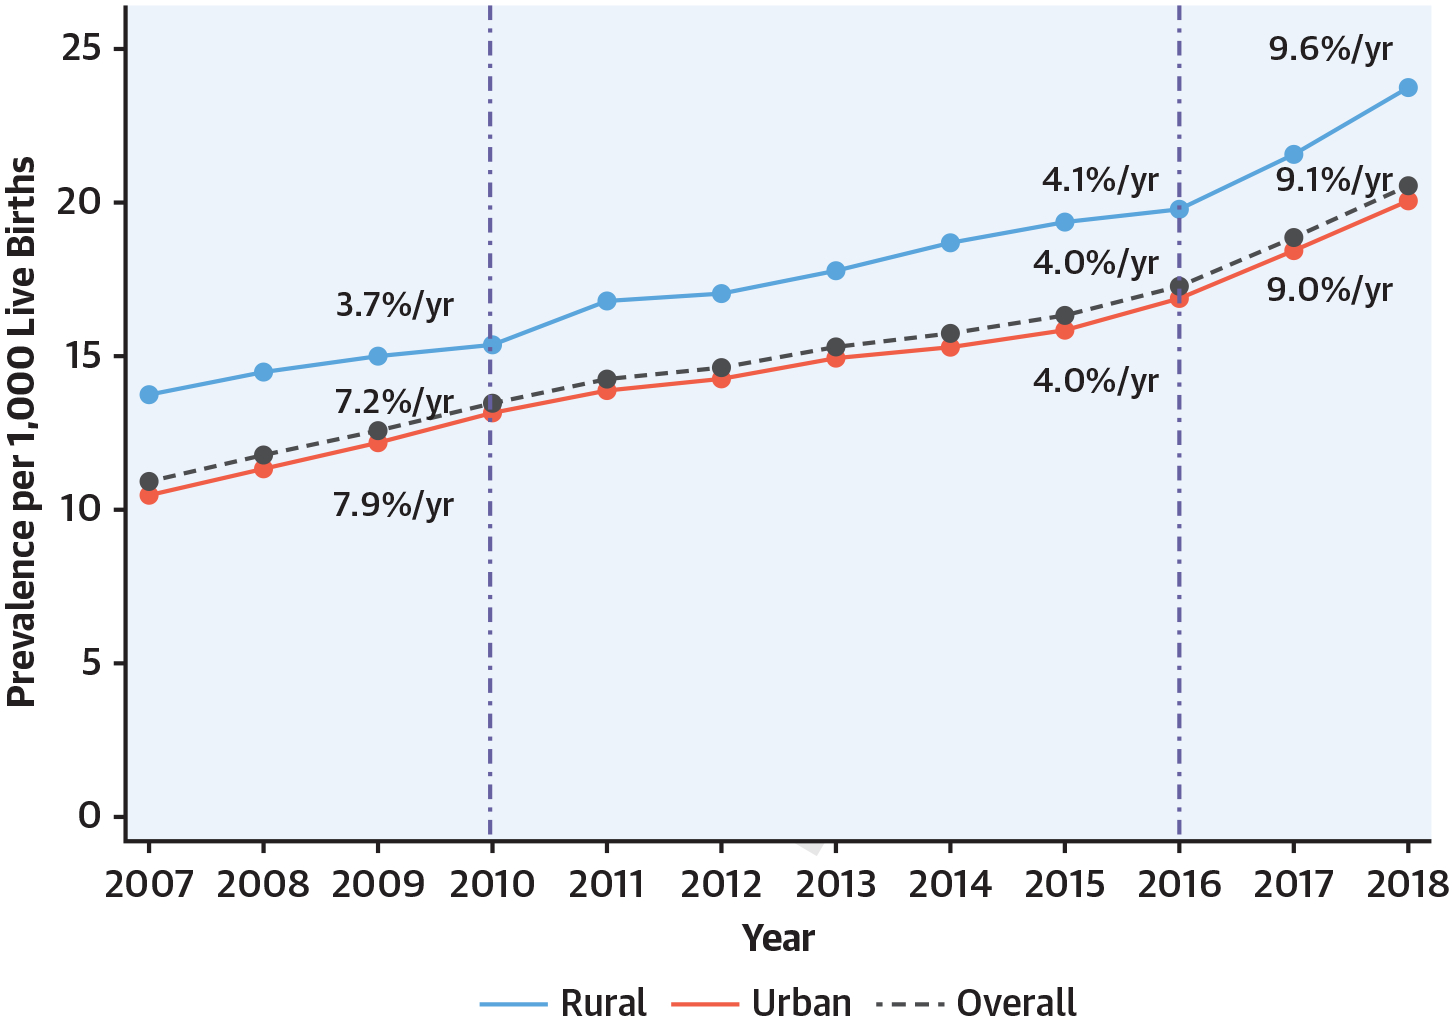
Rates of pre-pregnancy hypertension per 1,000 live births nearly doubled from 2007 to 2018 among both rural (13.7 to 23.7) and urban women (10.5 to 20.0). Two significant inflection points were identified in 2010 and 2016, with the greatest APCs noted between 2016 and 2018 in rural and urban areas.
CENTRAL ILLUSTRATION. Trends in Prevalence and Rate Ratios of Maternal Pre-Pregnancy Hypertension per 1,000 Live Births for Rural Compared With Urban United States, 2007 to 2018.
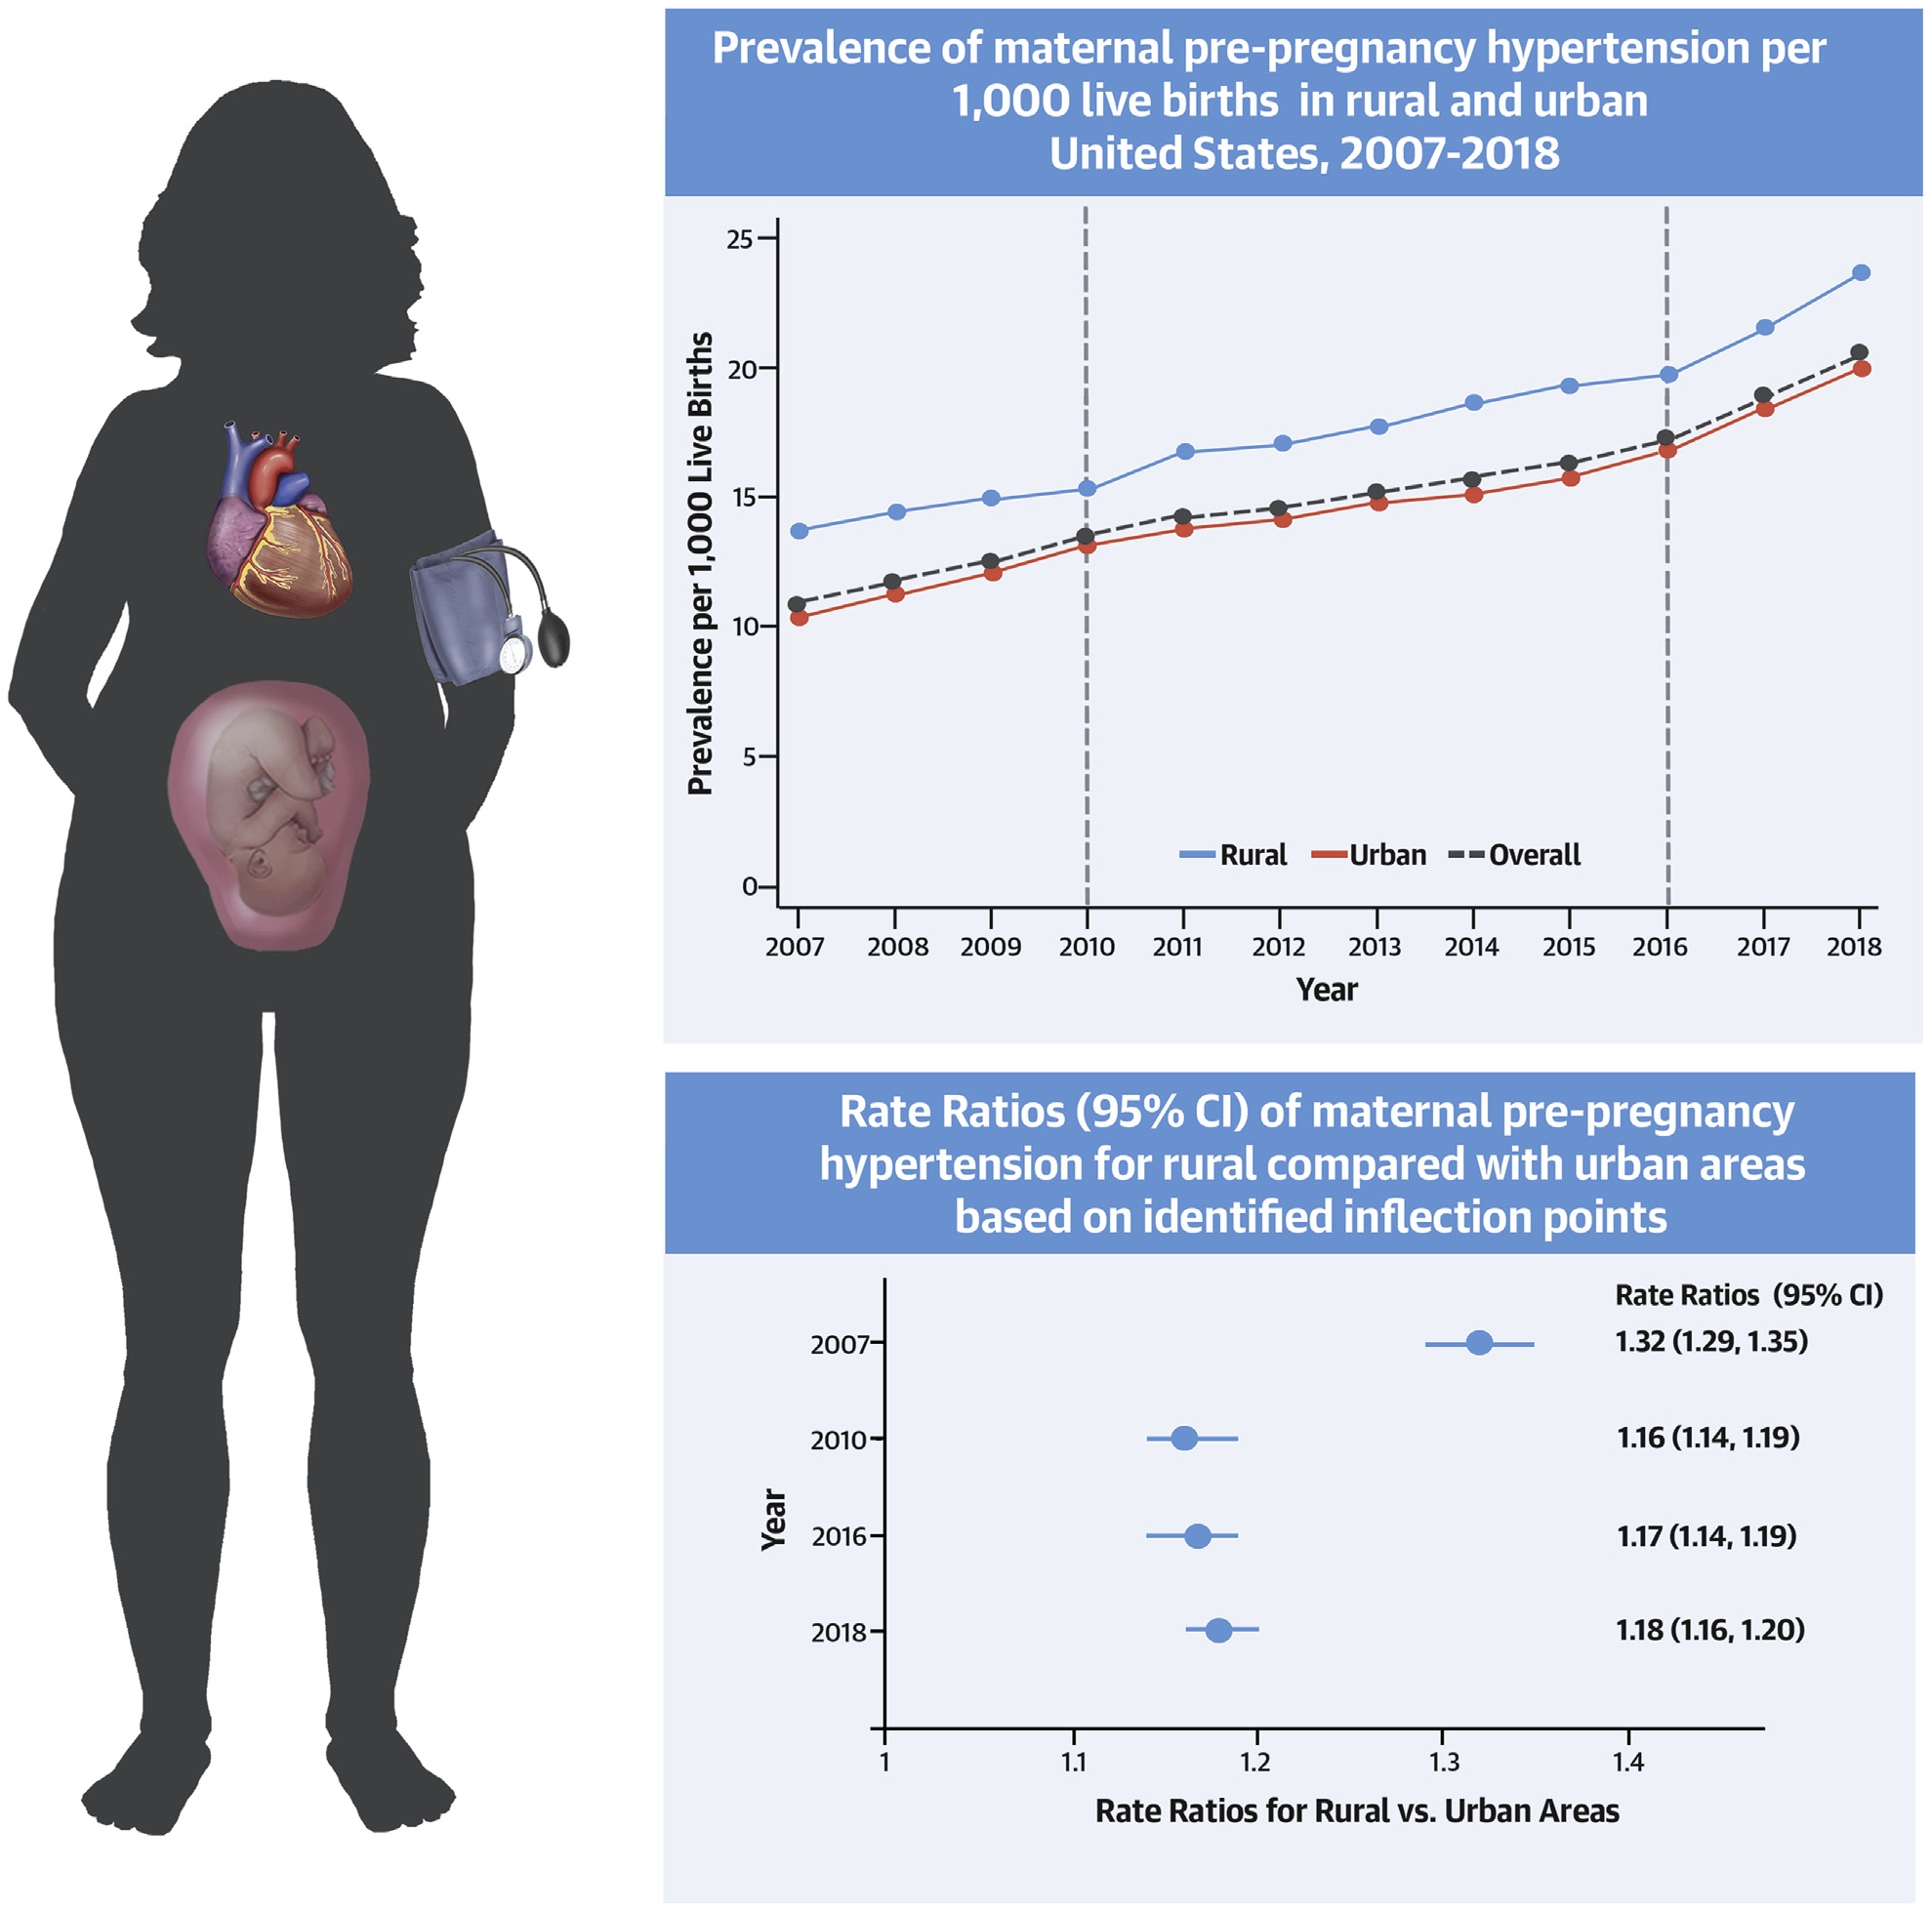
The maternal burden of pre-pregnancy hypertension has nearly doubled in the past decade and significant rural-urban disparities persist.
TABLE 2.
Average Annual Percent Change (95% CI) in the Prevalence of Maternal Pre-Pregnancy Hypertension Overall and Across 3 Periods Based on Identified Inflection Points (2007 to 2010, 2010 to 2016, 2016 to 2018) Stratified by Rural-Urban Status
| Average Annual Percent Change (95% CI) | ||||
|---|---|---|---|---|
| 2007–2018 | 2007–2010 | 2010–2016 | 2016–2018 | |
| Overall | 5.3 (4.8–5.8)* | 7.2 (6.6–7.8)* | 4.0 (3.5–4.4)* | 9.1 (8.0–10.3)* |
| Rural | 4.7 (4.2–5.1)* | 3.7 (2.0–5.6)* | 4.1 (3.3–5.0)* | 9.6 (5.7–13.5)* |
| Urban | 5.4 (4.8–6.0)* | 7.9 (7.4–8.4)* | 4.0 (3.5–4.4)* | 9.0 (7.0–11.2)* |
Indicates that the average annual percent change is significantly different from zero at the alpha = 0.05 level. CI = confidence interval.
TABLE 3.
Rate Ratios (95% CI) of Maternal Pre-Pregnancy Hypertension in Rural Compared With Urban Areas in the United States Stratified by Age in 2007, 2010, 2016, and 2018
| Year | ||||
|---|---|---|---|---|
| 2007 | 2010 | 2016 | 2018 | |
| Overall | 1.32 (1.29–1.35) | 1.16 (1.14–1.19) | 1.17 (1.14–1.19) | 1.18 (1.16–1.20) |
| Age 15–19 yrs | 1.29 (1.15–1.44) | 1.02 (0.90–1.15) | 1.19 (1.05–1.35) | 1.18 (1.04–1.35) |
| Age 20–24 yrs | 1.38 (1.31–1.46) | 1.17 (1.10–1.24) | 1.11 (1.05–1.18) | 1.16 (1.11–1.22) |
| Age 25–29 yrs | 1.53 (1.46–1.60) | 1.31 (1.25–1.37) | 1.29 (1.24–1.34) | 1.23 (1.18–1.27) |
| Age 30–34 yrs | 1.61 (1.54–1.69) | 1.43 (1.37–1.50) | 1.49 (1.43–1.54) | 1.47 (1.42–1.52) |
| Age 35–39 yrs | 1.64 (1.55–1.73) | 1.59 (1.51–1.68) | 1.46 (1.39–1.53) | 1.49 (1.43–1.56) |
| Age 40–44 yrs | 1.58 (1.43–1.75) | 1.42 (1.28–1.57) | 1.37 (1.25–1.50) | 1.51 (1.39–1.64) |
CI = confidence interval.
In our secondary analyses, similar rates and increases in pre-pregnancy hypertension were observed among nulliparous women in urban (16.9 to 20.0) and rural (19.8 to 23.7) areas between 2016 to 2018 compared with all women described in the primary analysis. In addition, the annual percent change in pre-pregnancy hypertension was similar between the years 2016 to 2017 and 2017 to 2018 (Supplemental Table 2).
AGE-SPECIFIC TRENDS IN PRE-PREGNANCY HYPERTENSION.
Age-specific prevalence of pre-pregnancy hypertension was higher in each 5-year older age subgroup in both rural and urban areas, with higher rates among rural compared with urban women (Supplemental Table 1). Similar patterns of change across time were observed within each age group. The greatest annual increases were observed among 20- to 24-year-old women in both rural and urban areas from 2016 to 2018 with APCs of 14.9%/year (95% CI: 12.7% to 17.1%/year) and 12.5%/year (95% CI: 9.1% to 15.9%/year) for rural and urban areas, respectively (Table 4). Rural-urban differences in the age-specific prevalence of pre-pregnancy hypertension persisted over time and were generally greater in older women. For example, the 2018 RRs ranged from 1.18 (95% CI: 1.04 to 1.35) for 15- to 19-year-old women to 1.51 (95% CI: 1.39 to 1.64) for 40- to 44-year-old women (Table 3).
TABLE 4.
Average Annual Percent Change (95% CI) in the Age-Specific Prevalence of Maternal Pre-Pregnancy Hypertension Stratified by Rural-Urban Status Overall and Across 3 Periods Based on Identified Inflection Points (2007–2010, 2010–2016, 2016–2018)
| Average Annual Percent Change (95% CI) | ||||
|---|---|---|---|---|
| 2007–2018 | 2007–2010 | 2010–2016 | 2016–2018 | |
| Age 15–19 yrs | ||||
| Rural | 5.2 (3.6 to 6.8)* | 0.2 (_11.2 to 13.2) | 6.9 (3.3 to 10.6)* | 7.8 (−17.0 to 40.1) |
| Urban | 5.6 (4.8 to 6.4)* | 7.6 (−3.0 to 19.3) | 4.2 (3.7 to 4.7)* | 8.0 (−31.0 to 69.3) |
| Age 20–24 yrs | ||||
| Rural | 4.3 (3.3 to 5.3)* | 3.9 (−0.8 to 8.8) | 3.0 (1.4 to 4.6)* | 14.9 (12.7 to 17.1)* |
| Urban | 5.6 (4.7 to 6.5)* | 8.9 (4.6 to 13.5)* | 3.8 (3.0 to 4.6)* | 12.5 (9.1 to 15.9)* |
| Age 25–29 yrs | ||||
| Rural | 3.0 (2.4 to 3.5)* | 2.0 (−1.2 to 5.4) | 2.3 (1.5 to 3.2)* | 7.6 (6.9 to 8.3)* |
| Urban | 4.5 (3.7 to 5.3)* | 7.6 (6.6 to 8.6)* | 2.6 (1.9 to 3.3)* | 10.3 (4.9 to 15.9)* |
| Age 30–34 yrs | ||||
| Rural | 3.3 (2.9 to 3.8)* | 3.0 (−3.6 to 10.0) | 3.1 (1.8 to 4.4)* | 6.4 (−5.0 to 19.2) |
| Urban | 4.0 (3.4 to 4.6)* | 6.8 (5.7 to 8.0)* | 2.5 (2.0 to 3.1)* | 7.1 (3.2 to 11.1)* |
| Age 35–39 yrs | ||||
| Rural | 3.4 (2.8 to 4.0)* | 5.5 (3.0 to 8.1)* | 2.1 (1.1 to 3.1)* | 7.4 (−9.6 to 27.6) |
| Urban | 4.2 (3.6 to 4.7)* | 6.5 (4.1 to 8.9)* | 2.9 (2.2 to 3.7)* | 6.1 (6.0 to 6.1)* |
| Age 40–44 yrs | ||||
| Rural | 3.2 (2.1 to 4.3)* | 1.6 (−3.0 to 6.4) | 2.6 (−0.7 to 6.0) | 9.5 (−26.0 to 62.2) |
| Urban | 3.9 (3.4 to 4.3)* | 6.0 (1.9 to 10.2)* | 3.0 (2.3 to 3.7)* | 4.5 (−18.0 to 33.2) |
The average annual percent change is significantly different from zero at the alpha = 0.05 level CI = confidence interval.
RACE/ETHNICITY-SPECIFIC TRENDS IN PRE-PREGNANCY HYPERTENSION.
Subgroup analysis among racial/ethnic subgroups (NHW = 25,698,651; NHB = 7,098, 978; and Hispanic/Latinx = 11,283,157) revealed differences in the prevalence, rural-urban disparities, and trends in maternal pre-pregnancy hypertension (Supplemental Tables 3 to 5, Supplemental Figure 1). Rates of pre-pregnancy hypertension per 1,000 live births in both rural and urban women increased from 21.3 to 40.1 for NHBs, from 11.1 to 19.3 for NHWs, and from 5.4 to 13.4 for Hispanic/Latinx from 2007 to 2018 (Supplemental Table 3). Pre-pregnancy hypertension rates were higher in rural compared with urban areas for NHB and NHW women, but were similar for Hispanic/Latinx women (Supplemental Table 3). The greatest annual increase was observed among Hispanic/Latinx urban women between 2016 and 2018 (APC 10.8% [10.0% to 11.5%]) (Supplemental Table 4). Age-specific prevalence of pre-pregnancy hypertension increases over time within each race/ethnicity and age subgroup (Supplemental Figure 1). The RRs for pre-pregnancy hypertension in rural versus urban areas were consistently highest for NHB women in each age group and year, reaching as high as 1.92 (95% CI: 1.61 to 2.29) for 40- to 44-year-old NHB women in 2018 (Supplemental Table 5).
DISCUSSION
We found that the maternal burden of pre-pregnancy hypertension in both rural and urban areas has nearly doubled over the past decade from 2007 to 2018 and complicated nearly 80,000 pregnancies in 2018. Increases in rates of hypertension prior to entering pregnancy in women have accelerated in recent years (2016 to 2018), with estimated annual relative increase as high as 15% on average per year in 20- to 24-year-old women in rural areas. Although the overall rural-urban gap has slightly narrowed, significant disparities persist across the reproductive life course, with an approximately relatively 20% higher pre-pregnancy hypertension rate among women residing in rural compared with urban areas with similar patterns across all age and race/ethnicity subgroups.
Our results confirm and extend prior reports of increasing rates of hypertension among reproductive-aged and pregnant women over the past several decades (9,16,17,26). We found ongoing annual percent increases in pre-pregnancy hypertension that were similar to historical trends between 1970 to 2010 (+6.0%/year) from the National Hospital Discharge Survey (9). Importantly, the reported prevalence may underestimate the total burden of pre-pregnancy hypertension, as data from the National Health and Nutrition Examination Survey identified that nearly 20% of nonpregnant women age 20 to 44 years with hypertension, defined by objective measurement of systolic blood pressure ≥140 mm Hg or diastolic blood pressure ≥90 mm Hg, were unaware of their hypertension status (17). Further, these estimates do not include women with fetal deaths, an event that is known to be associated with pre-pregnancy hypertension (27). Nevertheless, this study population of women with known pre-pregnancy hypertension represents a group for which actionable steps can be taken to optimize management of blood pressure pre-pregnancy, during, and after pregnancy and thereby decrease risks of hypertension-related complications during pregnancy and postpartum (4).
Our analysis further expanded upon previous studies by examining inflection points in trends over time. We found an acceleration in pre-pregnancy hypertension from 2016 to 2018 in all age groups, particularly among young women (20 to 24 years of age), in both rural and urban communities. These results indicate that advanced maternal age does not fully explain the rise in pre-pregnancy hypertension rates. Significant increases in the prevalence of obesity, a major risk factor for hypertension (28), may be a more likely culprit. National estimates report that the frequency of a normal body mass index pre-pregnancy was as low as 45.0% in 2015 among women with live births (29). Other measures of cardiovascular health that may contribute to increasing rates of pre-pregnancy hypertension include poor maternal diet quality and higher rates of sedentary behavior (30). In fact, between 1999 and 2012, fewer than 10% of pregnant women in the United States met criteria for optimal metrics of cardiovascular health (AHA’s Life Simple 7), which incorporates health behaviors and risk factors (30).
We also newly describe disparities in rates of pre-pregnancy hypertension by urbanization status, with women in rural communities having 20% to 60% higher rate of pre-pregnancy hypertension than their age-matched urban counterparts. When race/ethnicity was also considered, NHB women in rural areas were 2 and 3 times more likely to have pre-pregnancy hypertension than NHBs and NHW women in urban areas, respectively, which points to root causes of Black-White disparities such as structural and systemic racism as a key contributor. Our findings in pregnant women are consistent with previous studies in the general adult population describing worse blood pressure control and metabolic health in rural compared with urban communities (12,31,32), as well as higher prevalence of hypertension among NHBs compared with NHWs (16,17). Multiple factors may contribute to the rural-urban gap in pre-pregnancy hypertension, including differences in risk factor levels (obesity and tobacco use) as well as upstream social determinants of health (e.g., poverty rates, access to care, education and health literacy, food insecurity) (12,13,31,32). In particular, adverse maternal outcomes among women with pre-pregnancy hypertension in rural communities may be further amplified by significant declines observed in access to obstetric services in recent years, with 45% of rural counties lacking obstetrics units (33). NHB women in the aforementioned study were the most likely to lack access to obstetric services, which may partially explain the large rural-urban disparities in pre-pregnancy cardiometabolic health noted in our study.
Rural-urban disparities in health have led both the AHA and the American College of Obstetricians and Gynecologists to publish statements targeting health improvements in rural communities (13,34). These groups advocate for collaborating with rural health agencies to identify barriers to care, increasing the number of rural physicians, expanding telehealth, and widening insurance coverage. Interventions based on these recommendations that target pre-pregnancy hypertension are necessary to improve maternal and offspring health and reduce mortality given growing numbers of women entering pregnancy with suboptimal cardiovascular health, even at young ages (<24 years). The Centers for Medicare and Medicaid Services brief on “Improving Access to Maternal Health Care in Rural Communities” emphasizes the importance of national, state, and community-based strategies to improve access to maternal health care and optimize pre-pregnancy health (35). One example is the Improving Access to Maternity Care Act, which will send obstetricians and gynecologists to areas in the United States with the greatest needs. Additional strategies include extending Medicaid coverage beyond the postpartum period, utilizing telehealth to provide care to rural communities, and implementing rural training programs for physicians. Lessons learned from global interventional trials suggest that multilevel approaches are likely needed to make meaningful impacts on maternal health. In the CLIP (Community Level Intervention for Pre-Eclampsia) trial in India, neither maternal nor newborn morbidity and mortality were reduced despite the introduction of health care workers to communities in need (36). The authors hypothesized that reform at the health care facility level was also required to impact maternal and newborn health. In addition to systems-level reform, increased provider awareness and screening for elevated blood pressure, especially in young women prior to conception, could prevent the development of hypertension-related complications during pregnancy and postpartum. Furthermore, with recognition and awareness of elevated blood pressures before or during pregnancy, providers can initiate appropriate intervention with low-dose aspirin therapy when indicated, which has well-established benefits for pregnancy and fetal outcomes in women with hypertension (37).
STUDY STRENGTHS AND LIMITATIONS.
Strengths of this study include the use of data from the National Center for Health Statistics CDC WONDER Natality online tool, which is the largest source of high-quality vital statistics data, recording all live births in the United States to U.S. residents. The large sample size encompassing over a decade allowed for age-, place-, and race/ethnicity-specific estimates. Use of Joinpoint analysis also allowed us to precisely quantify annual changes and recognize inflection points in pre-pregnancy hypertension over time in each subgroup.
Limitations associated with use of the publicly available Natality Database based on birth certificate registration include the potential for miscoding or lack of awareness of pre-pregnancy diagnosis of hypertension. However, registration of births and associated maternal health data are completed by the professional birth attendant (e.g., physician or midwife) using all available data sources. Furthermore, because this was a serial cross-sectional study, repeat pregnancies resulting in live births to the same woman were included in estimating annual rates. However, our secondary analysis using available data from nulliparous women from 2016 to 2018 revealed similar prevalences and trends in pre-pregnancy hypertension over time compared with the primary results from all live births to women included in our study. This suggests that the temporal increases in pre-pregnancy hypertension observed among women in the main analysis were unlikely due to repeat measures from the same person. Another limitation is that we were unable to include meaningful analyses of some races/ethnicity subgroups (e.g., Asian/Pacific Islanders) due to small sample sizes. Nevertheless, we were able to analyze rural and urban disparities in pre-pregnancy hypertension among the 3 most prevalent racial/ethnic groups within the United States. In addition, lack of data on physical activity, diet, cholesterol, pre-pregnancy body mass index, pre-pregnancy diabetes, and history of autoimmune disease across the full study period should be noted as these factors could potentially be associated with changing trends in pre-pregnancy hypertension. Although we were not able to adjust for the contribution of prior preeclampsia to the subsequent development of pre-pregnancy hypertension in the primary analysis, our sensitivity analysis in nulliparous women between 2016 and 2018 suggests similar trends in pre-pregnancy hypertension. Despite these limitations, the CDC WONDER Natality database is unique in its ability to provide data on national trends on key maternal risk factors, such as pre-pregnancy hypertension.
It is also possible that changes to the American College of Cardiology/AHA hypertension guidelines recommending use of a lower systolic and diastolic blood pressure threshold for the diagnosis of hypertension in 2017 (22) may have affected our trends analysis. However, our sensitivity analysis examining annual percentage change between 2016 to 2017 and 2017 to 2018 demonstrated similar findings. Therefore, it is unlikely that the updated guidelines significantly affected the patterns observed in pre-pregnancy hypertension among rural and urban women in this analysis.
Given these concerning trends in pre-pregnancy hypertension, future work is needed to quantify temporal changes in related maternal cardiovascular risk factors including obesity, diabetes, and dyslipidemia, and examine associations with trends in pre-pregnancy hypertension. Additional research is also necessary to translate the impact of changes in pre-pregnancy hypertension on maternal and fetal morbidity and mortality. Finally, it is important to quantify maternal cardiovascular health disparities among women from other racial/ethnic backgrounds such as disaggregated Asian subgroups.
CONCLUSIONS
The maternal burden of pre-pregnancy hypertension has nearly doubled in the past decade, and significant rural-urban disparities persist and amplify pervasive Black-White disparities. These data highlight the importance of strengthening individual and community-level prevention strategies and systems of care focused on pre-conception screening and management to improve maternal and offspring cardiovascular health and outcomes.
Supplementary Material
PERSPECTIVES.
COMPETENCY IN MEDICAL KNOWLEDGE:
The prevalence of pre-pregnancy hypertension among women in the United States nearly doubled during the past decade, and the upward trend has been accelerating, amplified by rural-urban and pervasive racial disparities.
TRANSLATIONAL OUTLOOK:
Individual and community-level prevention strategies and systems of care focused on pre-conception screening and management are needed to improve maternal and offspring cardiovascular health.
Acknowledgments
This study has been supported by grants from the National Institutes of Health/National Heart, Lung, and Blood Institute (KL2TR001424 to Dr. Khan and K23HL14510102 to Dr. Perak), and the American Heart Association (#19TPA34890060 to Dr. Khan). Research reported in this publication was supported, in part, by the National Institutes of Health’s National Center for Advancing Translational Sciences, Grant Number KL2TR001424. The funding sponsor did not contribute to the design and conduct of the study, collection, management, analysis, or interpretation of the data or preparation, review, or approval of the manuscript. The content is solely the responsibility of the authors and does not necessarily represent the official views of the National Institutes of Health.
ABBREVIATIONS AND ACRONYMS
- AHA
American Heart Association
- APC
average annual percentage change
- CDC
Centers for Disease Control
- CVD
cardiovascular disease
- NHB
non-Hispanic Black
- NHW
non-Hispanic White
- RR
rate ratio
Footnotes
APPENDIX For supplemental tables and a figure, please see the online version of this paper.
REFERENCES
- 1.Hirshberg A, Srinivas SK. Epidemiology of maternal morbidity and mortality. Semin Perinatol 2017;41:332–7. [DOI] [PubMed] [Google Scholar]
- 2.Rossen LM, Womanck LS, Hoyert DL, Anderson R, Uddin S. The impact of pregnancy checkbox and misclassification on maternal mortality trends in the United States, 1999–2017. Natl Cent Heal Stat Vital Heal Stat 2020;3:1999–2017. [PubMed] [Google Scholar]
- 3.Lane-Cordova AD, Khan SS, Grobman WA, Greenland P, Shah SJ. Long-term cardiovascular risks associated with adverse pregnancy outcomes: JACC review topic of the week. J Am Coll Cardiol 2019;73:2106–16. [DOI] [PubMed] [Google Scholar]
- 4.Bramham K, Parnell B, Nelson-Piercy C, Seed PT, Poston L, Chappell LC. Chronic hypertension and pregnancy outcomes: systematic review and meta-analysis. BMJ 2014;348:1–20. [DOI] [PMC free article] [PubMed] [Google Scholar]
- 5.Davis EF, Lewandowski AJ, Aye C, et al. Clinical cardiovascular risk during young adulthood in offspring of hypertensive pregnancies: Insights from a 20-year prospective follow-up birth cohort. BMJ Open 2015;5:1–8. [DOI] [PMC free article] [PubMed] [Google Scholar]
- 6.Sibai BM. Chronic hypertension in pregnancy. Obstet Gynecol 2002;100:369–77. [DOI] [PubMed] [Google Scholar]
- 7.Reddy M, Rolnik DL, Harris K, et al. Challenging the definition of hypertension in pregnancy: a retrospective cohort study. Am J Obstet Gynecol 2020;222:606.e1–21. [DOI] [PubMed] [Google Scholar]
- 8.Sutton EF, Hauspurg A, Caritis SN, Powers RW, Catov JM. Maternal outcomes associated with lower-range stage 1 hypertension. Physiol Behav 2016;176:139–48. [DOI] [PMC free article] [PubMed] [Google Scholar]
- 9.Ananth CV, Duzyj CM, Yadava S, Schwebel M, Tita ATN, Joseph KS. Changes in the prevalence of chronic hypertension in pregnancy, United States, 1970 to 2010. Hypertension 2019;74:1089–95. [DOI] [PubMed] [Google Scholar]
- 10.Brown HL, Warner JJ, Gianos E, et al. Promoting risk identification and reduction of cardiovascular disease in women through collaboration with obstetricians and gynecologists: a presidential advisory from the American Heart Association and the American college of obstetricians and gynecologi. Circulation 2018; 137:e843–52. [DOI] [PubMed] [Google Scholar]
- 11.Mehta LS, Warnes CA, Bradley E, et al. Cardiovascular considerations in caring for pregnant patients: a scientific statement from the American Heart Association. Circulation 2020;141: e884–903. [DOI] [PubMed] [Google Scholar]
- 12.Cosby AG, Maya McDoom-Echebiri M, James W, Khandekar H, Brown W, Hanna HL. Growth and persistence of place-based mortality in the United States: the rural mortality penalty. Am J Public Health 2019;109:155–62. [DOI] [PMC free article] [PubMed] [Google Scholar]
- 13.Harrington RA, Califf RM, Balamurugan A, et al. Call to action: rural health: a presidential advisory from the american heart association and american stroke association. Circulation 2020: E615–44. [DOI] [PubMed] [Google Scholar]
- 14.Hansen A, Moloney M. Pregnancy-related mortality and severe maternal morbidity in rural appalachia: established risks and the need to know more. J Rural Heal 2020;36:3–8. [DOI] [PubMed] [Google Scholar]
- 15.Kozhimannil KB, Interrante JD, Henning-Smith C, Admon LK. Rural-urban differences in severe maternal morbidity and mortality in the US, 2007–15. Health Aff (Millwood) 2019;38:2077–85. [DOI] [PubMed] [Google Scholar]
- 16.Bornstein E, Eliner Y, Chervenak FA, Grünebaum A. Racial disparity in pregnancy risks and complications in the US: temporal changes during 2007–2018. J Clin Med 2020;9:1414. [DOI] [PMC free article] [PubMed] [Google Scholar]
- 17.Azeez O, Kulkarni A, Kuklina EV, Kim SY, Cox S. Hypertension and diabetes in non-pregnant women of reproductive age in the United States. Prev Chronic Dis 2019;16:1–9. [DOI] [PMC free article] [PubMed] [Google Scholar]
- 18.U.S. Centers for Disease Control and Prevention. CDC WONDER Online Database. About Natality, 1995–2002. Available at: https://wonder.cdc.gov/natality.html. Published 2019.
- 19.Ingram D, Franco S. 2013 NCHS urban–rural classification scheme for counties. National Center for Health Statistics. Vital Heal Stat 2014;2: 1–73. [PubMed] [Google Scholar]
- 20.Kim HJ, Fay MP, Feuer EJ, Midthune DN. Permutation tests for joinpoint regression with applications to cancer rates [published correction Stat Med 2001;20:655. Stat Med 2000;19(335): 1–73. [DOI] [PubMed] [Google Scholar]
- 21.Statistical Methodology and Applications Branch, Surveillance Research Program, National Cancer Institute . Joinpoint Regression Program, Version 4.8.0.1; April 2020.
- 22.Whelton PK, Carey RM, Aronow WS, et al. 2017 ACC/AHA/AAPA/ABC/ACPM/AGS/APhA/ASH/ASPC/NMA/PCNA guideline for the prevention, detection, evaluation, and management of high blood pressure in adults a report of the American College of Cardiology/American Heart Association Task Force on Clinical Preventino. J Am Coll Cardiol 2018;71:e127–248. [DOI] [PubMed] [Google Scholar]
- 23.Rothman K, Greenland S, Lash T. Modern Epidemiology. 3rd edition Philadelphia: Lippincott Williams & Wilkins, 2008. [Google Scholar]
- 24.Suthar AB, Lawn SD, del Amo J, et al. Antiretroviral therapy for prevention of tuberculosis in adults with HIV: a systematic review and meta-analysis. PLoS Med 2012;9:e1001270. [DOI] [PMC free article] [PubMed] [Google Scholar]
- 25.StataCorp. Stata Statistical Software: Release 14. College Station, TX: StataCorp LP, 2015. [Google Scholar]
- 26.Bateman BT, Shaw KM, Kuklina EV, Callaghan WM, Seely EW, Hernández-Díaz S. Hypertension in women of reproductive age in the United States: NHANES 1999–2008. PLoS One 2012;7:e36171. [DOI] [PMC free article] [PubMed] [Google Scholar]
- 27.Patel EM, Goodnight WH, James AH, Grotegut CA. Temporal trends in maternal medical conditions and stillbirth. Am J Obstet Gynecol 2015;212:673.e1–11. [DOI] [PubMed] [Google Scholar]
- 28.Landsberg L, Aronne LJ, Beilin LJ, et al. Obesity-related hypertension: pathogenesis, cardiovascular risk, and treatment: a position paper of the Obesity Society and the American Society of Hypertension. J Clin Hypertens 2013;15:14–33. [DOI] [PMC free article] [PubMed] [Google Scholar]
- 29.Deputy NP, Dub B, Sharma AJ. Prevalence and trends in prepregnancy normal weight—48 States, New York City, and District of Columbia, 2011–2015. Morb Mortal Wkly Rep 2018;66:1402–7. [DOI] [PMC free article] [PubMed] [Google Scholar]
- 30.Perak AM, Ning H, Khan SS, Van Horn LV, Grobman WA, Lloyd-Jones DM. Cardiovascular health among pregnant women, aged 20 to 44 years, in the United States. J Am Heart Assoc 2020;9:1–20. [DOI] [PMC free article] [PubMed] [Google Scholar]
- 31.Mainous AG, King DE, Garrr DR, Pearson WS. Race, rural residence, and control of diabetes and hypertension. Ann Fam Med 2004;2:563–8. [DOI] [PMC free article] [PubMed] [Google Scholar]
- 32.O’Connor A, Wellenius G. Rural-urban disparities in the prevalence of diabetes and coronary heart disease. Public Health 2012;126:813–20. [DOI] [PubMed] [Google Scholar]
- 33.Hung P, Henning-Smith CE, Casey MM, Kozhimannil KB. Access to obstetric services in rural counties still declining, with 9 percent losing services, 2004–14. Health Aff 2017;36:1663–71. [DOI] [PubMed] [Google Scholar]
- 34.The American College of Obstetricians and Gynecologists. Committee opionion: health disparities in rural women. Obstet Gynecol 2014;123: 384–8. [DOI] [PubMed] [Google Scholar]
- 35.Centers for Medicare and Medicaid Services. Improving Access to Maternal Health Care in Rural Communities: An Issue Brief. Available at: https://www.cms.gov/About-CMS/Agency-Information/OMH/equity-initiatives/rural-health/09032019-Maternal-Health-Care-in-Rural-Communities.pdf. Accessed October 5, 2020.
- 36.Bellad MB, Goudar SS, Mallapur AA, et al. Community level interventions for pre-eclampsia (CLIP) in India: a cluster randomised controlled trial. Pregnancy Hypertens 2020;21:166–75. [DOI] [PMC free article] [PubMed] [Google Scholar]
- 37.Hauspurg A, Sutton EF, Catov JM, Caritis SN. Aspirin effect on adverse pregnancy outcomes associated with stage 1 hypertension in a high-risk cohort. Hypertension 2018;72:202–7. [DOI] [PMC free article] [PubMed] [Google Scholar]
Associated Data
This section collects any data citations, data availability statements, or supplementary materials included in this article.