

Abstract
CD4+ T cells undergo immunometabolic activation to mount an immunogenic response during experimental autoimmune myocarditis (EAM). Exosomes are considered key messengers mediating multiple T cell functions in autoimmune responses. However, the role of circulating exosomes in EAM immunopathogenesis and CD4+ T cell dysfunction remains elusive. Our objective was to elucidate the mechanism of action for circulating exosomes in EAM pathogenesis. We found that serum exosomes harvested from EAM mice induced CD4+ T cell immunometabolic dysfunction. Treatment with the exosome inhibitor GW4869 protected mice from developing EAM, underlying that exosomes are indispensable for the pathogenesis of EAM. Furthermore, by transfer of EAM exosomes, we confirmed that circulating exosomes initiate the T cell pathological immune response, driving the EAM pathological process. Mechanistically, EAM-circulating exosomes selectively loaded abundant microRNA (miR)-142. We confirmed methyl-CpG binding domain protein 2 (MBD2) and suppressor of cytokine signaling 1 (SOCS1) as functional target genes of miR-142. The miR-142/MBD2/MYC and miR-142/SOCS1 communication axes are critical to exosome-mediated immunometabolic turbulence. Moreover, the in vivo injection of the miR-142 inhibitor alleviated cardiac injury in EAM mice. This effect was abrogated by pretreatment with EAM exosomes. Collectively, our results indicate a newly endogenous mechanism whereby circulating exosomes regulate CD4+ T cell immunometabolic dysfunction and EAM pathogenesis via cargo miR-142.
Keywords: exosomes, experimental autoimmune myocarditis, glycolysis, miR-142
Graphical Abstract
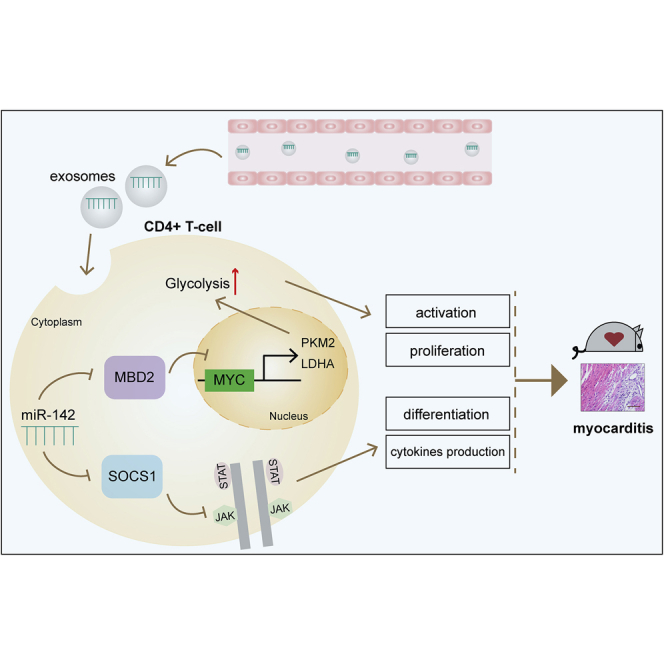
Circulating exosomes from EAM mice can be internalized by CD4+ T cells and induce immunometabolic reprogramming. Furthermore, they can serve as profound and sustained promoters to facilitate EAM progression. Specifically, the selectively loaded content in exosomes, namely miR-142, directly suppresses MBD2 and SOCS1, leading to activated CD4+ T cell immune responses.
Introduction
Myocarditis, characterized by inflammatory infiltration into cardiac muscle, can eventually result in end-stage heart failure.1,2 The T cell-mediated adaptive immune response is linked to different cardiovascular diseases, especially to classic inflammatory disorders such as myocarditis.3,4 Strong evidence suggests that the autoimmune response, mediated by the activation of CD4+ T cells, is an immunological hallmark of experimental autoimmune myocarditis (EAM), similar to that in human myocarditis.5,6 Newly discovered metabolic reprogramming plays a pivotal role in T cell-related autoimmune diseases.7 Notably, activated CD4+ T cells switch to a glycolytic metabolism to adapt to inflammatory effector functions.8 Glycolytic metabolic reprogramming is recognized as the governor of cellular function and T cell fate, thereby shaping an activated immune status.9,10 Previous studies have demonstrated that glycolytic metabolic reprogramming is essential for EAM-induced cardiac remodeling.11 Furthermore, the T cell immunological and metabolic status is associated with the course of EAM progression.11, 12, 13, 14
Recently, the critical involvement of cell-cell communication has been suggested in a variety of pathophysiological processes, resulting in novel interventional targets.15 Exosomes are one example of this. Exosomes are secreted into circulation, delivered to target cells, and act as regulatory elements for immune manipulation.16,17 Therefore, peripheral circulating exosomes have emerged as key mediators of several pathogenic immune responses. It has been reported that extracellular vesicles released from the infarcted heart shape the local inflammatory microenvironment.18 Moreover, exosomes serve as messengers to mediate multiple T cell functions during autoimmune responses.19, 20, 21 Given the fact that circulating exosomes reflect the immunological condition of the individual, there is a crucial need to explore the functional effects of myocarditis-derived exosomes, especially the role of exosomes in the myocarditis-associated autoimmune responses.
Exosomes are 30 to 150 nm membrane vesicles containing a variety of biomolecules (lipids, proteins, mRNAs, and microRNAs [miRNAs]), with specific functions that can be delivered to recipient cells through systemic circulation.22 Notably, exosomally transferred miRNAs have emerged as key mediators of cell functions, active autoimmune responses, and disease progression.23 Gene regulation with exosomes, in which extrinsic miRNAs are transferred to target cells, can manipulate metabolism and the immune response.24, 25, 26 Although certain specific miRNAs have been shown to be dysregulated when EAM immune disruptions exist,27,28 whether extracellular vesicles carrying miRNAs participate in CD4+ T cell immunometabolic dysfunction, as well as EAM progression, has not been studied. In the present study, we elucidated that circulating exosomes mediate T cell immunometabolic reprogramming as a novel mechanism underlying EAM pathogenesis. Our study also shows that circulating exosomes deliver the cargo microRNA (miR)-142 to CD4+ T cells, which is involved in cellular metabolism and immune activation to promote EAM progression.
Results
Serum Exosomes from EAM Mice Induce CD4+ T Cell Dysfunction and Glycolytic Reprogramming In Vitro
Exosomes were isolated from the serum of control mice (Con-Exo) and EAM mice (EAM-Exo) using a standard protocol of serial centrifugation (Figure 1A). With the use of transmission electron microscopy (TEM), we observed approximately spherical particles with diameters of 30–150 nm in isolated fractions (Figure 1B). Western blot analysis verified the expression of exosome protein markers (Alix, CD63, and TSG101). The isolated particles were negative for contaminant markers, such as Calnexin and ApoA1 expression (Figure 1C). Furthermore, we identified the size-distribution profiles of these vesicles through nanoparticle tracking analysis (NTA), and no difference in peak diameters between the two groups was seen (Figure 1D). Additionally, no significant differences were observed between Con-Exo and EAM-Exo concentrations in the serum (Figure S1A).
Figure 1.

Characterization and Functional Validation of Serum Exosomes from Mice with Experimental Autoimmune Myocarditis (EAM) and Controls
(A) Exosomes were isolated from the serum of mice subjected to complete Freund’s adjuvant (CFA) and PBS without MyHC-α stimulation (control group, Con-Exo) or those immunized with MyHC-α (EAM-Exo). (B) Representative electron micrograph of isolated exosomes. Scale bar, 100 nm. (C) Representative blots of exosomal marker proteins (Alix, CD63, TSG101) and contamination proteins (Calnexin, ApoA1) in exosomes purified from the serum of EAM mice and those of the control group. CD4+ T cell lysates were used as a control for Alix, CD63, TSG101, and Calnexin, whereas cell lysates containing recombinant ApoA1 were used as a control for ApoA1. (D) Representative results of nanoparticle tracking analysis demonstrating size distributions of exosomes. (E and F) CD4+ T cells were cultured in the presence or absence (control) of PKH67-labeled exosomes (green). (E) CD4+ T cells incubated with PKH67-labeled exosomes for indicated times were analyzed by flow cytometry for exosome uptake. (F) After 24 h, the uptake of exosomes was confirmed by confocal imaging. Nuclei were stained with DAPI (blue). Scale bars, 20 μm. (G) CD25 and CD69 expression on CD4+ T cells treated with PBS, Con-Exo, or EAM-Exo. (H) Proliferation of T cells, as measured by BrdU, following stimulation with anti-CD3/CD28 antibodies. (I) The numbers of Th1 (CD4+ IFN-γ+), Th17 (CD4+ IL-17A+), and Treg (CD4+ Foxp3+) were assessed by flow cytometry. (J) The percentages of Th1, Th17, and Treg were measured. (K) The levels of cytokines, including IFN-γ, IL-17A, and IL-10 in CD4+ T cells, were measured by ELISA. (L) The extracellular acidification rate (ECAR) was measured over time from basal levels and followed by glucose, oligomycin (Olig), and 2-deoxy-D-glucose (2-DG) addition. Basal ECAR, glycolytic capacity, and glycolytic reserve levels were calculated. (M) Cellular glucose uptake and lactate production were measured after exosome addition. Data are presented as the means ± SEM (n = 6); ∗p < 0.05.
We focused on the effect of exosomes on CD4+ T cells with respect to their critical functions during EAM pathogenesis. When exosomes labeled with the fluorescent dye PKH67 were incubated with CD4+ T cells for 24 h, >90% of the CD4+ T cells were positive for PKH67 fluorescence. The internalization of Con-Exo and EAM-Exo in CD4+ T cells showed no difference (Figure 1E). Meanwhile, confocal images confirmed that exosomes were efficiently internalized by CD4+ T cells (Figure 1F). Then we incubated PKH67-labeled exosomes with CD4+ T cells from EAM mice or the control group. Also, the internalization of the exosomes in T cells showed no differences, as measured by flow cytometry (Figure S1B).
To investigate the role of EAM-circulating exosomes in activating CD4+ T cell functions, we incubated exosomes with CD4+ T cells for 24 h and stimulated them with anti-CD3/CD28 antibodies to perform a series of assays in vitro. We observed that T cell activation markers (CD25 and CD69) were increased after incubation with EAM-Exo compared to the corresponding levels after phosphate-buffered saline (PBS) or Con-Exo treatment. Conversely, treatment with Con-Exo failed to induce CD4+ T cell activation responses (Figure 1G). Based on bromodeoxyuridine (BrdU) incorporation, we demonstrated increased cell proliferation with EAM-Exo treatment (Figure 1H). Flow cytometry revealed a considerable increase in T helper 1 (Th1) cells (calculated based on CD4+ interferon [IFN]+ proportions) and Th17 cells (calculated based on CD4+ interleukin [IL]-17A+ proportions) and a decrease in the proportions of T regulatory (Treg) cells (calculated based on CD4+ Foxp3+ proportions) in the EAM-Exo group (Figures 1I and 1J). Moreover, enzyme-linked immunosorbent assay (ELISA) revealed higher production of the proinflammatory cytokines IFN-γ and IL-17A and a decrease in the level of anti-inflammatory cytokine IL-10 in the EAM-Exo samples (Figure 1K).
The metabolism of CD4+ T cells is altered to meet energy requirements based on cellular functions. We utilized a Seahorse Bioscience extracellular flux (XF) analyzer and measured the real-time extracellular acidification rate (ECAR) to evaluate the glycolytic ability of T cells in response to exosomes. According to the basal ECAR, glycolytic capacity, and glycolytic reserve, treatment with EAM-Exo significantly increased the ECAR in T cells (Figure 1L). Furthermore, increases in glucose uptake and lactate production were observed in the EAM-Exo group, indicating robust enhancement of glycolysis in CD4+ T cells (Figure 1M). Collectively, these data indicate that circulating exosomes activate CD4+ T cell functions and induce glycolytic reprogramming in vitro.
Circulating Exosomes Are Indispensable for the Progression of EAM
To further investigate the role of exosomes in EAM progression, we intraperitoneally injected GW4869, an inhibitor of exosome release, and generated an EAM model. Notably, NTA revealed that GW4869 treatment effectively inhibited exosome secretion (Figures S2A and S2B). We observed that heart-to-body weight (HW/BW) was reduced in EAM mice after treatment with GW4869 (Figure 2A). Hematoxylin and eosin (H&E) staining further indicated that exosome inhibition alleviated EAM cardiac damage (Figure 2B). Histological scores and serum troponin (TnI) levels were also decreased in EAM mice treated with GW4869 (Figures 2C and 2D). Meanwhile, the percentage of CD4+ cells was significantly decreased in EAM mice after GW4869 administration (Figures 2E and 2F). Moreover, echocardiographic analysis showed that exosome inhibition reversed cardiac dysfunction in EAM mice (Figures 2G–2K). Serum IFN-γ and IL-17A levels were significantly reduced after exosomes inhibition, whereas IL-10 levels were increased (Figure S2C). Then we assessed CD4+ T cell subpopulations in mice heart tissues using flow cytometry. A considerable decrease in cardiac Th1, Th17, and Treg cells was observed in EAM mice after GW4869 treatment, indicating that the inhibition of exosomes suppressed the CD4+ T cell immune response (Figures S2D–S2G). However, there were no significant differences in the histological progression and T cell functions between control mice and those pretreated with GW4869 (Figures 2A–2K and S2C–S2G). Therefore, exosome inhibition hindered EAM development. Circulating exosomes participated in the progression of EAM.
Figure 2.

Measurement of Cardiac Pathological and Structural Alterations after GW4869 Treatment
(A) Heart-to-body weight (HW/BW) ratios were measured on day 21. (B) Cardiac tissue H&E staining was performed (scale bars, 100 μm). (C). The H&E images were analyzed based on histological grades. (D) Serum cardiac troponin I was determined by ELISA. (E and F) CD4+ cell infiltration in the cardiac sections was analyzed by immunohistochemistry (scale bars, 100 μm). (G) Cardiac M-mode echocardiographic images are displayed. (H–K) Left ventricular ejection fractions (EFs; H), left ventricular end-diastolic dimension (LVEDD; I), left ventricular end-systolic dimension (LVESD; J), and LV fractional shortening (FS; K) were measured in respective groups. Data are presented as the means ± SEM (n = 6); ∗p < 0.05.
The Injection of EAM Exosomes Induces Global CD4+ T Cell Activation and Cardiac Inflammation in Mice
To explore whether circulating exosomes directly target CD4+ T cells and mediate cardiac impairment, equal amounts of exosomes isolated from EAM or control mice were intravenously injected into naive mice weekly (Figure 3A). We performed noninvasive florescence imaging using PKH67 dye to track the distribution of exosomes at the indicated time points. Ex vivo fluorescence signals were significantly detected in the spleen and liver in both groups after the first injection. In the EAM-Exo group, fluorescence signals were obviously accumulated in the heart after the third injection (Figure S3A). Then the heart tissue was harvested to determine whether exosomes were internalized in cardiac CD4+ T cells. Confocal imaging showed that CD4 and PKH67 were coexpressed in mice hearts, confirming the uptake of exosomes in cardiac CD4+ T cells (Figure 3B).
Figure 3.

Measurement of CD4+ T Cell Immunometabolic Status and Cardiac Pathology after Exosomes Injection
(A) Injection schedule. BALB/C mice were injected with control exosomes (Con-Exos), EAM-Exo, or PBS on days 0, 7, and 14. Mice were sacrificed on day 21. (B) Purified exosomes or equal PBS were labeled with the green membrane dye PKH67 and injected into mice via the tail vein; the heart tissue was collected 12 h after the third injection (scale bar, 100 μm). The frozen heart sections were stained with CD4 antibody (red) and DAPI (blue). (C) Cardiac tissue H&E staining was performed on day 21 (scale bars, 100 μm). (D) The H&E images were analyzed based on histological grades. (E) CD4+ cell infiltration in the cardiac sections was analyzed by immunohistochemistry (scale bars, 100 μm). (F) The percentages of CD4+ cells were enumerated. (G) Cardiac M-mode echocardiographic images are displayed. (H) Left ventricular EFs and LVEDD were measured in respective groups. (I–N) Mouse splenic CD4+ T cells were isolated and sorted after exosome injection. (I) Activation markers, including CD25 and CD69, were measured by flow cytometry. (J) CD4+ T cell proliferation was assessed based on BrdU incorporation. (K) The numbers of Th1 (CD4+ IFN-γ+), Th17 (CD4+ IL-17A+), and Treg (CD4+ Foxp3+) were assessed by flow cytometry. (L) The percentages of Th1, Th17, and Treg were measured. (M) The ECAR was measured over time from basal levels and followed by glucose, Olig, and 2-DG addition. (N) Basal ECAR, glycolytic capacity, and glycolytic reserve levels were calculated. Data are presented as the means ± SEM (n = 6); ∗p < 0.05.
To explore whether EAM-circulating exosomes mediate cardiac inflammation and injury, we performed serial histological analyses and echocardiographic assessments. On day 21 post exosomes injection, intriguingly, gravimetric analysis of HW/BW showed a higher value in mice treated with EAM-Exo than in the PBS or Con-Exo group (Figure S3B). H&E staining indicated a remarkable increase in inflammatory cell infiltration in the EAM-Exo group (Figure 3C). Similarly, histological scores were significantly higher in mice injected with EAM-Exo (Figure 3D). Further, immunohistochemical analysis showed that EAM exosomes increased CD4+ cell infiltration in mouse heart tissue (Figures 3E and 3F). Echocardiographic analysis indicated that left ventricular function was significantly impaired in mice pretreated with EAM-Exo based on measurements of left ventricular ejection fractions (EFs) and left ventricular end-diastolic dimension (LVEDD) (Figures 3G and 3H). These results demonstrated that circulating exosomes can efficiently mediate cardiac inflammation and functional impairment.
To clarify whether exosomes treatment led to CD4+ T cells dysfunction in vivo, on day 21, we sorted splenic and cardiac CD4+ T cells and stimulated them with anti-CD3/CD28 for subsequent analysis. As anticipated, we observed increased CD25 and CD69 expression (Figure 3I), proliferation (Figure 3J), and Th1 and Th17 cell proportion in splenic CD4+ T cells sorted from EAM-Exo-pretreated mice. In contrast, Treg cells were reduced after EAM-Exo injection (Figures 3K and 3L). CD4+ T cells obtained from EAM-Exo-pretreated mice also showed increased ECARs compared to those from the Con-Exo and PBS-negative control (NC) groups (Figures 3M and 3N). Similarly, we observed a considerable elevation in glucose uptake and lactate production in the EAM-Exo group (Figure S3C). These results indicated that the injection of exosomes derived from EAM serum can induce both immune and metabolic reprogramming in mouse splenic CD4+ T cells.
Furthermore, we determined whether EAM-Exo induces cardiac CD4+ T cell reprogramming. Indeed, increased proliferation, differentiation, and ECAR levels were observed in cardiac CD4+ T cells from EAM-Exo-treated mice (Figures S3D and S3F). Together, these results were consistent with those of in vitro assays, indicating that EAM-Exo are key players in CD4+ T cell immunometabolic dysfunction during EAM progression.
miR-142 Is a Key Component of EAM-Exo-Induced CD4+ T Cell Dysfunction
Emerging evidence demonstrates that exosomes exert crucial functional effects on recipient cells via the transfer of miRNAs. Therefore, we selected a series of T cell function-related miRNAs (miR-125a, miR-125b, miR-141, miR-142, miR-146a, and miR-155), in accordance with previous studies,29, 30, 31, 32, 33, 34 and validated their differential expression in EAM and control mouse serum exosomes by qPCR. Among them, miR-142 expression in EAM circulating exosomes was significantly higher than that in the control group, indicating that EAM circulating exosomes could selectively load miR-142 (Figure 4A). Meanwhile, the expression of miR-142 was upregulated in splenic CD4+ T cells of EAM mice (Figure 4B). In contrast, primary (pri)-miR-142 or precursor (pre)-miR-142 levels were not altered in EAM mouse CD4+ T cells, raising the possibility that exogenous miR-142 is required in these cells (Figure S4A). Furthermore, miR-142 levels in CD4+ T cells were positively correlated with the amount of miR-142 in circulating exosomes (Figure 4C), indicating that the upregulation of miR-142 in EAM CD4+ T cells may actually be caused by the internalization of circulating exosomes. Similarly, the effect of exosomes on the enhancement of CD4+ T cell inflammation and glycolysis was positively correlated with exosomal miR-142 levels (Figures S4B–S4E). Then we incubated CD4+ T cells with exosomes and treated them with an RNA polymerase II inhibitor to suppress endogenous RNA transcription. Notably, the RNA polymerase II inhibitor did not affect miR-142 elevation in the presence of EAM-Exo (Figure 4D), suggesting that EAM-Exo incubation does not induce endogenous miR-142 transcription in CD4+ T cells.
Figure 4.

Circulating Exosomes from Mice with EAM Are Selectively Loaded with miR-142
(A) The expression of inflammatory miRNAs in serum exosomes from control and EAM groups was measured by qPCR. (B) CD4+ T cell miRNA levels were measured by qPCR after incubation with Con-Exos and EAM-Exo. (C) Correlation between the expression of miR-142 in exosomes and expression in splenic CD4+ T cells was analyzed. (D) Exosomes were added to CD4+ T cells in the presence or absence of 5,6-dichloro-1-β-D-ribofuranosylbenzimidazole, an inhibitor of RNA polymerase II transcription. After 24 h, we analyzed the miR-142 level in recipient cells. (E–L) CD4+ T cells were transfected with the miR-142 inhibitor or inhibitor control (NC) for 24 h and then treated with EAM-Exo. (E) miR-142 levels were measured after transfection and exosome incubation. (F) CD25 and CD69 expression in respective groups was measured. (G) T cell proliferation was determined based on BrdU incorporation. (H) Percentages of Th1, Th17, and Treg cells were analyzed by flow cytometry. (I) Levels of the cytokines IFN-γ, IL-17A, and IL-10 were measured by ELISA. (J) ECAR in CD4+ T cells was calculated. (K and L) Cellular glucose uptake (K) and lactate production (L) were measured. Data are presented as the means ± SEM (n = 6); ∗p < 0.05.
To further confirm that miR-142 is crucial for the exosomal regulation of immunometabolism in CD4+ T cells, we cocultured these cells with EAM-Exo and performed a series of assays in vitro. An increase in cellular miR-142 levels was observed in recipient CD4+ T cells following treatment with EAM-derived exosomes with kinetics, starting at 4 h and peaking at 24 h (Figure S4F), similar to the observation on exosome uptake. Furthermore, the elevated miR-142 levels in CD4+ T cells after EAM-Exo treatment were efficiently abolished by transfecting the cells with the inhibitor of miR-142 (Figure 4E). Meanwhile, miR-142 inhibition markedly attenuated the effects of EAM-Exo in modulating CD4+ T cell immune functions, including activation, proliferation, differentiation, and cytokine production (Figures 4F–4I). Furthermore, the inhibition of miR-142 reversed CD4+ T cell metabolic reprogramming toward glycolysis, as indicated by measurement of ECAR, glucose uptake, and lactate production (Figures 4J–4L).
To determine whether exosomal miR-142 is involved in CD4+ T cell dysfunction, miR-142 inhibitor was transfected into EAM-Exo to block the expression of miR-142 in exosomes. We validated the silencing efficiency of the miR-142 inhibitor in exosomes by qRT-PCR (Figure S5A). Subsequently, we incubated the exosomes with CD4+ T cells and confirmed that miR-142-deficient exosomes reversed T cell immune dysfunction (Figures S5B–S5E), as well as the metabolic reprogramming (Figures S5F–S5H) triggered by EAM-Exo. Taken together, these results suggest that miR-142, an EAM exosome selectively loaded miRNA, is a crucial mediator of CD4+ T cell immunometabolic dysfunction.
miR-142 Exerts Proglycolysis Effects to Enhance CD4+ Cell Proliferation by Targeting Methyl-CpG Binding Domain Protein 2 (MBD2)
Target genes of miR-142 were predicted and functionally classified by Database for Annotation, Visualization and Integrated Discovery (DAVID). Among the possible miR-142 targets, we finally focused on MBD2, which is involved in both metabolic and T cell-related pathways (Figure 5A). A mimic of miR-142 significantly decreased MBD2 at both the mRNA and protein levels, whereas an inhibitor of miR-142 increased MBD2 mRNA and protein levels in CD4+ T cells (Figures 5B and 5C). Additionally, exosomal miR-142 hampered the expression of MBD2 in CD4+ T cells, but this was reversed by miR-142 inhibition (Figure 5D). However, there were no significant differences in MBD2 expression between Con-Exo and EAM-Exo (Figure S6A), indicating that the effect of exosomes on the expression of MBD2 in recipient cells was not due to the different MBD2 expression level in exosomes. To explore whether MBD2 is a direct target of miR-142, the binding sites for miR-142 in the MBD2 3′ untranslated regions (3′ UTRs) were examined using a luciferase reporter assay. We cloned either wild-type 3′ UTRs or mutant 3′ UTRs, based on putative miR-142 binding sites, into a reporter plasmid and assessed their responsiveness to miR-142 in 293T cells (Figure 5E). The data showed that miR-142 significantly reduced luciferase activity with the MBD2 wild-type 3′ UTR but not with the mutant 3′ UTR constructs (Figure 5F). Furthermore, blocking MBD2 with small interfering RNA (siRNA) rescued the decrease in glycolysis mediated by miR-142 inhibition (Figure S6B), which was accompanied by increased CD4+ T cell proliferation (Figure S6C). These data suggested that MBD2 is a functional target of miR-142 in CD4+ T cells. Then we transfected CD4+ T cells with an MBD2 overexpression plasmid and cocultured with Con-Exo or EAM-Exo. The expression of MBD2 in CD4+ T cells was significantly increased by the MBD2 plasmid but decreased by EAM-Exo treatment (Figure S6D). More importantly, EAM-Exo abolished the MBD2-induced proliferation of T cells and decrease in ECAR levels (Figures 5G and 5H). Therefore, exosomes expressing miR-142 mediate glycolytic reprogramming by directly modulating MBD2 expression in CD4+ T cells.
Figure 5.

Exosomal miR-142 Regulates CD4+ T Cell Glycolysis and Metabolic Reprogramming by Targeting MBD2
(A) Screening scheme for target genes that might contribute to the effects of T cell metabolic regulation mediated by miR-142. (B) Relative mRNA expression of the target gene MBD2 in CD4+ T cells treated with miR-142 mimic negative control (NC), miR-142 mimic, inhibitor NC, or miR-142 inhibitor. (C) Representative blots showing protein expression of the target MBD2 in CD4+ T cells treated with miR-142 mimic NC, miR-142 mimic, inhibitor NC, or miR-142 inhibitor. (D) Relative mRNA expression of MBD2 in CD4+ T cells after exosome incubation. (E) The matched base pairs in the binding region of miR-142 and the reporter plasmids containing the wild- or mutant-type MBD2 are shown. (F) Relative luciferase reporter activity of vectors carrying the luciferase gene and a fragment of MBD2 3′UTR with wild- or mutant-type miR-142 binding sites after cotransfection with miR-142 mimic NC, miR-142 mimic, inhibitor NC, or miR-142 inhibitor. (G) ECARs were measured in CD4+ T cells transfected with MBD2 and incubated with exosomes. (H) BrdU incorporation was calculated in CD4+ T cells transfected with MBD2 and incubated with exosomes. (I and J) Representative blots (I) and quantified data (J) showing protein expression of MBD2, MYC, and metabolic enzymes in CD4+ T cells transfected with siMBD2. (K) ECARs were measured in CD4+ T cells transfected with siMBD2 and siMYC. (L) BrdU incorporation was calculated in CD4+ T cells transfected with siMBD2 and siMYC. Data are presented as the means ± SEM (n = 6); ∗p < 0.05.
Previous studies have demonstrated that MBD2 serves as an effective regulator of glycolysis by repressing the transcription of MYC, a well-known transcription factor that promotes glycolysis.35 To determine whether the effects of MBD2 in modulating glycolysis in CD4+ T cells are associated with metabolic enzymes, as well as MYC, we performed western blot assays. Our results indicated that the suppression of MBD2 by siRNA led to increased MYC, pyruvate kinase M2 (PKM2), and lactate dehydrogenase A (LDHA) expression in CD4+ T cells (Figures 5I and 5J). More importantly, the glycolysis-promoting effects on CD4+ T cells mediated by siMBD2 were completely eliminated after knocking down MYC (Figure 5K). As glycolytic metabolic reprogramming is considered to orchestrate T cell function, we found that the inhibition of MBD2 could significantly elevate cell proliferation, which was rescued by MYC silencing (Figure 5L). In summary, our findings suggested that miR-142 increases CD4+ T cell proliferation by targeting MBD2 to enhance glycolysis. Therefore, EAM exosomally derived miR-142 is sufficient to mediate glycolytic reprogramming by directly binding MBD2.
miR-142 Promotes CD4+ T Cell Inflammation by Targeting Suppressor of Cytokine Signaling 1 (SOCS1)
Current studies have highlighted that miR-142 participates in proinflammatory responses in a wide range of autoimmune-related diseases.36,37 SOCS1, as an important suppressor of inflammation, can inhibit the Janus kinase-signal transducer and activator of transcription (JAK-STAT) pathway, thus negatively regulating CD4+ T cell inflammatory responses.38 Importantly, TargetScan, miRDB, and miRanda databases predicted SOCS1 to be a target gene of miR-142 (Figure 6A). Our qPCR and western blotting results further validated that the overexpression of miR-142 could greatly suppress the expression of SOCS1 in CD4+ T cells, with opposite results obtained after miR-142 inhibition (Figures 6B and 6C). Moreover, SOCS1 expression in CD4+ T cells was significantly suppressed by EAM-Exo treatment but was increased after miR-142 inhibition (Figure 6D). Meanwhile, the expression of SOCS1 between Con-Exo and EAM-Exo was not significantly different (Figure S7A).
Figure 6.

Exosomal miR-142 Controls CD4+ T Cell Inflammatory Responses by Targeting SOCS1
(A) Screening scheme for target genes that might contribute to T cell inflammation mediated by miR-142. (B) Relative mRNA expression of the target gene SOCS1 in CD4+ T cells treated with miR-142 mimic NC, miR-142 mimic, inhibitor NC, or miR-142 inhibitor. (C) Representative blots showing protein expression of the target SOCS1 in CD4+ T cells treated with miR-142 mimic NC, miR-142 mimic, inhibitor NC, or miR-142 inhibitor. (D) Relative mRNA expression of SOCS1 in CD4+ T cells after exosome incubation. (E) The matched base pairs in the binding region of miR-142 and the reporter plasmids containing the wild- or mutant-type SOCS1 are shown. (F) Relative luciferase reporter activity of vectors carrying the luciferase gene and a fragment of SOCS1 3′UTR with wild- or mutant-type miR-142 binding sites after cotransfection with miR-142 mimic NC, miR-142 mimic, inhibitor NC, or miR-142 inhibitor. (G-I) Percentages of Th1 (G), Th17 (H), and Treg (I) proportions were calculated in CD4+ T cells transfected with SOCS1 and incubated with exosomes by flow cytometry. (J–L) Levels of the cytokines IFN-γ (J), IL-17A (K), and IL-10 (L) were measured in CD4+ T cells transfected with SOCS1 and incubated with exosomes. Data are presented as the means ± SEM (n = 6); ∗p < 0.05.
To investigate binding between miR-142 and the 3′ UTR of SOCS1, a luciferase assay was performed. We cloned SOCS1 wild-type 3′ UTRs or mutant 3′ UTRs into a reporter plasmid and assessed their responsiveness to miR-142 in 293T cells (Figure 6E). Treatment with the miR-142 mimic caused a marked decrease in luciferase activity, whereas treatment with the miR-142 inhibitor enhanced luciferase activity. Additionally, SOCS1 mutant 3′ UTRs did not result in an alteration in the luciferase activity response to the miR-142 mimic or inhibitor (Figure 6F). However, concomitant treatment with an inhibitor of miR-142 and siSOCS1 significantly restored the miR-142 inhibitor-mediated repression of proinflammatory effects. After miR-142 inhibition, Th1 and Th17 cells were increased, as well as IFN-γ and IL-17A production, whereas Treg cells and IL-10 production were reduced, but all of these effects were reversed by blocking SOCS1 expression (Figures S7B–S7G). These results confirmed that miR-142 modulated T cell differentiation by silencing SOCS1. Moreover, CD4+ T cells were transfected with a SOCS1 overexpression plasmid and incubated with exosomes. Plasmid transfection effectively upregulated SOCS1 expression, whereas normal expression was restored by EAM-Exo (Figure S7H). Importantly, SOCS1 mediated a reduction in Th1 and Th17 cell counts and an increase in Treg cells, whereas EAM-Exo abrogated these effects, as measured by flow cytometry and ELISA (Figures 6G–6L). Therefore, these data suggested that exosomal miR-142 modulates T cell-induced inflammation by directly suppressing SOCS1 expression.
Exosomal miR-142 Mediated EAM Cardiac Injury and Dysfunction
To explore the effects of miR-142 contained in the exosomes on EAM progression, we utilized the miR-142 inhibitor in EAM mice and then treated with EAM-Exo. We confirmed that the miR-142 expression was efficiently downregulated by the miR-142 inhibitor, whereas the expression was rescued by EAM-Exo pretreatment (Figure 7A). H&E staining indicated that the miR-142 inhibitor decreased EAM cardiac inflammation, whereas this effect was restored by EAM-Exo (Figures 7B and 7C). CD4+ T cell infiltration was reduced after miR-142 inhibition but increased after EAM-Exo injection (Figures 7D and 7E). We performed an echocardiography assay and confirmed that the cardiac function improvement mediated by miR-142 inhibition was impaired by EAM-Exo (Figures 7F–7H). Then we isolated CD4+ T cells in the indicated groups and measured ECAR; we observed a lower ECAR level in the miR-142 inhibitor group, whereas an exosomes injection reversed this effect (Figure 7I). After miR-142 inhibition, there was lower production of IFN-γ and IL-17A but increased IL-10 levels, in EAM serum; however, the protective function was abolished after exosomes were transferred (Figure 7J). These results indicated that circulating exosomes carrying miR-142 orchestrate CD4+ T cell immunometabolic reprogramming, thus mediating cardiac inflammation and dysfunction in myocarditis.
Figure 7.

Measurement of Myocarditis Progression with miR-142 Inhibition and Exosomes Injection
(A) miR-142 levels were measured in CD4+ T cells from mice treated with miR-142 inhibitor and EAM exosomes. (B) Cardiac tissue H&E staining was performed (scale bars, 200 μm). (C) The H&E images were analyzed based on histological grades. (D) CD4+ cell infiltration in the cardiac sections was analyzed by immunohistochemistry (scale bars, 100 μm). (E) The percentages of CD4+ cells were enumerated. (F) Cardiac M-mode echocardiographic images are displayed. (G and H) Left ventricular EFs (G) and LVEDD (H) were measured in respective groups. (I) CD4+ T cells were sorted and measured ECAR levels. (J) Serum cytokines levels were measured in indicated groups. Data are presented as the means ± SEM (n = 6); ∗p < 0.05.
Discussion
Myocarditis is a cardiovascular disease associated with high morbidity and mortality. It is mainly triggered by cardiotropic viruses and subsequently enhanced by autoimmune responses.4 Notably, autoimmunity is regarded as a central factor accelerating inflammation, as well as subsequent cardiac remodeling.39 Although the initial trigger differs between human myocarditis and EAM, the transition to autoimmune-mediated cardiac injury would sustain the condition deterioration upon the clearance of virus.40,41 The EAM model mimics autoimmune-induced cardiac injury in myocarditis. Therefore, we utilized the EAM model to study the underlying autoreactivity mechanisms.
A vast body of evidence supports the notion that self-reactive effector T cells are involved in the immunopathogenic effects of myocarditis.4,42 In human myocarditis and EAM, sustained and inappropriate activation of CD4+ T cells damages the myocardium, and this eventually leads to end-stage heart failure, the common characteristic phenotype of inflammatory-dilated cardiomyopathy, regardless of the trigger.2,43,44
Recently, the close relationship between metabolic properties and immune function was emphasized for a series of autoimmune diseases.7,10,45 A disruption in metabolic status can lead to cellular dysfunction in immune cells and eventually result in immuno-turbulence. Glycolysis fuels the energetic and biosynthetic demands of CD4+ T cell activation and proliferation, thus determining inflammatory and functional fates.46,47 Moreover, a switch to glycolysis accompanies CD4+ T cell subtype differentiation, which facilitates immunomodulation.48 Our previous studies suggested that glycolytic metabolic reprogramming is critical for EAM-induced cardiac remodeling,11 indicating that there may be some specific and potential drivers of CD4+ T cell immunometabolic dysfunction during EAM progression.
In the past three decades, research on myocarditis pathogenesis has been focused on the impact of inflammatory peptides and nucleic acids, whereas the role of bioactive vesicles as critical regulators of the immune response has only been marginally addressed. Exosomes mediate the exchange of cellular materials among cells through various paracrine and endocrine mechanisms, playing instrumental roles in intercellular communication. Notably, exosomes have emerged as novel elements that regulate T cell function and active autoimmune responses. It was reported that circulating exosomes can suppress Treg cell induction in multiple sclerosis and rheumatoid arthritis.19,49 In Hashimoto thyroiditis, exosomes were reported to increase Th1 and Th17 cell differentiation but suppress Treg cells.50 Furthermore, extracellular vesicles were found to reprogram the recipient cell glucose metabolism to facilitate disease progression.51
Here, we demonstrate that circulating exosomes transmit immune-regulatory signals and induce immunometabolic reprogramming in CD4+ T cells to mediate myocarditis progression. We found that EAM-Exo mediate CD4+ T cell activation, proliferation, and differentiation in vitro. Moreover, EAM-derived exosomes were found to reprogram the CD4+ T cell glycolytic metabolism to shape cellular immune functions. It was further confirmed that these exosomes could be internalized by CD4+ T cells in vivo to modulate CD4+ T cell immunometabolic functions. Although more precise CD4 T cell immune subtype alterations were not clear, this should be addressed in future studies.
GW4869, an inhibitor of exosome release, could prevent and reverse EAM progression in mice, suggesting that peripheral exosomes are indispensable for the pathological course of myocarditis. To directly elucidate the role of exosomes in the pathological course of EAM, we injected exosomes into naive mice and evaluated CD4+ T cell immunological status and cardiac inflammation. Our study demonstrated that EAM-associated circulating exosomes could, at least partially, mediate autoimmune myocardial damage. Above all, our results provide solid evidence that circulating exosomes play an important role in CD4+ T cell immunometabolic disturbances to facilitate myocarditis pathogenesis. Targeting exosome secretion or neutralizing their hyperimmunological activity could be a way to block such internal crosstalk; however, this requires the identification of the immune-specific molecules or pathways.
Exosomes can deliver proteins, mRNAs, and miRNAs to recipient cells through systemic circulation. In particular, miRNAs carried by exosomes were shown to exert dramatic effects in modulating cell function, through which exosomes could transport and transduce the miRNAs in this secretory form to target cells.23 Of note, the exosome-derived miRNAs actually alter gene expression and manipulate functions of the recipient T cells.19,52 miR-142, an immune- and metabolism-related miRNA, is implicated in a series of autoimmune diseases, such as multiple sclerosis, graft-versus-host disease, and systemic lupus erythematosus.32,36,53 Consequently, we identified a group of inflammatory miRNAs (miR-125a, miR-125b, miR-141, miR-142, miR-146a, and miR-155) related to T cell functions in serum exosomes based on previous studies.29, 30, 31, 32, 33, 34 We showed that the expression of miR-142 in EAM serum exosomes is dramatically increased, suggesting that this molecule may effectively contribute to exosomal biological activity during the course of this disease. Indeed, in our experiments, we found that an miR-142 inhibitor could rescue EAM-Exo-induced immunometabolic dysfunction and cardiac impairment, confirming that exosomal miR-142 modulates T cell functional status to favor cardiac inflammatory activation.
miRNAs regulate intricate physiological processes by targeting functional genes. With the use of databases, we discovered that MBD2 and SOCS1 are direct target genes of miR-142. MBD2, an epigenetic regulator, can repress gene expression by recruiting the nucleosome remodeling deacetylase (NuRD) complex to methylated DNA regions.54 Moreover, studies have shown that the metabolic master transcription factor MYC is a direct target of MBD2 and thereby contributes to metabolic phenotypic switches.35 Furthermore, MBD2 was reported to regulate T cell functions and is implicated in autoimmune diseases.55 SOCS1, a well-known suppressor of inflammation, was found to play an essential role in maintaining functional Treg cells.56 It was also reported to modulate T cell integrity and function via the regulation of Foxp3 expression and the inhibition of IFN-γ and IL-17 production.57 Based on different functional assays, we suggest that exosomal miR-142 could mediate cellular communication, thus influencing CD4+ T cell glycolysis and inflammation, by targeting MBD2 and SOCS1, respectively. The overall results raised the possibility that alterations to the miR-142-MBD2/SOCS1 axis might underlie the autoimmune response associated with EAM pathogenesis.
There are several limitations that should be acknowledged. First, during myocardial inflammation and remodeling in myocarditis progression, differential cellular compartments are activated, which could result in the release of immune-stimulatory exosomes. Although recent studies have shown that the bone marrow-derived compartment tends to secrete functional exosomes in response to inflammatory stimuli,58,59 the origins of these functional exosomes have yet to be identified. Furthermore, our studies could not determine why exosomes selectively load miR-142. The understanding of the selective mechanisms of miRNA secretion patterns, which might involve RNA-binding proteins and epigenetic pri-miRNA processing, could reveal unique strategies to block related autoreactive miRNA secretion.60,61
In summary, we demonstrated in the present study that circulating exosomes from EAM mice can be internalized by CD4+ T cells and induce immune-metabolic reprogramming. Furthermore, these vesicles can serve as profound and sustained promoters to facilitate EAM progression in vivo. Specifically, the selectively loaded content in exosomes, namely miR-142, directly suppresses MBD2 and SOCS1, leading to activated CD4+ T cell inflammatory responses. Our findings present a novel endogenous immunometabolic pattern in which circulating exosomes orchestrate CD4+ T cell function during myocarditis. This newly identified intercellular communication mechanism will contribute to a better understanding of the autoimmune pathogenic mechanism involved in the development of myocarditis.
Materials and Methods
Experimental Animals
Male BALB/c mice (6–8 weeks of age) were purchased from Beijing Vital River Laboratory Animal Technology (Beijing, China). All animal care and use protocols were in accordance with the Principles of Animal Care provided by the National Society for Medical Research and the Guide for the Care and Use of Laboratory Animals (Institute of Laboratory Animal Resources/NIH). All animal studies performed conformed to the protocols approved by the Research Ethics Committee of the Second Affiliated Hospital of Harbin Medical University, China.
Induction and Treatment of Experimental Autoimmune Myocarditis Mice
To generate an EAM mouse model, animals were subcutaneously injected with 200 μg myosin heavy chain (MyHC)-α (MyHC-α614–629 sequence: Ac-S LKLM ATLFSTYASAD-OH; purity >95%; Ontores Biotechnologies, Zhejiang, China) on days 0 and 7. MyHC-α was prepared with an equal volume of complete Freund’s adjuvant (CFA; Sigma-Aldrich, St. Louis, MO, USA) and dissolved in PBS. Mice that were administered CFA and PBS without MyHC-α stimulation were used as the control group. On day 21, mice were sacrificed, and serum samples and heart tissue were collected for further analysis.
For the inhibition of miR-142 in vivo, 2.5 mg/kg miR-142 inhibitor was mixed with 25 μL of in vivo transfection reagent (Engreen Biosystem, Beijing, China) in 50 μL of 10% glucose solution and delivered seven times intravenously, injected at 3-day intervals.
In Vivo Exosome Injection and GW4869 Inhibition
For the administration of serum exosomes from donor to recipient mice, 100 μg of exosomes or an equivalent volume of PBS was injected via the tail vein every week for a total of three times. Mice were all euthanized on day 21 after the first injection; then, further analysis was performed.
For exosome inhibitor treatment, mice were injected with GW4869 (HY-19363; MedChemExpress [MCE], Monmouth Junction, NJ, USA) as previously described.62 Briefly, GW4869 was dissolved in DMSO and injected intraperitoneally at one dose of 2.5 μg/g for 1 h prior to MyHC-α injection. The same volume of PBS was injected as that for the controls. Mice were sacrificed on day 21 and analyzed for EAM progression.
Serum Exosome Preparation, Identification, and Cellular Uptake Experiments
Blood samples were collected, and serum exosomes were isolated as previously described.63 Briefly, peripheral blood was left to coagulate for 20 min at room temperature. The serum was centrifuged at 1,000 × g for 5 min and then 10,000 × g for 10 min. Next, the resultant serum was filtered through a 0.1-μm pore mesh and then ultracentrifuged at 100,000 × g for 1 h to pellet the extracellular vesicles. Finally, extracellular vesicles were washed with PBS and pelleted again by ultracentrifugation at 100,000 × g for 1 h. The isolated exosomes were collected and resuspended in filtered PBS for subsequent experiments. The concentration of exosomes was measured with a bicinchoninic acid (BCA) protein kit (Beyotime, Shanghai, China). Exosomes were analyzed using a transmission electron microscope (H-7650; Hitachi, Japan) and NTA in terms of ultrastructure and size distribution. The expression of Alix, TSG101, CD63, Calnexin, and ApoA1 in exosomes was analyzed by western blotting.
Exosome Labeling and Cellular Uptake
To confirm that CD4+ T cells could take up and internalize exosomes in vitro, exosomes were stained with PKH67 membrane dye (Sigma, St. Louis, MO), as previously described,64 and observed with a laser-scanning confocal microscope (Leica, JEM-1220; JEOL, Japan) and FACSCanto II system (BD Biosciences, San Jose, CA, USA). To identify the cellular localization of exosomes in cardiac CD4+ T cells, 100 μg PKH67-labeled Con-Exo or EAM-Exo was intravenously administrated. The mice were killed at 24 h postinjection, and their hearts were harvested. The sections were immunostained with anti-CD4 (Abcam, Cambridge, UK) and 4′,6-diamidino-2-phenylindole (DAPI). Images were obtained from a laser-scanning confocal microscope.
In Vivo Imaging of Fluorescence-Labeled Exosomes and Tracking
A total of 100 μg of exosomes derived from EAM mice or the control group were labeled with PKH67 dye and intravenously injected into naive mice once a week. Mice were euthanized 12 h after the injection, and vital organs were collected for imaging by Bruker MI SE (Bruker, Germany).
Splenic and Cardiac CD4+ T Cell Isolation and Culture
Mouse spleens were removed, homogenized, and filtered through a 70-μm nylon mesh in PBS. Meanwhile, the heart tissue was subjected to digestion and filtration to remove extracellular connective tissue debris. Following this, CD4+ T cells were isolated from both tissues, as previously described.11 Next, cells were stimulated with 4 μg/mL of anti-CD3 monoclonal antibodies and 2 μg/mL of anti-CD28 monoclonal antibodies (eBioscience, San Diego, CA, USA) at 37°C.
Additionally, the RNA polymerase II inhibitor 5,6-dichloro-1-β-D-ribofuranosylbenzimidazole (Sigma, St. Louis, MO, USA) (20 mM) was cultured with CD4+ T cells in the presence of exosomes for 24 h.
RNA Interference and Plasmids
CD4+ T cells in culture were transfected with miR-142 mimics or inhibitors (GenePharma, Shanghai, China) or with a NC mimic or inhibitor using Lipofectamine 2000 (Invitrogen, Carlsbad, CA, USA) in accordance with the manufacturer’s instructions. For exosomes transfection, the miR-142 mimic or inhibitor was loaded in exosomes using the Exo-Fect Exosome Transfection Kit (System Biosciences). The knockdown of MBD2, SOCS1, and MYC was accomplished with siRNAs (GenePharma, Shanghai, China). The upregulation of MBD2 and SOCS1 was accomplished with overexpression vectors (GenePharma, Shanghai, China). After a 12-h transfection process, CD4+ T cells were harvested and used for further analyses.
Flow Cytometric Analysis
Cells were incubated with anti-CD4-fluorescein isothiocyanate (FITC) (RM4-5; BD Biosciences, San Jose, CA, USA), anti-CD45-phycoerythrin (PE)/Cy7 (30-F11; BioLegend), anti-CD25-APC (PC61; BD Biosciences), anti-CD69-PE (H1.2F3; BD Biosciences), and anti-Foxp3-PE (MF23; BD Biosciences) fluorochrome-conjugated antibodies for 1.5 h for flow cytometric analysis. For IFN-γ (XMG1.2; BD Biosciences) and IL-17A (B27; BD Biosciences) staining, T cells were prestimulated with phorbol 12-myristate 13-acetate (PMA), ionomycin, and GolgiPlug (Sigma-Aldrich, St. Louis, MO, USA) for 4–5 h. The results were acquired using a FACSCanto II system (BD Biosciences) and analyzed using FlowJo software, version V10. Antibodies and staining panels are listed in the experimental procedures in Table S1.
ELISA
Expression of the T cell-related cytokines IFN-γ, IL-17A, and IL-10 was measured using ELISA kits (R&D Systems, MN, USA), according to the manufacturer’s recommendations. Serum TnI levels were also analyzed using an ELISA kit (Life Diagnostics, West Chester, PA, USA), according to the manufacturer’s protocols.
BrdU ELISA for T Cell Proliferation
CD4+ T cells were plated in 96-well, round-bottom microplates and incubated with 10 mM BrdU for 24 h. BrdU incorporation, to assess T cell proliferation, was quantified by a BrdU ELISA kit (Chemicon International, Temecula, CA, USA), according to the manufacturer’s protocols.
Determination of the Metabolic Profile of CD4+ T Cells
CD4+ T cells were plated in XFe24 plates (Seahorse Bioscience, North Billerica, MA, USA) at a concentration of 4 × 10⁶ cells/well and cultured for 12 h with RPMI 1640. The real-time ECAR was measured with an XFe24 EF analyzer (Seahorse Bioscience), which was measured in XF medium under basal conditions with the addition with 10 mM glucose, 1 μM oligomycin, and 50 mM 2-deoxy-D-glucose (2-DG; Seahorse Bioscience, North Billerica, MA, USA). Intracellular glucose uptake and extracellular lactate production were analyzed in the cell lysates or culture medium using glycose uptake assay and lactate assay kits (Abcam, Cambridge, UK).
Histological Studies and Immunohistochemical Analysis
Heart tissue was fixed in 4% paraformaldehyde for 24 h. After dehydration, clearing, and embedding in paraffin wax, the sliced sections (5 μm) were stained with H&E. For immunohistochemical analysis, cardiac sections were dewaxed, subjected to antigen retrieval, and incubated with an anti-CD4 antibody (Abcam, Cambridge, UK), which was followed by incubation with a secondary antibody.
Echocardiography
We performed two-dimensional and M-mode echocardiographic measurements with a high-resolution in vivo imaging system (Vivid E9; GE Healthcare, USA). LVEDD and LV end-systolic dimension (LVESD), LV EF, and LV fractional shortening (FS) were analyzed based on long-axis M-mode measurements from the average of three independent cardiac cycles.
qRT-PCR
Exosomal RNA was extracted using an miRcute miRNA Isolation Kit (Tiangen Biotech, China) from the purified exosomes that were isolated from the same amount of serum. Synthetic Caenorhabditis elegans (cel)-miR-39 (5 fmol/μL; Applied Biosystems, CA, USA) was added as an external control. Then, RNA was reverse transcribed to cDNA using an miRcute Plus miRNA First-Strand cDNA Synthesis Kit (Tiangen Biotech), according to standard protocols. Cellular total RNA was extracted with TRIzol reagent (Invitrogen, Carlsbad, CA, USA), and mRNA was reverse transcribed with the Transcriptor First Strand cDNA Synthesis Kit (Roche Diagnostics, Risch-Rotkreuz, Switzerland). The relative miRNA levels in exosomes were normalized to cel-miR-39; the relative cellular miRNA levels were normalized to U6 RNA levels. Cellular mRNA levels were calculated, normalized to β-actin mRNA levels, and analyzed by the 2−ΔΔCt method. The primers used are listed in Table S2.
Western Blotting
Total protein samples from CD4+ T cells were extracted with lysis buffer (Beyotime Institute of Biotechnology, Shanghai, China), and the proteins were separated by SDS-PAGE before being transferred onto polyvinylidene difluoride membranes (Millipore). The immunoblots were incubated at 4°C overnight with primary antibodies including anti-MBD2 (Abcam), anti-SOCS1 (Abcam), anti-MYC, anti-PKM2, and anti-LDHA (all from Cell Signaling Technology, Danvers, MA, USA) and anti-β-actin (Proteintech, Shanghai, China). Secondary antibodies were purchased from Cell Signaling Technology (Danvers, MA, USA). The samples were normalized to β-actin levels.
Luciferase Assays
Wild-type and mutated MBD2 or SOCS1 mRNA 3′ UTR fragments were synthesized and inserted into the p-MIR-REPORT plasmid (GenePharma, Shanghai, China). For luciferase analysis, cells were cotransfected with a miR-142 mimic or inhibitor at 60 nM, together with 10 ng of a Renilla luciferase reporter. After 24 h of transfection, Renilla luciferase activity was assayed using the Dual-Luciferase Reporter Assay System (Promega), based on the manufacturer’s protocol.
Statistical Analysis
Statistical analyses were performed with SPSS 23.0 (SPSS, USA) and GraphPad Prism 8 (GraphPad Software, CA, USA). Statistical significance was indicated by p < 0.05 based on a Student’s t test and one-way analysis of variance. A two-sided Spearman’s correlation test was used to calculate the correlation between relative expression levels.
Author Contributions
P.S., M.Z., and J.T. conceived and designed the experiments. P.S., N.W., P.Z., C.W., H.L., Q.C., G.M., and W.W. carried out the experiments. P.S., M.Z., G.D., and S.F. analyzed the data. P.S. and M.Z. wrote the manuscript. All authors agreed to be responsible for the content of the work.
Conflicts of Interest
The authors declare no competing interests.
Acknowledgments
This work was supported by the National Natural Science Foundation of China (81670459 and 81671762) and Postgraduate Research & Practice Innovation Program of Harbin Medical University (no. YJSKYCX2019-93HYD).
Footnotes
Supplemental Information can be found online at https://doi.org/10.1016/j.ymthe.2020.08.015.
Contributor Information
Maomao Zhang, Email: maomaolp1983@163.com.
Jiawei Tian, Email: jwtian2004@163.com.
Supplemental Information
References
- 1.Fung G., Luo H., Qiu Y., Yang D., McManus B. Myocarditis. Circ. Res. 2016;118:496–514. doi: 10.1161/CIRCRESAHA.115.306573. [DOI] [PubMed] [Google Scholar]
- 2.Sagar S., Liu P.P., Cooper L.T., Jr. Myocarditis. Lancet. 2012;379:738–747. doi: 10.1016/S0140-6736(11)60648-X. [DOI] [PMC free article] [PubMed] [Google Scholar]
- 3.Simons K.H., de Jong A., Jukema J.W., de Vries M.R., Arens R., Quax P.H.A. T cell co-stimulation and co-inhibition in cardiovascular disease: a double-edged sword. Nat. Rev. Cardiol. 2019;16:325–343. doi: 10.1038/s41569-019-0164-7. [DOI] [PubMed] [Google Scholar]
- 4.Heymans S., Eriksson U., Lehtonen J., Cooper L.T., Jr. The Quest for New Approaches in Myocarditis and Inflammatory Cardiomyopathy. J. Am. Coll. Cardiol. 2016;68:2348–2364. doi: 10.1016/j.jacc.2016.09.937. [DOI] [PubMed] [Google Scholar]
- 5.Afanasyeva M., Georgakopoulos D., Fairweather D., Caturegli P., Kass D.A., Rose N.R. Novel model of constrictive pericarditis associated with autoimmune heart disease in interferon-gamma-knockout mice. Circulation. 2004;110:2910–2917. doi: 10.1161/01.CIR.0000147538.92263.3A. [DOI] [PubMed] [Google Scholar]
- 6.Marty R.R., Dirnhofer S., Mauermann N., Schweikert S., Akira S., Hunziker L., Penninger J.M., Eriksson U. MyD88 signaling controls autoimmune myocarditis induction. Circulation. 2006;113:258–265. doi: 10.1161/CIRCULATIONAHA.105.564294. [DOI] [PubMed] [Google Scholar]
- 7.Patel C.H., Powell J.D. Targeting T cell metabolism to regulate T cell activation, differentiation and function in disease. Curr. Opin. Immunol. 2017;46:82–88. doi: 10.1016/j.coi.2017.04.006. [DOI] [PMC free article] [PubMed] [Google Scholar]
- 8.Ricciardi S., Manfrini N., Alfieri R., Calamita P., Crosti M.C., Gallo S., Müller R., Pagani M., Abrignani S., Biffo S. The Translational Machinery of Human CD4(+) T Cells Is Poised for Activation and Controls the Switch from Quiescence to Metabolic Remodeling. Cell Metab. 2018;28:895–906.e5. doi: 10.1016/j.cmet.2018.08.009. [DOI] [PMC free article] [PubMed] [Google Scholar]
- 9.Valle-Casuso J.C., Angin M., Volant S., Passaes C., Monceaux V., Mikhailova A., Bourdic K., Avettand-Fenoel V., Boufassa F., Sitbon M. Cellular Metabolism Is a Major Determinant of HIV-1 Reservoir Seeding in CD4(+) T Cells and Offers an Opportunity to Tackle Infection. Cell Metab. 2019;29:611–626.e5. doi: 10.1016/j.cmet.2018.11.015. [DOI] [PubMed] [Google Scholar]
- 10.Chang C.H., Pearce E.L. Emerging concepts of T cell metabolism as a target of immunotherapy. Nat. Immunol. 2016;17:364–368. doi: 10.1038/ni.3415. [DOI] [PMC free article] [PubMed] [Google Scholar]
- 11.Wu J., Sun P., Chen Q., Sun Y., Shi M., Mang G., Yu S., Zheng Y., Li Z., Sun M. Metabolic reprogramming orchestrates CD4+ T-cell immunological status and restores cardiac dysfunction in autoimmune induced-dilated cardiomyopathy mice. J. Mol. Cell. Cardiol. 2019;135:134–148. doi: 10.1016/j.yjmcc.2019.08.002. [DOI] [PubMed] [Google Scholar]
- 12.Nishikubo K., Imanaka-Yoshida K., Tamaki S., Hiroe M., Yoshida T., Adachi Y., Yasutomi Y. Th1-type immune responses by Toll-like receptor 4 signaling are required for the development of myocarditis in mice with BCG-induced myocarditis. J. Autoimmun. 2007;29:146–153. doi: 10.1016/j.jaut.2007.07.001. [DOI] [PubMed] [Google Scholar]
- 13.Chen P., Baldeviano G.C., Ligons D.L., Talor M.V., Barin J.G., Rose N.R., Cihakova D. Susceptibility to autoimmune myocarditis is associated with intrinsic differences in CD4(+) T cells. Clin. Exp. Immunol. 2012;169:79–88. doi: 10.1111/j.1365-2249.2012.04598.x. [DOI] [PMC free article] [PubMed] [Google Scholar]
- 14.Futamatsu H., Suzuki J., Mizuno S., Koga N., Adachi S., Kosuge H., Maejima Y., Hirao K., Nakamura T., Isobe M. Hepatocyte growth factor ameliorates the progression of experimental autoimmune myocarditis: a potential role for induction of T helper 2 cytokines. Circ. Res. 2005;96:823–830. doi: 10.1161/01.RES.0000163016.52653.2e. [DOI] [PubMed] [Google Scholar]
- 15.Tran P.H.L., Xiang D., Tran T.T.D., Yin W., Zhang Y., Kong L., Chen K., Sun M., Li Y., Hou Y. Exosomes and Nanoengineering: A Match Made for Precision Therapeutics. Adv. Mater. 2020;32:e1904040. doi: 10.1002/adma.201904040. [DOI] [PubMed] [Google Scholar]
- 16.Cheng Q., Shi X., Han M., Smbatyan G., Lenz H.J., Zhang Y. Reprogramming Exosomes as Nanoscale Controllers of Cellular Immunity. J. Am. Chem. Soc. 2018;140:16413–16417. doi: 10.1021/jacs.8b10047. [DOI] [PMC free article] [PubMed] [Google Scholar]
- 17.Tkach M., Kowal J., Zucchetti A.E., Enserink L., Jouve M., Lankar D., Saitakis M., Martin-Jaular L., Théry C. Qualitative differences in T-cell activation by dendritic cell-derived extracellular vesicle subtypes. EMBO J. 2017;36:3012–3028. doi: 10.15252/embj.201696003. [DOI] [PMC free article] [PubMed] [Google Scholar]
- 18.Loyer X., Zlatanova I., Devue C., Yin M., Howangyin K.Y., Klaihmon P., Guerin C.L., Kheloufi M., Vilar J., Zannis K. Intra-Cardiac Release of Extracellular Vesicles Shapes Inflammation Following Myocardial Infarction. Circ. Res. 2018;123:100–106. doi: 10.1161/CIRCRESAHA.117.311326. [DOI] [PMC free article] [PubMed] [Google Scholar]
- 19.Kimura K., Hohjoh H., Fukuoka M., Sato W., Oki S., Tomi C., Yamaguchi H., Kondo T., Takahashi R., Yamamura T. Circulating exosomes suppress the induction of regulatory T cells via let-7i in multiple sclerosis. Nat. Commun. 2018;9:17. doi: 10.1038/s41467-017-02406-2. [DOI] [PMC free article] [PubMed] [Google Scholar]
- 20.Yu G., Jung H., Kang Y.Y., Mok H. Comparative evaluation of cell- and serum-derived exosomes to deliver immune stimulators to lymph nodes. Biomaterials. 2018;162:71–81. doi: 10.1016/j.biomaterials.2018.02.003. [DOI] [PubMed] [Google Scholar]
- 21.Robbins P.D., Morelli A.E. Regulation of immune responses by extracellular vesicles. Nat. Rev. Immunol. 2014;14:195–208. doi: 10.1038/nri3622. [DOI] [PMC free article] [PubMed] [Google Scholar]
- 22.Théry C., Witwer K.W., Aikawa E., Alcaraz M.J., Anderson J.D., Andriantsitohaina R., Antoniou A., Arab T., Archer F., Atkin-Smith G.K. Minimal information for studies of extracellular vesicles 2018 (MISEV2018): a position statement of the International Society for Extracellular Vesicles and update of the MISEV2014 guidelines. J. Extracell. Vesicles. 2018;7:1535750. doi: 10.1080/20013078.2018.1535750. [DOI] [PMC free article] [PubMed] [Google Scholar]
- 23.Mori M.A., Ludwig R.G., Garcia-Martin R., Brandão B.B., Kahn C.R. Extracellular miRNAs: From Biomarkers to Mediators of Physiology and Disease. Cell Metab. 2019;30:656–673. doi: 10.1016/j.cmet.2019.07.011. [DOI] [PMC free article] [PubMed] [Google Scholar]
- 24.Bala S., Petrasek J., Mundkur S., Catalano D., Levin I., Ward J., Alao H., Kodys K., Szabo G. Circulating microRNAs in exosomes indicate hepatocyte injury and inflammation in alcoholic, drug-induced, and inflammatory liver diseases. Hepatology. 2012;56:1946–1957. doi: 10.1002/hep.25873. [DOI] [PMC free article] [PubMed] [Google Scholar]
- 25.Cheng M., Yang J., Zhao X., Zhang E., Zeng Q., Yu Y., Yang L., Wu B., Yi G., Mao X. Circulating myocardial microRNAs from infarcted hearts are carried in exosomes and mobilise bone marrow progenitor cells. Nat. Commun. 2019;10:959. doi: 10.1038/s41467-019-08895-7. [DOI] [PMC free article] [PubMed] [Google Scholar]
- 26.Yan W., Wu X., Zhou W., Fong M.Y., Cao M., Liu J., Liu X., Chen C.H., Fadare O., Pizzo D.P. Cancer-cell-secreted exosomal miR-105 promotes tumour growth through the MYC-dependent metabolic reprogramming of stromal cells. Nat. Cell Biol. 2018;20:597–609. doi: 10.1038/s41556-018-0083-6. [DOI] [PMC free article] [PubMed] [Google Scholar]
- 27.Pan A., Tan Y., Wang Z., Xu G. STAT4 silencing underlies a novel inhibitory role of microRNA-141-3p in inflammation response of mice with experimental autoimmune myocarditis. Am. J. Physiol. Heart Circ. Physiol. 2019;317:H531–H540. doi: 10.1152/ajpheart.00048.2019. [DOI] [PubMed] [Google Scholar]
- 28.Yan L., Hu F., Yan X., Wei Y., Ma W., Wang Y., Lu S., Wang Z. Inhibition of microRNA-155 ameliorates experimental autoimmune myocarditis by modulating Th17/Treg immune response. J. Mol. Med. (Berl.) 2016;94:1063–1079. doi: 10.1007/s00109-016-1414-3. [DOI] [PubMed] [Google Scholar]
- 29.Li J.Q., Hu S.Y., Wang Z.Y., Lin J., Jian S., Dong Y.C., Wu X.F., Dai-Lan, Cao L.J. Long non-coding RNA MEG3 inhibits microRNA-125a-5p expression and induces immune imbalance of Treg/Th17 in immune thrombocytopenic purpura. Biomed. Pharmacother. 2016;83:905–911. doi: 10.1016/j.biopha.2016.07.057. [DOI] [PubMed] [Google Scholar]
- 30.Rossi R.L., Rossetti G., Wenandy L., Curti S., Ripamonti A., Bonnal R.J., Birolo R.S., Moro M., Crosti M.C., Gruarin P. Distinct microRNA signatures in human lymphocyte subsets and enforcement of the naive state in CD4+ T cells by the microRNA miR-125b. Nat. Immunol. 2011;12:796–803. doi: 10.1038/ni.2057. [DOI] [PubMed] [Google Scholar]
- 31.González-Gugel E., Villa-Morales M., Santos J., Bueno M.J., Malumbres M., Rodríguez-Pinilla S.M., Piris M.Á., Fernández-Piqueras J. Down-regulation of specific miRNAs enhances the expression of the gene Smoothened and contributes to T-cell lymphoblastic lymphoma development. Carcinogenesis. 2013;34:902–908. doi: 10.1093/carcin/bgs404. [DOI] [PubMed] [Google Scholar]
- 32.Sun Y., Oravecz-Wilson K., Mathewson N., Wang Y., McEachin R., Liu C., Toubai T., Wu J., Rossi C., Braun T. Mature T cell responses are controlled by microRNA-142. J. Clin. Invest. 2015;125:2825–2840. doi: 10.1172/JCI78753. [DOI] [PMC free article] [PubMed] [Google Scholar]
- 33.Li B., Wang X., Choi I.Y., Wang Y.C., Liu S., Pham A.T., Moon H., Smith D.J., Rao D.S., Boldin M.P., Yang L. miR-146a modulates autoreactive Th17 cell differentiation and regulates organ-specific autoimmunity. J. Clin. Invest. 2017;127:3702–3716. doi: 10.1172/JCI94012. [DOI] [PMC free article] [PubMed] [Google Scholar]
- 34.Zhou Q., Haupt S., Kreuzer J.T., Hammitzsch A., Proft F., Neumann C., Leipe J., Witt M., Schulze-Koops H., Skapenko A. Decreased expression of miR-146a and miR-155 contributes to an abnormal Treg phenotype in patients with rheumatoid arthritis. Ann. Rheum. Dis. 2015;74:1265–1274. doi: 10.1136/annrheumdis-2013-204377. [DOI] [PubMed] [Google Scholar]
- 35.Cao Y., Guo W.T., Tian S., He X., Wang X.W., Liu X., Gu K.L., Ma X., Huang D., Hu L. miR-290/371-Mbd2-Myc circuit regulates glycolytic metabolism to promote pluripotency. EMBO J. 2015;34:609–623. doi: 10.15252/embj.201490441. [DOI] [PMC free article] [PubMed] [Google Scholar]
- 36.Talebi F., Ghorbani S., Chan W.F., Boghozian R., Masoumi F., Ghasemi S., Vojgani M., Power C., Noorbakhsh F. MicroRNA-142 regulates inflammation and T cell differentiation in an animal model of multiple sclerosis. J. Neuroinflammation. 2017;14:55. doi: 10.1186/s12974-017-0832-7. [DOI] [PMC free article] [PubMed] [Google Scholar]
- 37.Zhang D., Lee H., Wang X., Groot M., Sharma L., Dela Cruz C.S., Jin Y. A potential role of microvesicle-containing miR-223/142 in lung inflammation. Thorax. 2019;74:865–874. doi: 10.1136/thoraxjnl-2018-212994. [DOI] [PMC free article] [PubMed] [Google Scholar]
- 38.Palmer D.C., Restifo N.P. Suppressors of cytokine signaling (SOCS) in T cell differentiation, maturation, and function. Trends Immunol. 2009;30:592–602. doi: 10.1016/j.it.2009.09.009. [DOI] [PMC free article] [PubMed] [Google Scholar]
- 39.Hoetzenecker K., Zimmermann M., Hoetzenecker W., Schweiger T., Kollmann D., Mildner M., Hegedus B., Mitterbauer A., Hacker S., Birner P. Mononuclear cell secretome protects from experimental autoimmune myocarditis. Eur. Heart J. 2015;36:676–685. doi: 10.1093/eurheartj/ehs459. [DOI] [PMC free article] [PubMed] [Google Scholar]
- 40.Caforio A.L.P., Pankuweit S., Arbustini E., Basso C., Gimeno-Blanes J., Felix S.B., Fu M., Heliö T., Heymans S., Jahns R. Current state of knowledge on aetiology, diagnosis, management, and therapy of myocarditis: a position statement of the European Society of Cardiology Working Group on Myocardial and Pericardial Diseases. Eur. Heart J. 2013;34:2636–2648. doi: 10.1093/eurheartj/eht210. 2648a–2648d. [DOI] [PubMed] [Google Scholar]
- 41.Weckbach L.T., Grabmaier U., Uhl A., Gess S., Boehm F., Zehrer A., Pick R., Salvermoser M., Czermak T., Pircher J. Midkine drives cardiac inflammation by promoting neutrophil trafficking and NETosis in myocarditis. J. Exp. Med. 2019;216:350–368. doi: 10.1084/jem.20181102. [DOI] [PMC free article] [PubMed] [Google Scholar]
- 42.Jensen L.D., Marchant D.J. Emerging pharmacologic targets and treatments for myocarditis. Pharmacol. Ther. 2016;161:40–51. doi: 10.1016/j.pharmthera.2016.03.006. [DOI] [PubMed] [Google Scholar]
- 43.Yeh E.T. Autoimmunity and the pathogenesis of myocarditis. Circulation. 1994;89:1318–1319. doi: 10.1161/01.cir.89.3.1318. [DOI] [PubMed] [Google Scholar]
- 44.Rose N.R. Learning from myocarditis: mimicry, chaos and black holes. F1000Prime Rep. 2014;6:25. doi: 10.12703/P6-25. [DOI] [PMC free article] [PubMed] [Google Scholar]
- 45.Grayson P.C., Eddy S., Taroni J.N., Lightfoot Y.L., Mariani L., Parikh H., Lindenmeyer M.T., Ju W., Greene C.S., Godfrey B., Vasculitis Clinical Research Consortium, the European Renal cDNA Bank cohort, and the Nephrotic Syndrome Study Network Metabolic pathways and immunometabolism in rare kidney diseases. Ann. Rheum. Dis. 2018;77:1226–1233. doi: 10.1136/annrheumdis-2017-212935. [DOI] [PMC free article] [PubMed] [Google Scholar]
- 46.Wang R., Green D.R. Metabolic checkpoints in activated T cells. Nat. Immunol. 2012;13:907–915. doi: 10.1038/ni.2386. [DOI] [PubMed] [Google Scholar]
- 47.Pearce E.L., Poffenberger M.C., Chang C.H., Jones R.G. Fueling immunity: insights into metabolism and lymphocyte function. Science. 2013;342:1242454. [Google Scholar]
- 48.Wahl D.R., Byersdorfer C.A., Ferrara J.L., Opipari A.W., Jr., Glick G.D. Distinct metabolic programs in activated T cells: opportunities for selective immunomodulation. Immunol. Rev. 2012;249:104–115. doi: 10.1111/j.1600-065X.2012.01148.x. [DOI] [PMC free article] [PubMed] [Google Scholar]
- 49.Wang L., Wang C., Jia X., Yu J. Circulating Exosomal miR-17 Inhibits the Induction of Regulatory T Cells via Suppressing TGFBR II Expression in Rheumatoid Arthritis. Cell. Physiol. Biochem. 2018;50:1754–1763. doi: 10.1159/000494793. [DOI] [PubMed] [Google Scholar]
- 50.Cui X., Liu Y., Wang S., Zhao N., Qin J., Li Y., Fan C., Shan Z., Teng W. Circulating Exosomes Activate Dendritic Cells and Induce Unbalanced CD4+ T Cell Differentiation in Hashimoto Thyroiditis. J. Clin. Endocrinol. Metab. 2019;104:4607–4618. doi: 10.1210/jc.2019-00273. [DOI] [PubMed] [Google Scholar]
- 51.Fong M.Y., Zhou W., Liu L., Alontaga A.Y., Chandra M., Ashby J., Chow A., O’Connor S.T., Li S., Chin A.R. Breast-cancer-secreted miR-122 reprograms glucose metabolism in premetastatic niche to promote metastasis. Nat. Cell Biol. 2015;17:183–194. doi: 10.1038/ncb3094. [DOI] [PMC free article] [PubMed] [Google Scholar]
- 52.Okoye I.S., Coomes S.M., Pelly V.S., Czieso S., Papayannopoulos V., Tolmachova T., Seabra M.C., Wilson M.S. MicroRNA-containing T-regulatory-cell-derived exosomes suppress pathogenic T helper 1 cells. Immunity. 2014;41:89–103. doi: 10.1016/j.immuni.2014.05.019. [DOI] [PMC free article] [PubMed] [Google Scholar]
- 53.Ding S., Zhang Q., Luo S., Gao L., Huang J., Lu J., Chen J., Zeng Q., Guo A., Zeng J., Lu Q. BCL-6 suppresses miR-142-3p/5p expression in SLE CD4+ T cells by modulating histone methylation and acetylation of the miR-142 promoter. Cell. Mol. Immunol. 2020;17:474–482. doi: 10.1038/s41423-019-0268-3. [DOI] [PMC free article] [PubMed] [Google Scholar]
- 54.Lai A.Y., Wade P.A. Cancer biology and NuRD: a multifaceted chromatin remodelling complex. Nat. Rev. Cancer. 2011;11:588–596. doi: 10.1038/nrc3091. [DOI] [PMC free article] [PubMed] [Google Scholar]
- 55.Zhong J., Yu Q., Yang P., Rao X., He L., Fang J., Tu Y., Zhang Z., Lai Q., Zhang S. MBD2 regulates TH17 differentiation and experimental autoimmune encephalomyelitis by controlling the homeostasis of T-bet/Hlx axis. J. Autoimmun. 2014;53:95–104. doi: 10.1016/j.jaut.2014.05.006. [DOI] [PubMed] [Google Scholar]
- 56.Lu L.F., Thai T.H., Calado D.P., Chaudhry A., Kubo M., Tanaka K., Loeb G.B., Lee H., Yoshimura A., Rajewsky K., Rudensky A.Y. Foxp3-dependent microRNA155 confers competitive fitness to regulatory T cells by targeting SOCS1 protein. Immunity. 2009;30:80–91. doi: 10.1016/j.immuni.2008.11.010. [DOI] [PMC free article] [PubMed] [Google Scholar]
- 57.Takahashi R., Nishimoto S., Muto G., Sekiya T., Tamiya T., Kimura A., Morita R., Asakawa M., Chinen T., Yoshimura A. SOCS1 is essential for regulatory T cell functions by preventing loss of Foxp3 expression as well as IFN-gamma and IL-17A production. J. Exp. Med. 2011;208:2055–2067. doi: 10.1084/jem.20110428. [DOI] [PMC free article] [PubMed] [Google Scholar]
- 58.Vallhov H., Gutzeit C., Hultenby K., Valenta R., Grönlund H., Scheynius A. Dendritic cell-derived exosomes carry the major cat allergen Fel d 1 and induce an allergic immune response. Allergy. 2015;70:1651–1655. doi: 10.1111/all.12701. [DOI] [PMC free article] [PubMed] [Google Scholar]
- 59.Wang C., Zhang C., Liu L., A X., Chen B., Li Y., Du J. Macrophage-Derived mir-155-Containing Exosomes Suppress Fibroblast Proliferation and Promote Fibroblast Inflammation during Cardiac Injury. Mol. Ther. 2017;25:192–204. doi: 10.1016/j.ymthe.2016.09.001. [DOI] [PMC free article] [PubMed] [Google Scholar]
- 60.Hobor F., Dallmann A., Ball N.J., Cicchini C., Battistelli C., Ogrodowicz R.W., Christodoulou E., Martin S.R., Castello A., Tripodi M. A cryptic RNA-binding domain mediates Syncrip recognition and exosomal partitioning of miRNA targets. Nat. Commun. 2018;9:831. doi: 10.1038/s41467-018-03182-3. [DOI] [PMC free article] [PubMed] [Google Scholar]
- 61.Alarcón C.R., Lee H., Goodarzi H., Halberg N., Tavazoie S.F. N6-methyladenosine marks primary microRNAs for processing. Nature. 2015;519:482–485. doi: 10.1038/nature14281. [DOI] [PMC free article] [PubMed] [Google Scholar]
- 62.Essandoh K., Yang L., Wang X., Huang W., Qin D., Hao J., Wang Y., Zingarelli B., Peng T., Fan G.C. Blockade of exosome generation with GW4869 dampens the sepsis-induced inflammation and cardiac dysfunction. Biochim. Biophys. Acta. 2015;1852:2362–2371. doi: 10.1016/j.bbadis.2015.08.010. [DOI] [PMC free article] [PubMed] [Google Scholar]
- 63.Thomou T., Mori M.A., Dreyfuss J.M., Konishi M., Sakaguchi M., Wolfrum C., Rao T.N., Winnay J.N., Garcia-Martin R., Grinspoon S.K. Adipose-derived circulating miRNAs regulate gene expression in other tissues. Nature. 2017;542:450–455. doi: 10.1038/nature21365. [DOI] [PMC free article] [PubMed] [Google Scholar]
- 64.Zeng Z., Li Y., Pan Y., Lan X., Song F., Sun J., Zhou K., Liu X., Ren X., Wang F. Cancer-derived exosomal miR-25-3p promotes pre-metastatic niche formation by inducing vascular permeability and angiogenesis. Nat. Commun. 2018;9:5395. doi: 10.1038/s41467-018-07810-w. [DOI] [PMC free article] [PubMed] [Google Scholar]
Associated Data
This section collects any data citations, data availability statements, or supplementary materials included in this article.