Abstract
Purpose
Early deep-learning-based image denoising techniques mainly focused on a fully supervised model that learns how to generate a clean image from the noisy input (noise2clean: N2C). The aim of this study is to explore the feasibility of the self-supervised methods (noise2noise: N2N and noiser2noise: Nr2N) for PET image denoising based on the measured PET data sets by comparing their performance with the conventional N2C model.
Methods
For training and evaluating the networks, 18F-FDG brain PET/CT scan data of 14 patients was retrospectively used (10 for training and 4 for testing). From the 60-min list-mode data, we generated a total of 100 data bins with 10-s duration. We also generated 40-s-long data by adding four non-overlapping 10-s bins and 300-s-long reference data by adding all list-mode data. We employed U-Net that is widely used for various tasks in biomedical imaging to train and test proposed denoising models.
Results
All the N2C, N2N, and Nr2N were effective for improving the noisy inputs. While N2N showed equivalent PSNR to the N2C in all the noise levels, Nr2N yielded higher SSIM than N2N. N2N yielded denoised images similar to reference image with Gaussian filtering regardless of input noise level. Image contrast was better in the N2N results.
Conclusion
The self-supervised denoising method will be useful for reducing the PET scan time or radiation dose.
Keywords: Positron emission tomography (PET), Denoising filter, Deep learning, Artificial neural network
Introduction
Positron emission tomography (PET) is a widely used medical imaging modality that uses radiotracers to measure various physiologic and biochemical processes in the body. However, limited spatial resolution and high noise levels are the main limitations of PET relative to other medical imaging modalities, such as computed tomography (CT) or magnetic resonance imaging (MRI). The noise level and image quality of the PET is mainly dependent on the amount of injected radiotracer and the duration of scanning. Given that the use of a larger amount of radiotracers causes high radiation exposure to patients, the radiotracer injection is limited to several MBq/kg. Although the counting statistics of PET images are enhanced by the longer scan time, the probability of patient motion that degrades image quality also increases and the throughput of PET examinations decreases.
The early deep learning-based image denoising techniques for natural and medical images mainly focused on the fully supervised model that learns how to generate clean (or less noisy) images from a noisy input (Noise2Clean or N2C). However, the N2C approach requires a large number of corresponding noisy and clean image pairs. Recently, self-supervised learning of denoising with only the noisy image pairs has gained increasing attention because the self-supervised learning techniques, such as Noise2Noise (N2N) [1] and Noiser2Noise (Nr2N) [2], do not require a clean image generation which is virtually impossible in clinical PET studies.
Given that the N2N network requires pairs of independent noisy images with identical distribution as input and target, we need to acquire the PET images at least twice with the assumption of no patient movement and no radiotracer distribution change. On the other hand, the Nr2N network does not require the paired dataset for network training because we use the noisy image as the target and the noisier image generated, by adding more noise to the target, as the input. Theoretically, the trained Nr2N network can reduce the noise from the given noisy input if the network is well trained with proper statistical noise modeling. However, the noise modeling of iteratively reconstructed PET images is not simple and the inter-subject variation of the noise level in PET images is significant [3].
Therefore, in this study, we explored the feasibility of the self-supervised methods (N2N and Nr2N) for PET image denoising based on the measured PET data sets by comparing their performance with the conventional N2C model. For the training and evaluation of the networks, we employed clinical list-mode PET data that allows for the generation of real independent noisy images with various noise levels.
Methods
Datasets
For training and evaluating the networks, 18F-FDG brain PET/CT scan data of 14 patients (8 males and 6 females, age = 50.9 ± 21.6 years) acquired using a Biograph mCT40 scanner (Siemens Healthcare, Knoxville, TN) was retrospectively used (10 for training and 4 for testing). The list-mode PET data were acquired 60 min after the intravenous injection of 18F-FDG (5.18 MBq/kg) for 5 min in a single bed position. From the list-mode data, we generated a total of 100 data bins with 10-s duration. There was approximately a 7 s overlap between the adjacent bins. We also generated 40-s-long data by adding four non-overlapping 10-s bins and 300-s-long reference data by adding all list-mode data. The retrospective use of the scan data and waiver of consent was approved by the Institutional Review Board of our institute.
The PET images were then reconstructed using an ordered-subset expectation-maximization algorithm (6 iterations and 21 subsets, no post-filter) in which CT-derived attenuation maps were used for attenuation and scatter corrections. Matrix and pixel sizes of the reconstructed PET images were 200 × 200 × 109 and 2.04 × 2.04 × 2.03 mm3, respectively.
Network Architecture and Training
We employed U-Net [4] that is widely used for various tasks in biomedical imaging [5–10] to train and test proposed denoising models: N2C, N2N, and Nr2N. Table 1 summarizes the details of the U-Net architecture used for this study. The DoubleConv3D consists of two consecutive layers of 3D convolution of kernel size 3, batch normalization, and rectified linear unit (ReLU). The dimension of input and output data was 32 × 32 × 32 extracted from the same position of images with different noise distribution. We used the image patches as input to reduce the risk of overfitting to the training dataset by increasing the amount of training data. For training, 1600 image patches were chosen randomly from each subject at every epoch. For the evaluation, 1600 images were used and each of them divided into 1352 patches with 14 × 14 × 11 stride. The value of the overlapping patches was averaged. As proposed in N2N, the mean square error (L2) was minimized by the network optimizer.
Table 1.
Details of the U-Net architecture
| Number | Layers | Input channels | Output channels |
|---|---|---|---|
| 1 | DoubleConv3D | 1 | 64 |
| 2 | MaxPool, size = 2 + DoubleConv3D | 64 | 128 |
| 3 | MaxPool, size = 2 + DoubleConv3D | 128 | 256 |
| 4 | MaxPool, size = 2 + DoubleConv3D | 256 | 256 |
| 5 | Upsample + concatenate (3) + DoubleConv3D | 512 | 128 |
| 6 | Upsample + concatenate (2) + DoubleConv3D | 256 | 64 |
| 7 | Upsample + concatenate (1) + DoubleConv3D | 128 | 64 |
| 8 | Conv3D, size = 1 | 64 | 1 |
Table 2 summarizes the scan duration of the input and target images used for the training of three denoising networks compared in this study. The pairs of temporally overlapped data were not used for the training of N2N networks to ensure the noise independency of the input and target. In the Nr2N network training, 40-s-long target images included corresponding 10-s-long images. At each iteration of training, different datasets were used to avoid the data dependency.
Table 2.
Scan duration (s) of input and target images used for training the denoising networks
| Model | Input | Target |
|---|---|---|
| Noise2Clean (N2C) | 40 | 300 |
| Noise2Noise (N2N) | 40 | 40 |
| Noiser2Noise (Nr2N) | 10 | 40 |
The mean μ and standard deviation σ for the input datasets of the three different schemes were calculated and used to standardize the data: z = (x − μ) / σ. The training and testing the networks were conducted using PyTorch. Constructed neural networks were trained for 60 epochs, and the batch size was 16. An Adam Optimizer was used, and the initial learning rate was 0.0001 which was gradually reduced using the “ReduceOnPlateau” learning rate scheduler in Pytorch.
Denoised Image Analysis
The denoising networks were applied to a total of 1600 images sets with various scan durations (10, 20, 30, and 40 s) obtained from the test set data. We calculated the peak signal-to-noise ratio (PSNR) and Structural Similarity Index (SSIM) with respect to the 300-s-long reference image as follows:
| 1 |
| 2 |
In Eq. (1), MAX is the maximum value of the reference image, and MSE is the mean square error between the reference and tested images. In Eq. (2), subscripts x and y refer to the images compared and μ and σ are mean and variance or covariance of the compared images. C1 and C2 are stability terms, where its values are calculated as C1 = (K1L)2 and C2 = (K2L)2. Here, L is the dynamic range of the voxel values. We use K1 = 0.01 and K2 = 0.03 as proposed in [11]. Although the reference image is not noise-free, these metrics show how well the networks reduce the noise in the given noisy images.
Results
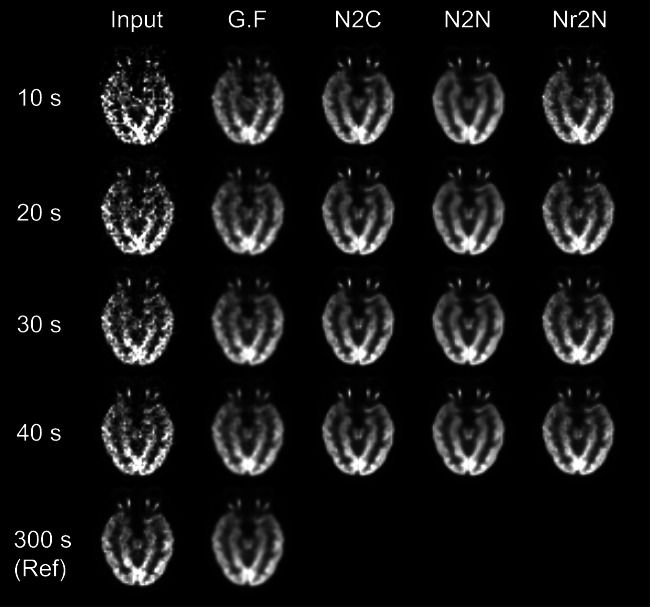
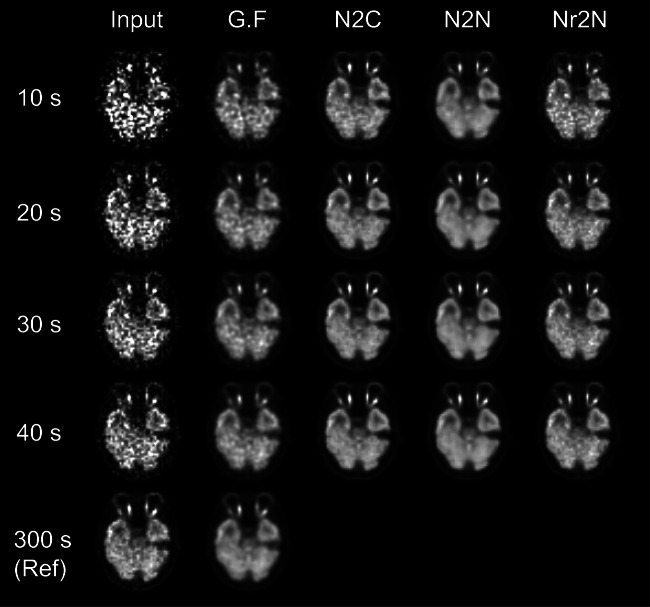
Figures 1 and 2 show the input noisy images with various scan duration and denoised images using Gaussian (FWHM = 5 mm), N2C, N2N, and Nr2N filters. PSNR and SSIM of noisy input and denoised outputs with respect to the 300-s-long reference image are summarized in Tables 3 and 4.
Fig. 1.
Input noisy images of a 53-year-old man with various scan duration and denoised images using Gaussian (FWHM = 5 mm), N2C, N2N, and Nr2N filters
Fig. 2.
Input noisy images of a 35-year-old woman with various scan duration and denoised images using Gaussian (FWHM = 5 mm), N2C, N2N, and Nr2N filters
Table 3.
PSNR (mean) of noisy input and denoised outputs with respect to the 300-s-long reference image
| Second | Input | N2C | N2N | Nr2N |
|---|---|---|---|---|
| 10 | 28.2 | 37.4 | 37.6 | 36.6 |
| 20 | 31.3 | 38.9 | 38.8 | 38.2 |
| 30 | 33.1 | 39.6 | 39.3 | 39.1 |
| 40 | 34.4 | 40.1 | 39.6 | 39.6 |
Table 4.
SSIM (mean) of noisy input and denoised outputs with respect to the 300-s-long reference image
| Second | Input | N2C | N2N | Nr2N |
|---|---|---|---|---|
| 10 | 0.937 | 0.982 | 0.980 | 0.979 |
| 20 | 0.957 | 0.987 | 0.983 | 0.984 |
| 30 | 0.967 | 0.988 | 0.984 | 0.987 |
| 40 | 0.973 | 0.989 | 0.985 | 0.988 |
All the N2C, N2N, and Nr2N were effective for improving the noisy inputs. While N2N showed equivalent PSNR to the N2C in all the noise levels, Nr2N yielded higher SSIM than N2N. N2N yielded denoised images similar to reference image with Gaussian filtering, which is commonly used in routine clinical practice, regardless of input noise level. Image contrast was better in the N2N results.
Discussion
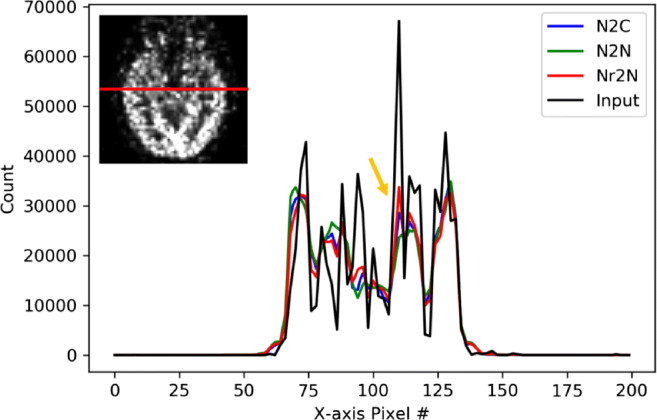
Figures 3 and 4 show the horizontal count profile on 10-s input image and denoised images using N2C, N2N, and Nr2N filters shown in Figs. 1 and 2. The red line indicates the cross-section of interest and the yellow arrow indicates the highest peaks of the input image. The Nr2N showed similar texture as the original input image.
Fig. 3.

Horizontal count profile on 10-s input image of a 53-year-old man and denoised images using N2C, N2N, and Nr2N filters
Fig. 4.

Horizontal count profile on 10-s input image of a 35-year-old woman and denoised images using N2C, N2N, and Nr2N filters
This would happen because of the learning nature of Nr2N. Let x + nr ∈ ℝn is a vector of a PET image of unit time frame where x is the ground truth and nr is the independent noise. Then, the Nr2N is training yi = f(xi + ni1; θ) in the problem of
| 3 |
Using the theorem proven by [12], if we let
| 4 |
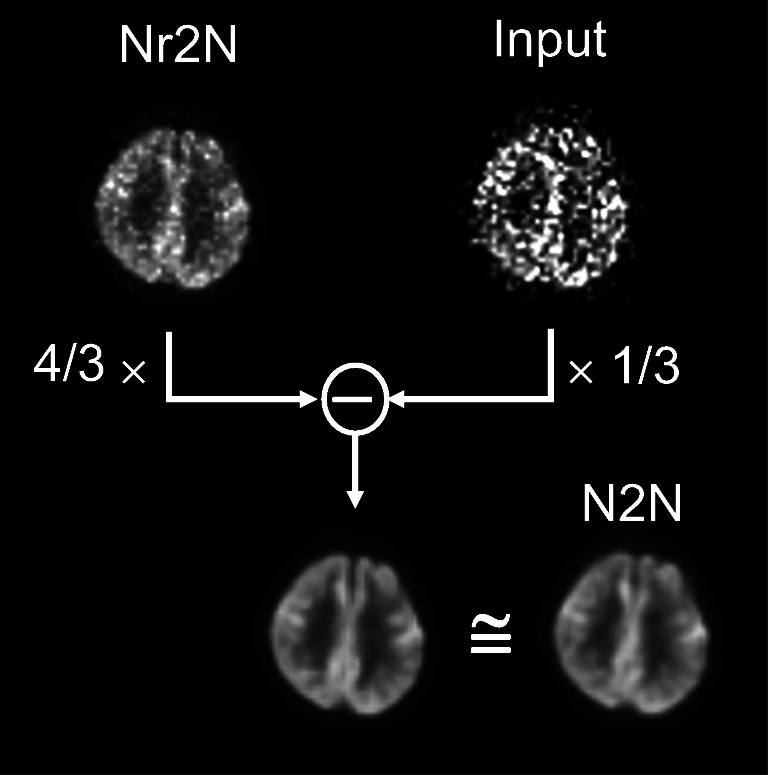
where I(∙) is the identity function regardless of the network parameter θ, the Nr2N becomes a variation of a N2N problem with network g(xi + ni1; θ) and a new noise of . Therefore, an ideal Nr2N neural network would follow the learning process of N2N while learning the identity function. Figure 5 shows that the difference image between the Nr2N output and noisy input that were weighted by the scan duration is equivalent to the N2N output, demonstrating such a relationship between the N2N and Nr2N networks trained in this study.
Fig. 5.

Equivalance of the difference image between the Nr2N output and noisy input that were weighted by the scan duration with the N2N output
In conclusion, the self-supervised denoising methods were useful for reducing the statistical noise in the short-frame PET images. N2N method that requires paired noisy data for network learning showed remarkable denoising performance. Nr2N network that can be trained only with a single noisy dataset maintains the noise texture of the input while being effective in reducing the noise. The self-supervised denoising method will be useful for reducing the PET scan time or radiation dose.
Funding
This work was supported by grants from National Research Foundation of Korea (NRF) funded by Korean Ministry of Science, ICT and Future Planning (grant no. NRF-2016R1A2B3014645).
Compliance with Ethical Standards
Conflict of Interest
Si Young Yie, Seung Kwan Kang, Donghwi Hwang, and Jae Sung Lee declare that there is no conflict of interest.
Ethical Approval
All procedures performed in studies involving human participants were in accordance with the ethical standards of the institutional and/or national research committee and with the 1964 Helsinki declaration and its later amendments or comparable ethical standards. The retrospective use of the scan data was approved by the Institutional Review Board of our institute.
Informed Consent
Waiver of consent was approved by the Institutional Review Board of our institute.
Footnotes
Publisher’s Note
Springer Nature remains neutral with regard to jurisdictional claims in published maps and institutional affiliations.
Contributor Information
Si Young Yie, Email: shanetoy@snu.ac.kr.
Seung Kwan Kang, Email: tmdrhks91@gmail.com.
Donghwi Hwang, Email: hwang0310@snu.ac.kr.
Jae Sung Lee, Email: jaes@snu.ac.kr.
References
- 1.Lehtinen J, Munkberg J, Hasselgren J, Laine S, Karras T, Aittala M, et al. Noise2Noise: learning image restoration without clean data. arXiv. 2018;1803.04189.
- 2.Moran N, Schmidt D, Zhong Y, Coady P. Noisier2Noise: learning to denoise from unpaired noisy data. arXiv. 2019;1910.11908.
- 3.Teymurazyan A, Riauka T, Jans H-S, Robinson D. Properties of noise in positron emission tomography images reconstructed with filtered-backprojection and row-action maximum likelihood algorithm. J Digit Imaging. 2013;26:447–456. doi: 10.1007/s10278-012-9511-5. [DOI] [PMC free article] [PubMed] [Google Scholar]
- 4.Ronneberger O, Fischer P, Brox T. U-net: convolutional networks for biomedical image segmentation. Pro Med Image Comput Comput Assist Interv. 2015:234–41.
- 5.Hegazy MAA, Cho MH, Cho MH, Lee SY. U-net based metal segmentation on projection domain for metal artifact reduction in dental CT. Biomed Eng Lett. 2018;9:375–385. doi: 10.1007/s13534-019-00110-2. [DOI] [PMC free article] [PubMed] [Google Scholar]
- 6.Hwang D, Kang SK, Kim KY, Seo S, Paeng JC, Lee DS, et al. Generation of PET attenuation map for whole-body time-of-flight 18F-FDG PET/MRI using a deep neural network trained with simultaneously reconstructed activity and attenuation maps. J Nucl Med. 2019;60:1183–1189. doi: 10.2967/jnumed.118.219493. [DOI] [PMC free article] [PubMed] [Google Scholar]
- 7.Lee MS, Hwang D, Kim HJ, Lee JS. Deep-dose: a voxel dose estimation method using deep convolutional neural network for personalized internal dosimetry. Sci Rep. 2019;9:10308. doi: 10.1038/s41598-019-46620-y. [DOI] [PMC free article] [PubMed] [Google Scholar]
- 8.Park J, Bae S, Seo S, Park S, Bang J-I, Han JH, et al. Measurement of glomerular filtration rate using quantitative SPECT/CT and deep-learning-based kidney segmentation. Sci Rep. 2019;9:4223. doi: 10.1038/s41598-019-40710-7. [DOI] [PMC free article] [PubMed] [Google Scholar]
- 9.Hwang D, Kim KY, Kang SK, Seo S, Paeng JC, Lee DS, et al. Improving the accuracy of simultaneously reconstructed activity and attenuation maps using deep learning. J Nucl Med. 2018;59:1624–1629. doi: 10.2967/jnumed.117.202317. [DOI] [PubMed] [Google Scholar]
- 10.Lee JS. A review of deep learning-based approaches for attenuation correction in positron emission tomography. IEEE Trans Radiat Plasma Med Sci. 2020. 10.1109/TRPMS.2020.3009269.
- 11.Wang Z, Bovik A, Sheikh H, Simoncelli E. Image quality assessment: from error visibility to structural similarity. IEEE Trans Image Process. 2004:600–12. [DOI] [PubMed]
- 12.Wu D, Gong K, Kim K, Li X, Li Q. Consensus neural network for medical imaging denoising with only noisy training samples. Proc Med Image Comput Comput Assist Interv. 2019:741–9.


