

Abstract
Abstract
Purpose
Electromembrane extraction is a new membrane-based extraction method in which charged compounds are extracted by an electric field. So far, this method has been used to extract and isolate a variety of acidic and basic drugs from various samples, including blood and plasma. However, in this procedure, it is not yet clear whether only unbound fraction of a drug is extracted or the total drug. The aim of this study is to reveal the nature of drug extraction in the presence of plasma proteins.
Methods
To determine the nature of the extraction, the electromembrane extraction was performed from plasma solutions of phenytoin with concentrations 0.03 and 1.0 μg/mL, then the result was compared with the values obtained from the electromembrane extraction of ultrafiltrate of the same solutions (free concentration) and protein-free ultrafiltrate of plasma with final concentration of 0.03 and 1.0 μg/mL (total concentration). For this purpose, EME followed by capillary electrophoresis coupled with diode array detection was optimized and validated.
Results
The results showed that the electromembrane extraction method was only able to extract the unbound fraction of phenytoin from plasma samples. The method was validated over a concentration range of 0.03–4 μg/mL. The inter and intra-assay precisions were less than 6.7%. The phenytoin protein binding was also determined to be in agreement with the literature data and confirms the validity of this method.
Conclusion
This sensitive and quick EME approach for determining the free concentration of a phenytoin, can be a good alternative to classic methods for therapeutic drug monitoring and pharmacokinetic studies.
Graphical abstract

Keywords: Antiepileptic, Microextraction, Plasma protein binding, Unbound fraction
Introduction
Phenytoin (PHT) is one of the most widely used antiepileptic drug which is used in all types of epilepsy except absent seizure [1]. But since the PHT therapeutic index is narrow, therapeutic drug monitoring (TDM) is needed to reduce its side effects and increase therapeutic effects. Since the therapeutic range for total PHT is 10 to 20 μg/mL and protein binding approximately 90%, so the free concentration is in the range of 1.0 to 2.0 μg/mL [2]. For TDM, the drug concentration is measured in whole blood, serum or plasma samples. But given that drugs in the blood are available in both the free (unbound) and bound (by protein) fractions and only the free drug is pharmacologically active, as a result, the therapeutic range of a drug is better expressed in terms of the concentration of free drug. Especially for high protein binding drugs like PHT [3, 4]. However, it is difficult to measure the free drug concentrations in these samples. Therefore, the therapeutic ranges of drugs are usually expressed in terms of total concentration. Nevertheless, in the case of PHT, several papers have been published indicating that the free concentration of PHT has a better correlation with the therapeutic efficacy and toxicity than the total concentration. Especially for patients with uremia and liver disease and in the presence of some known conditions, that is, hypercholesterolemia, hypoalbuminemia and interaction with other high protein-bound drugs [5–19].
Two steps are required to determination of free drug concentration. Firstly the separation of the free and bound fractions. Variety of methods are available for determining the free drug concentration in plasma, including equilibrium dialysis (ED), ultrafiltration (UF), ultracentrifugation (UC), microdialysis and parallel artificial membrane permeation assay (PAMPA). ED is the most widely used method to determination of free drug concentration and study of drug–protein interactions as the reference method. However, it suffers from many drawbacks, including long equilibration times (typically 12–48 h) [20], volume shift [21], nonspecific adsorption of drugs on the dialysis membrane [22] and the Donnan effect [23]. UF is a faster method than dialysis but like dialysis, there are several disadvantages such as the Donnan effect, nonspecific binding and protein leakage [24]. UC does not have the disadvantages of Donnan effect and membrane adsorption due to the absence of the membrane. However, the equipment used for UC is expensive. There are also some other disadvantages such as sedimentation and back diffusion [25, 26]. All techniques are well reviewed in the literature [24, 27]. So far, plasma free PHT concentration has been quantified by ED, UF and gel permeation chromatography methods [28–31]. PAMPA is a kind of three phase liquid-liquid microextraction in which compounds are extracted based on passive diffusion into the acceptor phase. PAMPA was originally devised to predict of drugs passive permeability through biological membranes. But, for the first time the use of a PAMPA to measure binding constants was reported by Làzaro et al. [32]. In this method, a thin liquid membrane coated on a porous filter is used to separate sample solution (donor phase) and buffer solution (acceptor phase) compartments. This method has several important advantages over the above mentioned methods including faster than traditional ED, no change in the volume of oncotic pressure due to water impermeable membrane and self-corrected nonspecific adsorption [24]. However, this method also takes a long operation time (about 2 h) [32].
The EME method was introduced for the first time in 2006 [33]. In EME, the charged compound is extracted from the donor aqueous phase to the acceptor aqueous phase under the influence of an electric field and through a supported liquid membrane (SLM). EME like PAMPA is a three-phase liquid-liquid microextraction method, except where the electric field is applied. Consequently given that in the EME, compounds are extracted under electric field and by active diffusion, so EME is a fast and highly selective method for complex matrices such as whole blood and plasma compared to PAMPA [33]. On the other hand, EME due to the small volume of the acceptor phase yields large enrichment factors (EF) which increases the sensitivity of the method.
The second step for determination of free drug concentration is a separation and quantification of the desired drug in the presence of other substances. Spectroscopic methods, chromatographic and related techniques are commonly used for this purpose. The use of spectroscopic approaches is limited because of the low sensitivity and poor selectivity [22]. On the other hand; capillary electrophoretic techniques have advantages such as high efficiency and separation selectivity, low sample and reagent consumption, high speed of analysis and ease of automation that makes them a favorite method. However, capillary electrophoresis (CE) also has limitations, such as the risk of adsorption of protein on the capillary wall and also low sensitivity of commonly used UV detectors [24], but its combination with EME that has a high EF and efficient clean-up, eliminates these limitations.
According to aforementioned points, a method that does not have the disadvantages of membrane-based methods such as ED and UF is needed to separate free drug fraction. On the other hand, the method should be capable of concentrating the drug so that drugs that are in low concentration due to high protein binding or low dosage can be detected [31].
The aim of this study was to investigate the extraction mechanism in EME whether this method extracts only free drug fraction or whether in the presence of the electric field the bound fraction is removed from the protein and the whole drug is extracted. To this end, an experiment was designed to obtain the extraction mechanism. Therefore, a method for the determination of the free fraction of PHT in plasma was developed employing EME for separation and CE- diode array detection (CE-DAD) for quantitation of the unbound drug. As well as protein binding for PHT was obtained using this method.
Experimental
Chemicals and reagents
Sodium phenytoin was kindly supplied by Alhavi pharmaceutical company (Tehran, Iran). Analytical grade acetone, 1-octanol, ethanol and sodium hydroxide were purchased from Merck (Darmstadt, Germany). Deionized water was obtained from Shahid Ghazi Pharmaceutical Company (Tabriz, Iran).
Standard solutions and biological matrices
Two separate stock solutions of 1 mg/mL PHT in ethanol were used for preparation of calibration standards and quality control samples (QCs) and were stored at 4 °C protected from light. Drug-free human plasma was obtained from Iranian Blood Transfusion Organization (Tabriz, Iran), and was stored at −20 °C protected from light and thawed before use. Plasma dilution was used in the current study to minimize matrix effect. All working standard solutions of plasma and QCs were prepared daily by dilution of the stock solution in plasma:water (1:4, v:v).
Equipment for EME
The sample compartment was a 7 mL homemade glass, screw-capped vial with internal diameter of 10 mm and height of 7 cm. The porous hollow fiber used for housing the acceptor solution was a PP Q3/2 polypropylene hollow fiber (Membrana, Wuppertal, Germany) with an internal diameter of 0.6 mm, wall thickness of 200 μm, and a pore size of 0.2 μm. The DC power supply used was a PS858 model (S.KAR, Tabriz, Iran) with programmable voltage in the range of 0–300 V, and with a current output in the range 0–1000 mA. Platinum wires (diameter of 0.2 mm) with an average inter-electrode distance of 3 mm were used as electrodes in the sample and acceptor solutions and were connected to the power supply. A multimeter Model M890C+ (Zhangzhou Weihua Electronic Co., Ltd. China) was used for current monitoring during extraction. During the experiments, the sample solution was stirred using a 50×2 mm magnetic bar by a heater-magnetic stirrer model RCT basic from IKA Company (Germany).
EME procedure
Hollow fibers were cut into 40 mm pieces, washed with acetone in an ultrasonic bath and dried; the upper end of fiber was connected to a spinal needle tip as a guiding tube. Then, to impregnate the organic solvent in the pores of hollow fiber, the prepared fiber was placed in 1-octanol for 10 s. Excess of solvent in the lumen and surface of hollow fiber was then removed by blowing with a medical syringe and medical wipe, respectively. 10 μL of acceptor phase (pH 13.0 aqueous solution) was introduced into the lumen of the hollow fiber via the guiding tube, by a microsyringe and then the lower end of hollow fiber was sealed with a small piece of nonconductive plastic bar. 3.5 mL sample solution with pH 11.0 was filled into a glass vial (sample compartment). The hollow fiber and the negative electrode were inserted into the sample solution, and through a guiding tube, the positive electrode was located into the acceptor solution. Subsequently, the electrodes were connected to the power supply, and a voltage of 15 V was applied between two electrodes and the extraction was carried out for 15 min. During the extraction, the sample solution was agitated at 750 rpm. Finally, the hollow fiber was taken out and the acceptor solution was collected using a microsyringe and placed into a CE microvial to be injected into the CE system through the autosampler unit.
Capillary electrophoresis conditions
The CE analyses were performed on an Agilent capillary electrophoresis system equipped with a DAD (190–600 nm). Data acquisition was performed using ChemStation (Agilent Technologies). The separations were performed on a 48.5 cm bare fused silica capillary with 40 cm effective length and an internal diameter of 50 μm (Agilent Technology, Waldbronn, Germany). Prior to the first use, the capillary was washed with 1 M NaOH for 30 min, deionized water for 30 min and background electrolyte (BGE) solution for 30 min. At the beginning of each day, the capillary was washed with 0.1 M NaOH for 10 min, deionized water for 10 min and BGE solution for 10 min. Between runs, the capillary was flushed with 0.1 M NaOH for 2 min, deionized water for 2 min and BGE solution for 4 min. The capillary was flushed for 10 min with DI water and the capillary tips were kept inside DI water vials at the end of a working day. The optimal conditions of electrophoretic separation were as follow; the BGE solution was a 150 mM borate buffer adjusted to pH 9.3, sample injections were performed hydrodynamically at a pressure of 0.5 psi for 10 s. A constant voltage of +25 kV was applied during the analyses and the capillary temperature was set at 25 °C. Before use, all BGE and rinsing solutions were filtered through a 0.20 μm pore size PTFE syringe filter (Chromafil, Germany). Detection of the PHT was set at 200 nm.
Sample preparation for total and unbound PHT with UF
In order to obtain unbound PHT fraction, a 5 mL PHT-spiked plasma sample at two concentrations (0.03 and 1.0 μg/mL) with pH 11.0 was added to the sample reservoir of the UF with an Amicon Centrifree® Filter System (molecular weight cut off 30 kDa) to separate the unbound drug from the protein-bound drug in plasma. Subsequently, sample-filled devices were counterbalanced in a centrifuge rotor containing adapters. The samples were centrifuged at 5000 g for 10 min. After repeating this step for five times, approximately 20 mL of ultrafiltrate of free PHT was collected in the collection tube. The same route was taken to obtain protein-free ultrafiltrate with the difference that there was no PHT in the sample solution. The driving force for ultrafiltration was provided by centrifugation (Universal 320 centrifuge, Hettich, Germany). To investigate the nonspecific adsorption of ultrafiltration membranes, the aqueous solution of PHT with concentration of 1 μg/mL (pH = 11.0) was injected directly into the CE before and after filtration and their peak areas was compared.
Determination of EME extractability from plasma samples for unbound and bound fractions
Some papers have suggested that applying an electric field in EME would reduce the protein binding of drug [34]. In other words, in the presence of an electric field the protein-bound fraction is detached from the protein and extracted by EME. But a large number of literature indicate that recovery for drugs with high protein binding are lower than for drugs with low protein binding [35–37]. This means that only the free fraction of the drug in plasma is extracted, not the total drug or it may be an intermediary between the two. To understand this, we designed an experiment that once EME was performed from the free PHT solutions (free drug) obtained in section (sample preparation for total and unbound PHT with UF). Once again, EME was performed from the total drug (PHT-spiked protein-free ultrafiltrate) solutions with a final concentrations of 0.03 and 1.0 μg/mL. In addition, these results were compared with the results obtained from EME of PHT from plasma samples at concentrations of 0.03 and 1.0 μg/mL. If the result obtained for the plasma sample is the same as that obtained for the free drug concentration, it shows that the EME only extracts unbound fraction. If the obtained value is greater, then it can be deduced that in the presence of the electric field the PHT is detached from the protein. Moreover, if it is equal to the value obtained for the total concentration of the PHT, that is, the electric field can detach all the protein bound drugs.
Calculation of plasma protein binding
By knowing the free and total concentrations of a drug in plasma, the plasma protein binding (PPB) can be calculated using:
| 1 |
In section (determination of unbound fraction of PHT), it is shown that EME can extract unbound fraction of the drug, and only the free drug concentration can be extracted and measured by this method. Therefore, for the analysis of the unbound concentrations of PHT, EME was realized from plasma samples and for the analysis of total concentrations of PHT, protein-free ultrafiltrate of plasma sample was spiked with PHT at concentrations of 0.03 and 3.0 μg/mL and then EME was performed. As in dilute plasma solutions, the concentration of free drug is increased. So, in order to calculate PPB for undiluted plasma from the data obtained for diluted plasma, Musteata et al. proposed a simple model for determination of drug plasma protein binding by solid phase microextraction (SPME). Due to the fact that the extraction bases in both SPME with liquid coatings and EME methods is similar and based on the distribution of the drug between the sample solution and the sorbent phase. Therefore, the same concepts will be used to calculate the protein binding here, which are as follows: considering whole plasma as a matrix of single binding proteins (P) with the concentration of Cp and the binding constant of K between drug (D) and matrix. Since the free and bound drug in the presence of P are in equilibrium, then the equilibrium equation for binding constant (K) can be written as follows [38]:
| 2 |
when the drug concentration (Ctotal) is very low compared to the protein concentration (Cp), (Ctotal − Cfree = Cbound) is negligible with respect to (Cp) and Eq. 2 becomes
| 3 |
This assumption applies in cases where the concentration of the drug is much lower than the concentration of proteins, in other words, in experiments where plasma dilution factor is low, such as in the present work. Some studies suggest that binding sites are not limited even at higher plasma dilutions and higher drug concentrations [38, 39]. From the rearrangement of Eq. 1 we have:
| 4 |
by dividing the numerator and the denominator of the Eq. 3 by Cfree then by inversing the sides of the equation:
| 5 |
Finally, the value of PPB% can be easily deducted from combining of Eqs. 4 and 5:
| 6 |
It is obvious that by diluting the plasma d times, Cp becomes Cp/d and Eq. 6 can be written as:
| 7 |
The value of PPBd%can be determined experimentally for diluted plasma, and since the product Cp × K is the same in Eqs. 6 and 7; so, Cp × K can be obtained from Eq. 7 and then introduced into Eq. 6 for calculating PPB% for undiluted plasma:
From Eq. 7
| 8 |
And by putting the equivalent of Cp × K in Eq. 6:
| 9 |
As a result, the protein binding for undiluted plasma is easily obtained from Eq. 9 by the use of protein binding in diluted plasma sample.
Method validation
To quantify the unbound PHT fraction in plasma was necessary to validate bioanalytical method. The method was validated according to the ICH guidelines with respect to linearity, accuracy and precision, selectivity, specificity, recovery, dilution integrity, carry-over and stability [40].
Human samples
The method was applied to the analysis of PHT in plasma samples taken from patients receiving the drug. The study was approved by the Ethics Committee of Tabriz University of Medical Sciences (code of ethics committee: IR.TBZMED.REC.1398.406) and competent authorities and performed in accordance with the Declaration of Helsinki. A signed written informed consent form was obtained from patients or their parents.
Results and discussion
Optimization of EME conditions
In a previous work, the variables affecting the EME of PHT from aqueous solution were investigated and optimum conditions were obtained [41]. In the present work, since the extraction was performed from the plasma, several experiments were tested to find new optimal conditions in this matrix. For this purpose, the one-factor-at-a-time (OFAT) strategy was used to investigate the effect of changing each of the variables on the response around the former optimal conditions. The results showed that the optimum conditions in the plasma sample did not differ from that of the aqueous sample (data not shown), so the same conditions were used to continue. The optimal conditions are as follows: extraction time of 15 min, stirring speed of 750 rpm, pH of donor 11.0, pH of acceptor 13.0 and extraction voltage of 15 V.
Validation
Calibration curve and range
A calibration curve was plotted with eight calibration points (n = 3) over a concentration range of 0.03–4 μg/mL for PHT. An acceptable linear range (0.03–4 μg/mL) and linearity of 0.9998 were obtained which covers the therapeutic range of free PHT concentration. The representative regression equation of PHT was Y = 403.8X −1.39. A signal-to-noise ratio (S/N) of three was used for estimating limit of detection (LOD) and was 0.005 μg/mL. Lower limit of quantification (LLOQ) was the concentration providing accuracy and precision within ±20%, and at least an S/N of 10. The upper limit of quantification (ULOQ) is the highest concentration of the calibration curve which its accuracy and precision should be within ±20%. LLOQ and ULOQ were 0.03 and 4 μg/mL, respectively.
Selectivity and specificity
The selectivity of the method was determined using drug-free plasma from six different sources. For this purpose, the samples were extracted as described in section (EME procedure) and then analysed. The selectivity of the method was evaluated by comparing electropherograms of blank drug-free plasma samples and plasma spiked with PHT at LLOQ level. No interfering peaks of the endogenous components were found at the migration time of PHT in the electropherograms of blank samples. The specificity assay was established using four potentially co-administered drugs, which are used in neurosurgical patients, including ranitidine, dexamethasone, vancomycin and clindamycin. For this purpose, four drugs were spiked in drug-free plasma at concentration of 0.1 μg/mL and then EME was performed. No interfering peak was observed for PHT.
Accuracy and precision
Repeatability (intra-day precision, n = 5), reproducibility (inter-day precision, n = 15) and accuracy of the method were evaluated at three concentration levels of QC samples (LLOQ, LQC and ULOQ). Acceptable accuracy (bias within ±15% or ± 20% at the LLOQ) and precision (RSD ≤ 15% or ≤ 20% at the LLOQ) for the determination of PHT in plasma were demonstrated. The results are reported in Table 1.
Table 1.
Precision and accuracy for EME of PHT from plasma samples
| Nominal concentration (μg/ mL) |
Measured concentration (mean ± SD) |
RSD% | RE%a | |
|---|---|---|---|---|
| Intra-day (n = 5)b | 0.03 | 0.033 ± 0.0012 | 3.63 | +10.00 |
| 0.10 | 0.088 ± 0.0059 | 6.70 | −12.00 | |
| 4.00 | 4.00 ± 0.064 | 1.60 | 0.00 | |
| Inter-day (n = 3)c | 0.03 | 0.032 ± 0.0016 | 5.00 | +6.67 |
| 0.10 | 0.089 ± 0.0057 | 6.40 | −11.00 | |
| 4.00 | 4.01 ± 0.089 | 2.21 | +0.25 |
a
bn = Sample number
cn = Day number
Recovery
The absolute recovery of PHT in plasma was calculated by comparing the peak areas ratio of spiked samples before and after the extraction at two QC levels (LLOQ and ULOQ, n = 5). For this purpose, the acceptor solution of EME at concentrations of 0.03 and 4 μg/mL were injected directly into the CE. Then, the plasma solutions with the same concentrations were injected after EME. The mean recovery and its corresponding EF were 8% and 28, respectively.
Carry-over
The carryover was assessed by analysing of three EME from blank plasma samples after the analysing of the three EME from highest calibration sample (ULOQ). No peak was observed at the migration time of PHT. Therefore, no carryover was detected for the PHT.
Dilution integrity
As regards, in current work diluted plasma solution (plasma:water, 1:4, v:v) was used in all experiments. So, the integrity of the dilution should be monitored. For this purpose, first, a solution of whole plasma was prepared at concentration of 20 μg/mL of PHT, then 1 mL of this solution was diluted to final volume 5 mL by water and pH was adjusted to 11.0. Subsequently, EME was performed from this diluted solution (five replicate). The results obtained were precise (2.3%) and accurate (1.6% bias).
The stability of PHT in different conditions
-
Stability of stock solution
The stability of stock solution of PHT was assessed by the direct injection of a freshly diluted solution (t = 0) and diluted solution from stock solution after 30 days storage at 4 °C with a concentration of 1 μg/mL and then the detector response was compared for them (n = 5). A paired t-test was used to compare the mean of the measurements at the confidence level of 95%. The results showed that there was no significant difference between the averages and the stock solution was stable for at least one month.
-
Bench top and freeze thaw stability
The stability of PHT in plasma was investigated after QC samples had been exposed to two different conditions, including storage at room temperature (30 °C) for 5 h and after four freeze-thaw cycles. For freeze-thaw, the QC samples were frozen at −20 °C for a minimum of 12 h and then thawed at room temperature for 2 h. By analysing two different QC samples (LQC and ULOQ; five replicates per level) under these condition, the stability of PHT was demonstrated and the precision (RSD %) and accuracy (relative error) are allowed within ±15%. The results are shown in Table 2.
Table 2.
Results of stability for the analysis of unbound PHT in human plasma
| Storage condition | Nominal concentration (μg/mL) |
Calculated concentration (μg/mL) |
Relative error (RE %) |
Precision (RSD %) |
|---|---|---|---|---|
| −20 °C /4 freeze-thaw cycles | 0.10 | 0.09 | −10.00 | 6.30 |
| 4.00 | 4.28 | +7.00 | 3.00 | |
| 5 h at room temperature | 0.10 | 0.092 | −8.00 | 5.70 |
| 4.00 | 4.17 | +4.25 | 3.20 |
Application to clinical samples
The current method for the extraction of unbound fraction of PHT, as well as the CE-DAD methodology for the quantification of unbound concentration of PHT have been successfully applied to the samples from the neurosurgery patients. Blood samples from patients were collected into sodium citrate tubes after 1 h of PHT administration in the morning. Immediately after collection, the samples were centrifuged at 6000 rpm for 15 min. The obtained plasma was then subjected to EME. Concentrations of the PHT were obtained in patients in the range of 0.2–1.1 μg/mL. Figure 1 shows the electropherograms obtained for patients.
Fig. 1.
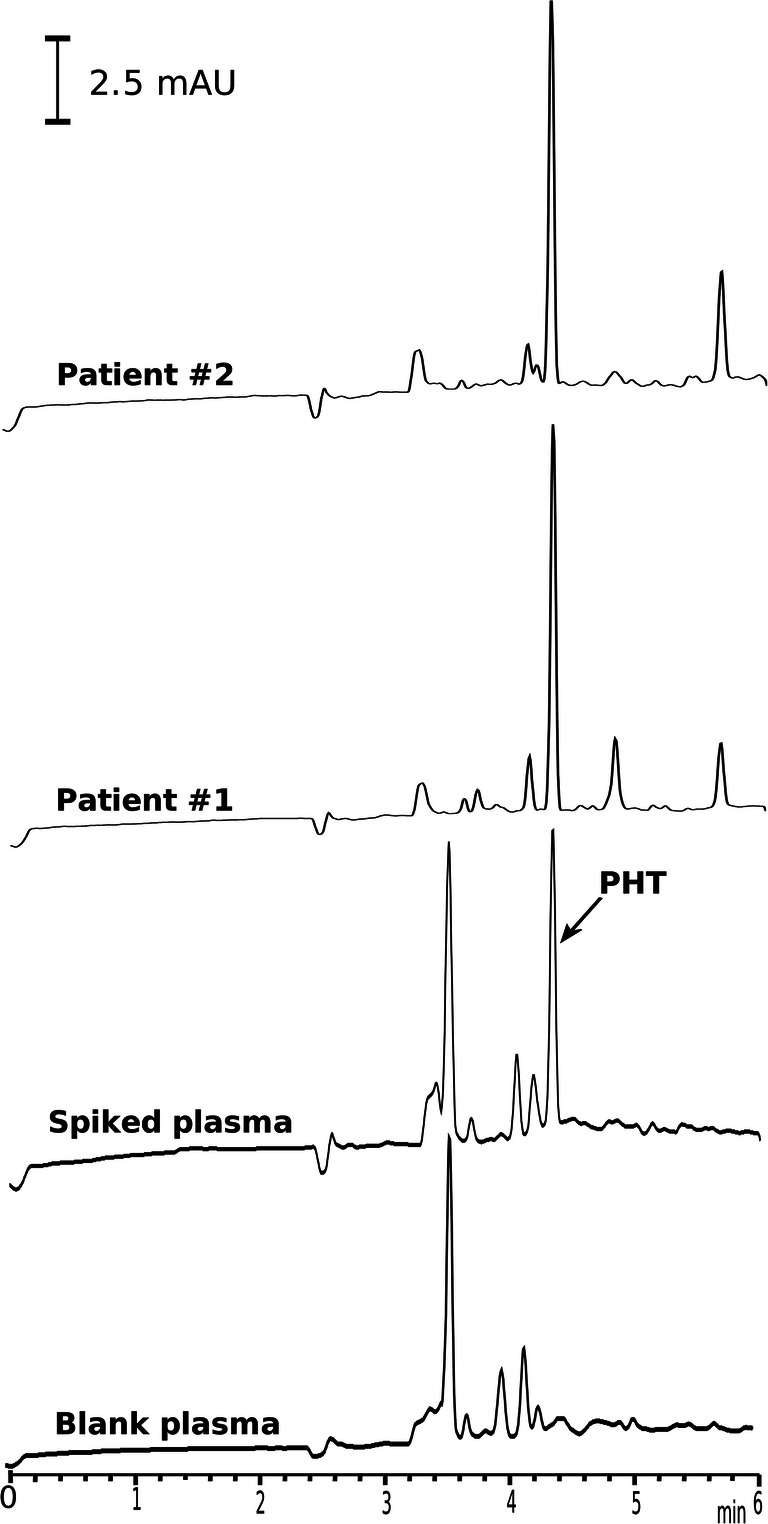
Electropherograms of blank plasma sample, spiked plasma sample with PHT and real plasma samples of patients after EME under optimal conditions
Determination of unbound fraction of PHT
The results of experiments in section (determination of EME extractability from plasma samples for unbound and bound fractions) showed that the extraction values for PHT from PHT-spiked plasma and ultrafiltrate of PHT-spiked plasma (free drug) were the same. The equality of these two values indicates that EME can only extract the free fraction of the drug and has no effect on the bound fraction. Thus, EME is a method for determination of the free concentration of drug in the plasma sample. In this respect, it has advantages over conventional methods. As in this method, organic solvent is used as SLM which is immiscible with water, so the water cannot pass through it and thus there will be no change in the donor and acceptor volume due to the flow of water under oncotic pressure. As a result, given that all calculations performed through the calibration curve under optimal conditions, non-specific binding to the SLM are self-corrected and will not affect the results. On the other hand, applying the electric field in the extraction process increases the extraction kinetics and thereby decreases the extraction time and also increases the selectivity of the method. According to the mentioned characteristics, EME can be a suitable technique to extract free concentration of the drug from other biological samples such as whole blood and urine. Due to the low volume of the acceptor phase used in this method, a high EF is obtained which enables the coupling of this method to instruments with low sensitivity detectors. This feature is especially important for drugs with high protein binding that their free concentration is very low.
Protein binding determination
From Eq. 6, it can be seen that at very low concentrations of drug relative to protein, the value of PPB is independent of drug concentration and only depends on the protein concentration. Subsequently, PPB changes significantly when protein concentration changes. Also, most binding studies indicate the expected decrease in PPB when plasma is diluted [42–45]. As a result of dilution, the plasma protein concentration decreases, leading to increased free drug concentration and reduced protein binding. Plasma dilution was used in the current study to reduce the matrix effect. Based on what is described in section (determination of EME extractability from plasma samples for unbound and bound fractions), the free PHT concentrations were obtained by EME from plasma samples at concentrations 0.03 and 1.0 μg/mL and the total concentration of PHT was obtained by EME from PHT-spiked protein-free ultrafiltrate of plasma solutions at concentrations 0.03 and 1.0 μg/mL. Consequently, with the free and total concentration of the PHT, PPB% can be obtained using Eq.1 which in this work represents the extraction in diluted solution, then Eq. 9 can be used to convert the obtained value into protein binding in undiluted plasma. As mentioned, first the free and total concentrations of PHT were determined by EME in diluted plasma samples at concentrations 0.03 and 1.0 μg/mL, then by using Eq. 1 the protein binding for PHT was obtained 65.40 and 68.75, respectively. Subsequently, by placing these values instead of PPBd%and 5 (dilution factor) instead of d in Eq. 9 protein binding was obtained 90.43 and 91.66, respectively for undiluted plasma. According to the results of protein binding data, it is observed that by diluting, the concentration of plasma proteins decreases and as a result, PPB% decreases. Therefore, corrected equations should be used in studies with protein binding in diluted plasma solutions. PPB% values obtained with the current EME method (90.43 and 91.66) correlate well with average literature values [46–49]. Also, based on the results, no non-specific adsorption of the PHT to UF membrane was observed (data not shown).
Comparison of the proposed method with others
Comparison of important analytical parameters of the developed EME-CE-DAD method with those reported in the literature for measuring PHT in plasma samples (Table 3) shows that the sensitivity of this method is higher than other methods and also exhibits wide dynamic linear range and good repeatability (RSD%). Hence, the proposed method can be suitable for TDM.
Table 3.
Comparison of the EME-CE-DAD method with other methods for determination of the PHT in plasma samples
| Method | Linear range (μg/mL) | LOD (μg/mL) | LOQ (μg/mL) | RSD% | Ref. |
|---|---|---|---|---|---|
| DLPME-SI-SFOD-HPLC-UV a | 2.0–400 | 0.65 | 2.20 | 4.10 | [50] |
| DMSPE-HPLC-UV b | 3.0–500 | 0.80 | 2.80 | 4.50 | [51] |
| MEPS-HPLC-DAD c | 0.3–30 | 0.05 | 0.30 | ˂ 6.20 | [52] |
| MIPSPE-HPLC-UV d | 2.5–40 | ___ | 2.50 | ˂ 12.80 | [53] |
| SFODM-HPLC-UV e | 1.0–200 | 0.30 | 1.00 | 4.60 | [54] |
| SPME-HPLC-UV f | 2.0–40 | 2.00 | 5.00 | ˂ 15 | [55] |
| SPME-GC-TSD g | 0.05–25 | ___ | 0.05 | ˂ 6.77 | [56] |
| EME-CE-DAD h | 0.03–4.0 | 0.005 | 0.03 | ˂ 6.70 | This work |
aDispersive liquid phase microextraction-sequential injection-solidified floating organic drop-high performance liquid chromatography-ultraviolet
bDispersive micro-solid phase extraction-high performance liquid chromatography-ultraviolet
cMicroextraction by packed sorbent-high performance liquid chromatography-diode array detection
dMolecularly imprinted solid-phase extraction-high performance liquid chromatography-ultraviolet
eSolidified floating organic drop microextraction-high performance liquid chromatography-ultraviolet
fSolid-phase microextraction-high performance liquid chromatography-ultraviolet
gSolid-phase microextraction-gas chromatography-thermionic specific detector
hElectromembrane extraction-capillary electrophoresis-diode array detection
Conclusions
EME method for the measurement of free PHT fraction in human plasma was successfully developed and validated. Due to the clinical importance of therapeutic drug monitoring in patients as well as pharmacokinetic studies of drugs in both drug discovery and in clinical phases of drug development, there is an increasing need to measurement of drug free concentration. This study details a new approach for determining the free fraction of drug based on the partitioning of a drug between a hollow fiber and plasma matrix. As regards in EME, a water-immiscible membrane is used, as a result, some of the most important limitations of currently available methods such as volume shift and protein leakage, for determination free concentration of drugs have been eliminated. On the other hand, due to the use of electric field in this method, the extraction time is much shorter than other methods. Also using EME, the protein binding for PHT was obtained which indicates the accurate estimation of this method.
Acknowledgments
This report is a part of the results of B. Seyfinejad’s PhD thesis submitted to the Faculty of Pharmacy, Tabriz University of Medical Sciences, Tabriz, Iran. Partial financial support under grant number of 61555 is acknowledged.
Compliance with ethical standards
Conflict of interest
The authors claim no conflict of interest.
Footnotes
Publisher’s note
Springer Nature remains neutral with regard to jurisdictional claims in published maps and institutional affiliations.
References
- 1.Dasgupta A. Monitoring Free Drug Concentration: Clinical Usefulness and Analytical Challenges. Clinical Challenges in Therapeutic Drug Monitoring. Elsevier; 2016. p. 71–100.
- 2.Richens A. Clinical pharmacokinetics of phenytoin. Clin Pharmacokinet. 1979;4(3):153–169. doi: 10.2165/00003088-197904030-00001. [DOI] [PubMed] [Google Scholar]
- 3.Levine M, Chang T. Therapeutic drug monitoring of phenytoin rationale and current status. Clin Pharmacokinet. 1990;19(5):341–358. doi: 10.2165/00003088-199019050-00001. [DOI] [PubMed] [Google Scholar]
- 4.Musteata FM. Measuring and using free drug concentrations: has there been ‘real’progress? : Future Science; 2017. [DOI] [PubMed]
- 5.Fedler C, Stewart MJ. Plasma total phenytoin: a possibly misleading test in developing countries. Ther Drug Monit. 1999;21(2):155–160. doi: 10.1097/00007691-199904000-00003. [DOI] [PubMed] [Google Scholar]
- 6.Dutkiewicz G, Wojcicki J, Gawrońska-Szklarz B. The influence of hyperlipidemia on pharmacokinetics of free phenytoin. Neurol Neurochir Pol. 1995;29(2):203–211. [PubMed] [Google Scholar]
- 7.Dasgupta A, Crossey MJ. Elevated free fatty acid concentrations in lipemic sera reduce protein binding of valproic acid significantly more than phenytoin. Am J Med Sci. 1997;313(2):75–79. doi: 10.1097/00000441-199702000-00001. [DOI] [PubMed] [Google Scholar]
- 8.Naidu S, Moodley J, Botha J, McFadyen L. The efficacy of phenytoin in relation to serum levels in severe pre-eclampsia and eclampsia. BJOG. 1992;99(11):881–886. doi: 10.1111/j.1471-0528.1992.tb14434.x. [DOI] [PubMed] [Google Scholar]
- 9.Reidenberg MM, Drayer DE. Alteration of drug-protein binding in renal disease. Clin Pharmacokinet. 1984;9(1):18–26. doi: 10.2165/00003088-198400091-00003. [DOI] [PubMed] [Google Scholar]
- 10.Lindow J, Wijdicks EF. Phenytoin toxicity associated with hypoalbuminemia in critically ill patients. Chest. 1994;105(2):602–604. doi: 10.1378/chest.105.2.602. [DOI] [PubMed] [Google Scholar]
- 11.von Winckelmann SL, Spriet I, Willems L. Therapeutic drug monitoring of phenytoin in critically ill patients. Pharmacotherapy. 2008;28(11):1391–1400. doi: 10.1592/phco.28.11.1391. [DOI] [PubMed] [Google Scholar]
- 12.Wolf GK, McClain CD, Zurakowski D, Dodson B, McManus ML. Total phenytoin concentrations do not accurately predict free phenytoin concentrations in critically ill children. Pediatr Crit Care Med. 2006;7(5):434–439. doi: 10.1097/01.PCC.0000235252.43921.DE. [DOI] [PubMed] [Google Scholar]
- 13.Zielmann S, Mielck F, Kahl R, Kazmaier S, Sydow M, Kolk J, Burchardi H. A rational basis for the measurement of free phenytoin concentration in critically ill trauma patients. Ther Drug Monit. 1994;16(2):139–144. doi: 10.1097/00007691-199404000-00005. [DOI] [PubMed] [Google Scholar]
- 14.Sadeghi K, Hadi F, Ahmadi A, Hamishehkar H, Beigmohammadi M-T, Mahmoodpoor A, Rouini MR, Farhudi S, Hendoui N, Najafi A, Mojtahedzadeh M. Total phenytoin concentration is not well correlated with active free drug in critically-ill head trauma patients. J Res Pharm Pract. 2013;2(3):105–109. doi: 10.4103/2279-042X.122376. [DOI] [PMC free article] [PubMed] [Google Scholar]
- 15.Thakral A, Shenoy R, Deleu D. Acute visual dysfunction following phenytoin-induced toxicity. Acta Neurol Belg. 2003;103(4):218–220. [PubMed] [Google Scholar]
- 16.Burt M, Anderson DC, Kloss J, Apple FS. Evidence-based implementation of free phenytoin therapeutic drug monitoring. Clin Chem. 2000;46(8):1132–1135. [PubMed] [Google Scholar]
- 17.Iwamoto T, Kagawa Y, Naito Y, Kuzuhara S, Okuda M. Clinical evaluation of plasma free phenytoin measurement and factors influencing its protein binding. Biopharm Drug Dispos. 2006;27(2):77–84. doi: 10.1002/bdd.486. [DOI] [PubMed] [Google Scholar]
- 18.Booker H, Darcey B. Serum concentrations of free diphenylhydantoin and their relationship to clinical intoxication. Epilepsia. 1973;14(2):177–184. doi: 10.1111/j.1528-1157.1973.tb03954.x. [DOI] [PubMed] [Google Scholar]
- 19.Kilpatrick C, Wanwimolruk S, Wing L. Plasma concentrations of unbound phenytoin in the management of epilepsy. Br J Clin Pharmacol. 1984;17(5):539–546. doi: 10.1111/j.1365-2125.1984.tb02387.x. [DOI] [PMC free article] [PubMed] [Google Scholar]
- 20.Connors KA. Binding constants: the measurement of molecular complex stability. Hoboken: Wiley-Interscience; 1987. [Google Scholar]
- 21.J-d H. Errors in estimating the unbound fraction of drugs due to the volume shift in equilibrium dialysis. J Pharm Sci. 1983;72(11):1368–1369. doi: 10.1002/jps.2600721137. [DOI] [PubMed] [Google Scholar]
- 22.Oravcova J, Bo B, Lindner W. Drug-protein binding studies new trends in analytical and experimental methodology. J Chromatogr B. 1996;677(1):1–28. doi: 10.1016/0378-4347(95)00425-4. [DOI] [PubMed] [Google Scholar]
- 23.Mapleson W. Computation of the effect of Donnan equilibrium on pH in equilibrium dialysis. J Pharmacol Methods. 1987;17(3):231–242. doi: 10.1016/0160-5402(87)90053-2. [DOI] [PubMed] [Google Scholar]
- 24.Vuignier K, Schappler J, Veuthey J-L, Carrupt P-A, Martel S. Drug–protein binding: a critical review of analytical tools. Anal Bioanal Chem. 2010;398(1):53–66. doi: 10.1007/s00216-010-3737-1. [DOI] [PubMed] [Google Scholar]
- 25.Zini R. Methods in drug protein binding analysis. Human Pharmacology The Basis of Clinical Pharmacology Elsevier Science Publishers, Amsterdam 1991:235–282.
- 26.Kurz H, Trunk H, Weitz B. Evaluation of methods to determine protein-binding of drugs. Equilibrium dialysis, ultrafiltration, ultracentrifugation, gel filtration. Arzneimittelforschung. 1977;27(7):1373–1380. [PubMed] [Google Scholar]
- 27.Liu Z, Li F, Huang Y. Determination of unbound drug concentration and protein–drug binding fraction in plasma. Biomed Chromatogr. 1999;13(4):262–266. doi: 10.1002/(SICI)1099-0801(199906)13:4<262::AID-BMC832>3.0.CO;2-2. [DOI] [PubMed] [Google Scholar]
- 28.Koike Y, Magnusson A, Steiner E, Rane A, Sjöqvist F. Ultrafiltration compared with equilibrium dialysis in the determination of unbound phenytoin in plasma. Ther Drug Monit. 1985;7(4):461–465. doi: 10.1097/00007691-198512000-00018. [DOI] [PubMed] [Google Scholar]
- 29.Argyle JC, Kinniburgh DW, Costa R, Jennison T. Evaluation of an ultrafiltration-fluorescence polarization immunoassay for monitoring unbound phenytoin. Ther Drug Monit. 1984;6(1):117–120. doi: 10.1097/00007691-198403000-00019. [DOI] [PubMed] [Google Scholar]
- 30.Melten JW, Wittebrood AJ, Willems HJ, Faber GH, Wemer J, Faber DB. Comparison of equilibrium dialysis, ultrafiltration, and gel permeation chromatography for the determination of free fractions of phenobarbital and phenytoin. J Pharm Sci. 1985;74(6):692–694. doi: 10.1002/jps.2600740625. [DOI] [PubMed] [Google Scholar]
- 31.Joern WA. Gas-chromatographic assay of free phenytoin in ultrafiltrates of plasma: test of a new filtration apparatus and specimen stability. Clin Chem. 1981;27(3):417–421. [PubMed] [Google Scholar]
- 32.Lázaro E, Lowe PJ, Briand X, Faller B. New approach to measure protein binding based on a parallel artificial membrane assay and human serum albumin. J Med Chem. 2008;51(7):2009–2017. doi: 10.1021/jm7012826. [DOI] [PubMed] [Google Scholar]
- 33.Pedersen-Bjergaard S, Rasmussen KE. Electrokinetic migration across artificial liquid membranes: new concept for rapid sample preparation of biological fluids. J Chromatogr A. 2006;1109(2):183–190. doi: 10.1016/j.chroma.2006.01.025. [DOI] [PubMed] [Google Scholar]
- 34.Gjelstad A, Rasmussen KE, Pedersen-Bjergaard S. Electromembrane extraction of basic drugs from untreated human plasma and whole blood under physiological pH conditions. Anal Bioanal Chem. 2009;393(3):921–928. doi: 10.1007/s00216-008-2344-x. [DOI] [PubMed] [Google Scholar]
- 35.Huang C, Eibak LEE, Gjelstad A, Shen X, Trones R, Jensen H, Pedersen-Bjergaard S. Development of a flat membrane based device for electromembrane extraction: a new approach for exhaustive extraction of basic drugs from human plasma. J Chromatogr A. 2014;1326:7–12. doi: 10.1016/j.chroma.2013.12.028. [DOI] [PubMed] [Google Scholar]
- 36.Kjelsen IJØ, Gjelstad A, Rasmussen KE, Pedersen-Bjergaard S. Low-voltage electromembrane extraction of basic drugs from biological samples. J Chromatogr A. 2008;1180(1–2):1–9. doi: 10.1016/j.chroma.2007.12.006. [DOI] [PubMed] [Google Scholar]
- 37.Eibak LEE, Gjelstad A, Rasmussen KE, Pedersen-Bjergaard S. Exhaustive electromembrane extraction of some basic drugs from human plasma followed by liquid chromatography–mass spectrometry. J Pharm Biomed Anal. 2012;57:33–38. doi: 10.1016/j.jpba.2011.08.026. [DOI] [PubMed] [Google Scholar]
- 38.Musteata FM, Pawliszyn J, Qian MG, Wu J-T, Miwa GT. Determination of drug plasma protein binding by solid phase microextraction. J Pharm Sci. 2006;95(8):1712–1722. doi: 10.1002/jps.20558. [DOI] [PubMed] [Google Scholar]
- 39.Kariv I, Cao H, Oldenburg KR. Development of a high throughput equilibrium dialysis method. J Pharm Sci. 2001;90(5):580–587. doi: 10.1002/1520-6017(200105)90:5<580::aid-jps1014>3.0.co;2-4. [DOI] [PubMed] [Google Scholar]
- 40.International Council for Harmonisation of Technical Requirements for Pharmaceuticals for Human Use (ICH) M10 Draft Guideline. https://database.ich.org/sites/default/files/M10_EWG_Draft_Guideline.pdf. Accessed 20 April 2020.
- 41.Seyfinejad B, Meshkini A, Habibolahi P, Ozkan SA, Jouyban A. Determination of phenytoin in exhaled breath condensate using electromembrane extraction followed by capillary electrophoresis. Electrophoresis. 2020;41(9):666–677. doi: 10.1002/elps.201900440. [DOI] [PubMed] [Google Scholar]
- 42.Anton AH. The effect of disease, drugs, and dilution on the binding of sulfonamides in human plasma. Clin Pharmacol Ther. 1968;9(5):561–567. doi: 10.1002/cpt196895561. [DOI] [PubMed] [Google Scholar]
- 43.Lima JJ, MacKichan JJ, Libertin N, Sabino J. Influence of volume shifts on drug binding during equilibrium dialysis: correction and attenuation. J Pharmacokinet Biopharm. 1983;11(5):483–498. doi: 10.1007/BF01062207. [DOI] [PubMed] [Google Scholar]
- 44.Boudinot FD, Jusko WJ. Fluid shifts and other factors affecting plasma protein binding of prednisolone by equilibrium dialysis. J Pharm Sci. 1984;73(6):774–780. doi: 10.1002/jps.2600730617. [DOI] [PubMed] [Google Scholar]
- 45.Banker MJ, Clark TH, Williams JA. Development and validation of a 96-well equilibrium dialysis apparatus for measuring plasma protein binding. J Pharm Sci. 2003;92(5):967–974. doi: 10.1002/jps.10332. [DOI] [PubMed] [Google Scholar]
- 46.Ehrnebo M, Agurell S, Jalling B, Boreus L. Age differences in drug binding by plasma proteins: studies on human foetuses, neonates and adults. Eur J Clin Pharmacol. 1971;3(4):189–193. doi: 10.1007/BF00565004. [DOI] [PubMed] [Google Scholar]
- 47.Monks A, Richens A. Effect of single doses of sodium valproate on serum phenytoin level and protein binding in epileptic petients. Clin Pharmacol Ther. 1980;27(1):89–95. doi: 10.1038/clpt.1980.14. [DOI] [PubMed] [Google Scholar]
- 48.Hooper WD, Bochne F, Eadie MJ, Tyrer JH. Plasma protein binding of diphenylhydantoin effects of sex hormones, renal and hepatic disease. Clin Pharmacol Ther. 1974;15(3):276–282. doi: 10.1002/cpt1974153276. [DOI] [PubMed] [Google Scholar]
- 49.Odar-Cederlöf I, Borgå O. Impaired plasma protein binding of phenytoin in uremia and displacement effect of salicylic acid. Clin Pharmacol Ther. 1976;20(1):36–47. doi: 10.1002/cpt197620136. [DOI] [PubMed] [Google Scholar]
- 50.Amiri Pebdani A, Dadfarnia S, Haji Shabani AM, Khodadoust S, Talebianpoor MS. Modified dispersive liquid-phase microextraction based on sequential injection solidified floating organic drop combined with HPLC for the determination of phenobarbital and phenytoin. J Sep Sci. 2018;41(2):509–517. doi: 10.1002/jssc.201701111. [DOI] [PubMed] [Google Scholar]
- 51.Pebdani AA, Dadfarnia S, Shabani AMH, Khodadoust S. Application of Ni: ZnS nanoparticles loaded on magnetic multi-walled carbon nanotubes as a sorbent for dispersive micro-solid phase extraction of phenobarbital and phenytoin prior to HPLC analysis: experimental design. RSC Adv. 2016;6(92):89250–89258. [Google Scholar]
- 52.Ferreira A, Rodrigues M, Oliveira P, Francisco J, Fortuna A, Rosado L, Rosado P, Falcao A, Alves G. Liquid chromatographic assay based on microextraction by packed sorbent for therapeutic drug monitoring of carbamazepine, lamotrigine, oxcarbazepine, phenobarbital, phenytoin and the active metabolites carbamazepine-10, 11-epoxide and licarbazepine. J Chromatogr B. 2014;971:20–29. doi: 10.1016/j.jchromb.2014.09.010. [DOI] [PubMed] [Google Scholar]
- 53.Bereczki A, Tolokan A, Horvai G, Horvath V, Lanza F, Hall AJ, Sellergren B. Determination of phenytoin in plasma by molecularly imprinted solid-phase extraction. J Chromatogr A. 2001;930(1–2):31–38. doi: 10.1016/s0021-9673(01)01190-6. [DOI] [PubMed] [Google Scholar]
- 54.Asadi M, Dadfarnia S, Haji Shabani AM, Abbasi B. Simultaneous extraction and quantification of lamotrigine, phenobarbital, and phenytoin in human plasma and urine samples using solidified floating organic drop microextraction and high-performance liquid chromatography. J Sep Sci. 2015;38(14):2510–2516. doi: 10.1002/jssc.201500237. [DOI] [PubMed] [Google Scholar]
- 55.Cantú MD, Toso DR, Lacerda CA, Lanças FM, Carrilho E, Queiroz MEC. Optimization of solid-phase microextraction procedures for the determination of tricyclic antidepressants and anticonvulsants in plasma samples by liquid chromatography. Anal Bioanal Chem. 2006;386(2):256–263. doi: 10.1007/s00216-006-0629-5. [DOI] [PubMed] [Google Scholar]
- 56.Queiroz MEC, Silva SM, Carvalho D, Lancas FM. Determination of lamotrigine simultaneously with carbamazepine, carbamazepine epoxide, phenytoin, phenobarbital, and primidone in human plasma by SPME-GC-TSD. J Chromatogr Sci. 2002;40(4):219–223. doi: 10.1093/chromsci/40.4.219. [DOI] [PubMed] [Google Scholar]