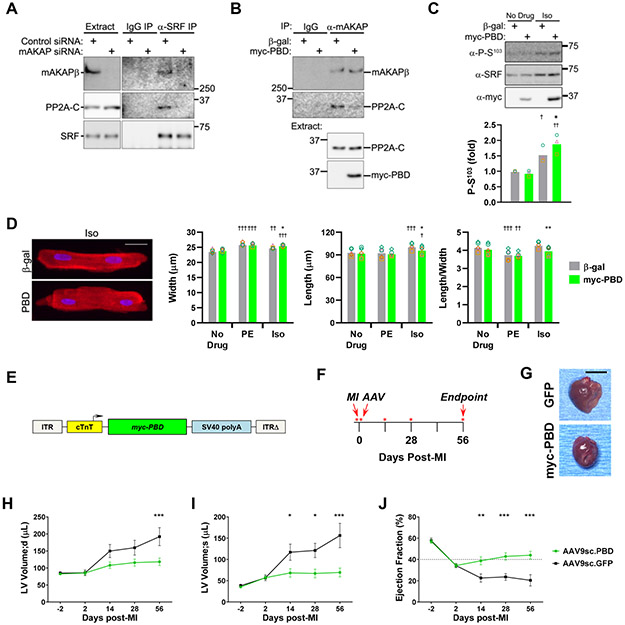
Figure 6. SRF dephosphorylation by mAKAPβ-bound PP2A promotes myocyte hypertrophy with increased length:width ratio.
A, Neonatal myocytes transfected with control or mAKAP siRNA were used for co-immunoprecipitation assay of endogenous SRF-mAKAPβ-PP2A complexes. PP2A holoenzyme contains an A- and catalytic C-subunit homodimer core and a scaffolding B-subunit.14 PP2A C-subunit (PP2A-C) was detected by immunoblot. n = 3. B, Neonatal myocytes infected with adenovirus expressing myc-tagged PP2A binding domain (myc-PBD) or β-galactosidase (β-gal) before co-immunoprecipitation of endogenous mAKAPβ-PP2A complexes . n = 3. C, Adult myocytes infected with myc-PBD or β-gal adenoviruses were cultured for 24 hours +/− 10 μmol/L isoproterenol (Iso) before detection of Ser103 phosphorylated SRF. n = 3. D, Adult rat ventricular myocytes were infected with adenovirus expressing myc-PBD or β-gal control and cultured for 24 hours +/− 20 μmol/L phenylephrine (PE) or 10 μmol/L Iso before immunocytochemistry and morphometry. C,D: Bars and colored symbols indicate average mean and means of independent experiments using different myocyte preparations, respectively. n = 5. † vs. no drug condition for same protein; * vs. Iso-treated β-gal control. E, myc-PBD (AAV9sc.PBD) and myc-GFP (AAV9sc.GFP) were expressed in mice using a self-complementary AAV9 and the cardiac myocyte-specific chicken troponin T promoter.24 F, Timeline for PBD treatment study shown in G-J. Mice were randomized by echocardiography two days post-MI for i.v. treatment with AAV the following day. Echocardiography was performed on days marked by red asterisks. G, Representative whole heart pictures at endpoint. Bar - 5 mm. H-J, Serial M-mode echocardiography. n: AAV9sc.PBD – 8 (green); AAV9sc.GFP – 5 (black). Mean +/− s.e.m. indicated. * p-value for difference in cohorts at given time point. Data were analyzed by two-way ANOVA followed by Tukey (C,D) and Sidak (H-J) post-hoc testing. *,† p < 0.05; **,†† p < 0.01; ***,††† p < 0.001.

