Abstract
We examine whether zoning can increase health equity and population health by assessing a new zoning ordinance in the City of Baltimore that forced 76 liquor stores in residential areas to relocate, close, or convert to an approved use. To do so, we undertake a baseline assessment of neighborhoods with affected liquor stores, and predict the potential impact of the zoning change by estimating the impact of previous closures and openings of liquor stores on neighborhood crime in Baltimore using a spatial Poisson random trend fixed effects model. We find that affected stores are concentrated in high poverty, majority black neighborhoods with high vacancy rates, and that liquor store closings are associated with a statistically significant reduction in violent crime on the block group in question with no negative spillover affects onto the nearby block groups.
Keywords: Health; Zoning; Crime; Cities; JEL Classification: R0, I10, R140
Introduction
Zoning, or the process of dividing land in a municipality into distinct districts in which certain land uses are permitted or prohibited [5], is a tool traditionally used to guide urban growth and development. However, zoning has also been used to address public health and health equity [8]. Examples include using zoning to close fast food restaurants (Sturm and Cohen 2009), incentivize urban agriculture and farmers’ markets to promote access to and consumption of healthy foods such as fresh fruits and vegetables [1], and attract grocery stores to locate in under-resourced food desserts (Chen and Florax 2010).
Although zoning provides an additional tool for public health practitioners, it only facilitates conditions in which development occurs. That is to say, whether or not new farmers’ markets or grocery stores are established where zoning regulations would incentivize them relies on businesses and community development investments. As such, zoning regulations alone do not insure that specific communities’ needs are met.
Additionally, whereas licensing requirements and other more traditionally utilized policies can target specific actors, zoning laws are only able to regulate the property to insure it is in compliance with zoning and land use rules. The rules governing the uses of a particular property are constant, even when the owners change. This may cause mismatches between where and how zoning regulations are implemented in communities and the way they were intended to impact neighborhoods when they were developed.
In this paper, we explore the role of land use regulations as a tool for public health using a case study in Baltimore, Maryland. Baltimore suffers from an overconcentration of alcohol outlets (Thornton, Greiner, and Jennings 2013). On December 5, 2016, the Baltimore City Council approved a comprehensive new zoning code ordinance known as Transform Baltimore, the first zoning code rewrite since 1971. It includes three provisions addressing the location, distribution, and density of alcohol outlets. One of the resulting provisions required 76 nonconforming liquor stores in residential neighborhoods in Baltimore to relocate, close, or convert to an approved use by June 5, 2019.1 The policy is expected to reduce the number of liquor establishments in Baltimore by 3.3% unless forestalled by legal or legislative challenges.2
The primary focus of the liquor store provisions was on eliminating liquor stores in residential neighborhoods where they are not an allowable use and limiting further overconcentration of liquor stores in commercial areas by including a distance standard for new stores to prohibit them from locating within 300 ft of an existing liquor store [11].3 Baltimore City officials used evidence from an analysis conducted in Baltimore City, which replicates findings from other research demonstrating a consistent positive association between increased density and closer proximity of alcohol outlets with increased neighborhood crime, to inform their approach to the use of zoning regulations to address neighborhood crime as a component of quality of life [7]. This approach has been identified as innovative because it is distinct from more traditional approaches to regulating liquor stores, which have focused on using liquor licensing laws to identify individual operators whose business practices are of concern and remove problem stores (in some states prevented by state pre-emption laws) [7].
To study this policy and its potential impacts, we first examine how well this approach targets crime and areas of need by undertaking a baseline data assessment of affected liquor stores and their surrounding areas. We then predict the policy’s potential impact on neighborhood crime by estimating the impact of previous closures on neighborhood crime using a random trend fixed effects panel model. We also examine whether these closures caused spillover or displacement effects into nearby neighborhoods by estimating a spatially lagged random trend fixed effects model.
Results indicate that affected liquor stores are concentrated in high-poverty, majority black neighborhoods with high vacancy rates. Analysis of prior liquor store closings showed that for every liquor store closing, violent crimes decline by 1.4%, or 0.19 crimes per year on the block group of the closing, on average. For every liquor store opening, violent crimes increase by 1.1% per year, or 0.15 crimes, on average for the block group of the opening. Additionally, spatial random trend fixed effects results showed that these reductions were not accompanied by increases in crime on contiguous block groups, indicating that displacement did not occur.
These results suggest that the liquor store provisions of the Baltimore zoning code could reduce crime and improve population health, at least in the short run. However, evaluation of the actual implementation is necessary to confirm these findings, since prior liquor store closings may be quite different from those targeted by the new provision since those targeted by the provision tend to be located in lower income, higher crime neighborhoods, and since they are different from voluntary closures which may themselves be a response to changes in crime.
Conceptual Framework
Prior research on alcohol outlets and crime suggests that decreasing the density of alcohol outlets and proximity of alcohol outlets to residential neighborhoods may reduce crime [, 6, 7, 6]. However, while past research has indicated a correlation between liquor stores and crime (Franklin II et al. 2010; [9]) and a stronger association with outlets that allow for off-premise consumption [12], these studies have not identified causal relationships since they compared neighborhoods with each other at one point in time. Neighborhoods that have liquor stores are more likely to have higher rates of crime for reasons other than the liquor store itself, since liquor stores are likely to locate in neighborhoods with a higher concentration of commercial businesses and a higher poverty rate. These and other characteristics of the neighborhoods are also correlated with higher rates of crime, which bias the estimate of liquor stores on crime.
A few studies have utilized natural experiments to determine the relationship between alcohol availability and crime. Looking at regulatory changes which loosened restrictions on alcohol sales, Conlin, Conlin, and Pepper (2005) found a decrease in drug-related arrests; Billings (2014) found an increase in total arrests; Chamberlin (2014) found short-term increases in shoplifting and non-violent crimes and longer-term increases in violent and drug-related crimes; and Anderson, Crost, and Rees (2014) found an increase in violent crimes. However, each of these looked at effects across a broader geography—county or city—rather than for individual neighborhoods.
Liquor store closures could also have negative impacts on neighborhood health by reducing access to other goods that these stores stock, such as food or over the counter medicines. And, there are concerns about store closures reducing community cohesion, since while some of the stores are seen as nuisances by nearby residents, some of them are believed to be good actors who provide a space for the community to gather. Qualitative interviews have suggested that crime and victimization could rise for other reasons, such as because residents will now have to walk further and into unfriendly neighborhoods to acquire products that that they would have otherwise acquired from that liquor store, increasing the potential for conflict.
Potential Positive Impacts
The liquor store provisions of the new zoning code may improve population health by reducing crime, improving neighborhood quality, and increasing walkability. City officials involved with the implementation of this policy emphasize that requiring nonconforming outlets to comply with land use and zoning policies will allow the residential neighborhoods where these nonconforming liquor stores are located to develop and grow as intended.4 They also emphasize that the projected positive impacts from the implementation of Transform Baltimore’s alcohol outlet provisions center on crime reduction. As another city official put it, “One house (business) in one block can kill a block.”5
Implementing the alcohol outlet provisions of Transform Baltimore has the potential to provide Baltimore City with the opportunity to create safer spaces for new business investments and neighborhood development. Community members interviewed in this research expressed enthusiasm that closure of alcohol outlets might create more opportunity for community-based investment opportunities, but some also express skepticism.
Potential Unintended Consequences
However, there are concerns that outlet closures could unintentionally increase blight if the stores are left vacant and dilapidated. One government official expressed concern at the lack of companion polices for increasing investment and development in neighborhoods affected by the zoning ordinance. “Many of these neighborhoods already suffer from disinvestment” and the government official interviewed expressed concern that not enough would be done to counter the economic loss of a store in certain neighborhoods, which could result in additional vacancies and blight.
Additionally, some of the stores affected by the law provide non-alcohol related goods and are seen by the community as community assets. In some instances, these perceptions are also reflective of their opinion of the current business owner operating a given establishment. At a public hearing on September 7, 2017, residents appeared at Planning Commission panel to advocate in support of an alcohol outlet that was attempting to change its zoning from residential to commercial to avoid being forced to close by the alcohol ordinances of Transform Baltimore. Community members testified that the store played a critical role in providing non-alcoholic beverages, food, over the counter medicine, and fostering a sense of community in an underserved, marginalized neighborhood. Members of the community also spoke to their frustration with the Baltimore City Council. Many of the members that testified felt like the new zoning code provisions regarding liquor outlets specifically targeted low-income, African American communities.
Other Potential Weaknesses of the Law
Beyond these potential negative consequence is more broad skepticism about how well the law will work. There may be too few alcohol outlets affected by the law to make a dent in the density of outlets in the city. And, even if closures do reduce crime in one neighborhood, they may merely displace it into the next neighborhood over.
Additionally, the law does not address all bad actors. One Baltimore City council member expressed concern that the zoning ordinances were too specific to alcohol outlets, and would not account for other “bad actors.” The council member noted that many of the Gas Stations in Baltimore are “in cahoots” with drug dealers. No additional policies addressing bad actors at gas stations or corner stores exist to complement the alcohol outlet ordinances.
Data
Our data come from four main data sources. First, we use data on the location of nonconforming liquor stores from the City of Baltimore, along with data on all other liquor stores in the city for the years 2010, 2011, 2012, 2014, and 2017. These data allow us to examine where affected liquor stores are located and to draw comparison neighborhoods for these affected areas. The data on all liquor stores allow us to predict the impact of the closures by identifying prior closures and estimating their impact on crime.
Second, we use crime data from Open Baltimore (the open data portal operated by the city) covering 2012 through 2018. These data are based on Baltimore Police Department Part 1 victim based crime data. For each reported crime, the dataset includes type of crime and approximate locations where it was committed. For the purposes of our analyses we consider “violent crime” to encompass aggravated assault, assault by threat, homicide, robbery (carjacking, commercial, residence, or street), and shooting, and “property crime” to encompass arson, auto theft, burglary, larceny, and larceny from auto.
Third, we use 2011–2015 American Community Survey block group-level data to examine neighborhood demographics and socioeconomic indicators and to draw comparison neighborhoods for use in tracking the impacts of the law over time. As the zoning ordinance being studied was enacted in late 2016 (with public awareness in the lead-up to finalization), we chose to use data ending in 2015 for baseline consideration. We examine economic (median household income, poverty rate, unemployment rate), housing (median home value, median rent per month, homeownership rate, severe rent burden, vacancy rate), demographic (race/ethnicity, age), and educational attainment indicators to capture neighborhood context in which nonconforming liquor stores are situated.
Finally, we use land use data from the Open Baltimore to calculate the percent of the land that is residential within each neighborhood to help with matching affected neighborhoods (defined in our analysis as census tracts) to comparable non-affected neighborhoods. To obtain this percentage breakdown, we download a shapefile of Baltimore City zoning districts which we separated by individual block group using the split tool in ArcGIS. Once demarcated by block group boundaries, we take the land area of zoning classification by block group to determine the percentage of land zoned as residential within each.
How Well Does the Policy Address the Problem of Neighborhood Crime?
To better understand how well this policy is designed to impact neighborhoods where violent crime is more prevalent, we undertook a baseline data assessment to compare block groups with affected liquor stores to those without (Table 1). Affected neighborhoods tend to have higher rates of violent crime, higher poverty and unemployment rates, lower home values, and higher rates of rent burden and vacancy. Residents in affected neighborhoods are, on average, younger (under the age of 18), more likely to be black, and more likely to have lower levels of education than residents in non-affected neighborhoods.
Table 1.
Neighborhoods with affected liquor stores versus those without
| Baltimore block groups | With nonconforming liquor store(s) | With no affected liquor stores | Difference |
|---|---|---|---|
| Descriptives | |||
| Number of block groups | 64 | 589 | |
| Average number of liquor stores (2014) | 2.6 | 1.9 | |
| Crime | |||
| Average number of violent crimes (2014) | 18.6 | 13.5 | *** |
| Average number of property crimes (2014) | 42.4 | 43.7 | |
| Economic (average or average %) | |||
| Median household income | $33,317 | $49,249 | |
| Poverty rate | 35.2% | 23.9% | *** |
| Unemployment | 20.9% | 14.1% | *** |
| Housing (average or average %) | |||
| Median home value | $107,496 | $164,913 | *** |
| Median rent/month | $959 | $1031 | |
| Homeownership | 40.7% | 49.9% | *** |
| Severe rent burden | 37.4% | 29.0% | *** |
| Vacancy rate | 31.5% | 18.3% | *** |
| Demographic (average %) | |||
| White alone | 9.3% | 28.2% | *** |
| Black alone | 84.8% | 62.3% | *** |
| Hispanic | 2.8% | 4.5% | |
| Asian Americans and Pacific Islanders alone | 0.8% | 2.6% | ** |
| Younger than 18 | 22.9% | 20.5% | * |
| Older than 64 | 12.8% | 12.9% | |
| Education (average %) | |||
| Age 25+ with high school degree or less | 25.4% | 17.4% | *** |
| Age 25+ with bachelor’s degree or higher | 12.1% | 27.6% | *** |
Authors’ analysis of American Community Survey 2011–15 data, Baltimore City Planning Department administrative data, and Baltimore City Police Department data
***Differences are significant with p < 0.01 **Differences are significant with p < 0.05 *Differences are significant with p < 0.1
This may indicate that the policy is optimally designed to address the problem of neighborhood disinvestment and crime, since it appears to affect mostly high need, low opportunity neighborhoods. However, this could also be interpreted in terms of the policy having a disproportionate impact on low-income and African American neighborhoods, which may be viewed paternalistic, inequitable, or unfair.
These trends can be viewed spatially in the maps below (Figs. 1, 2, and 3, 4). Affected liquor stores tend to be located in West and East Baltimore, which is also where poverty is concentrated and where vacancy rates are the highest. Neighborhoods with affected liquor stores also tend to have the highest proportion of black residents in the city.
Fig. 1.
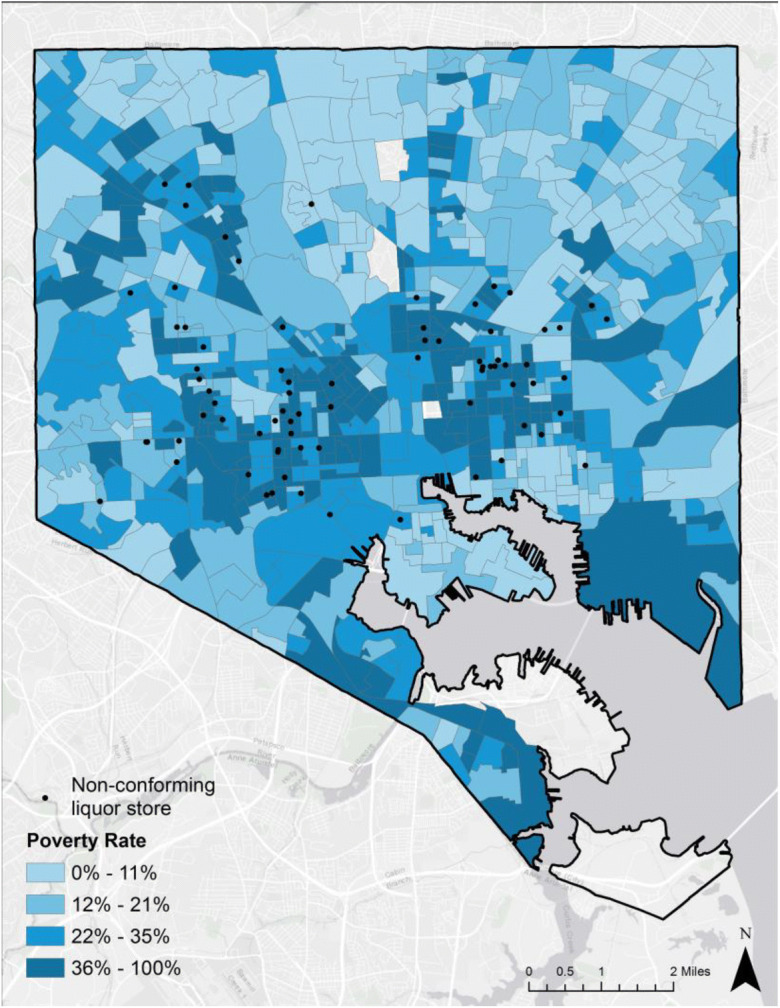
Nonconforming liquor stores by poverty rate (source: Authors’ analysis of American Community Survey 2011–15 data and Baltimore City Planning Department administrative data)
Fig. 2.
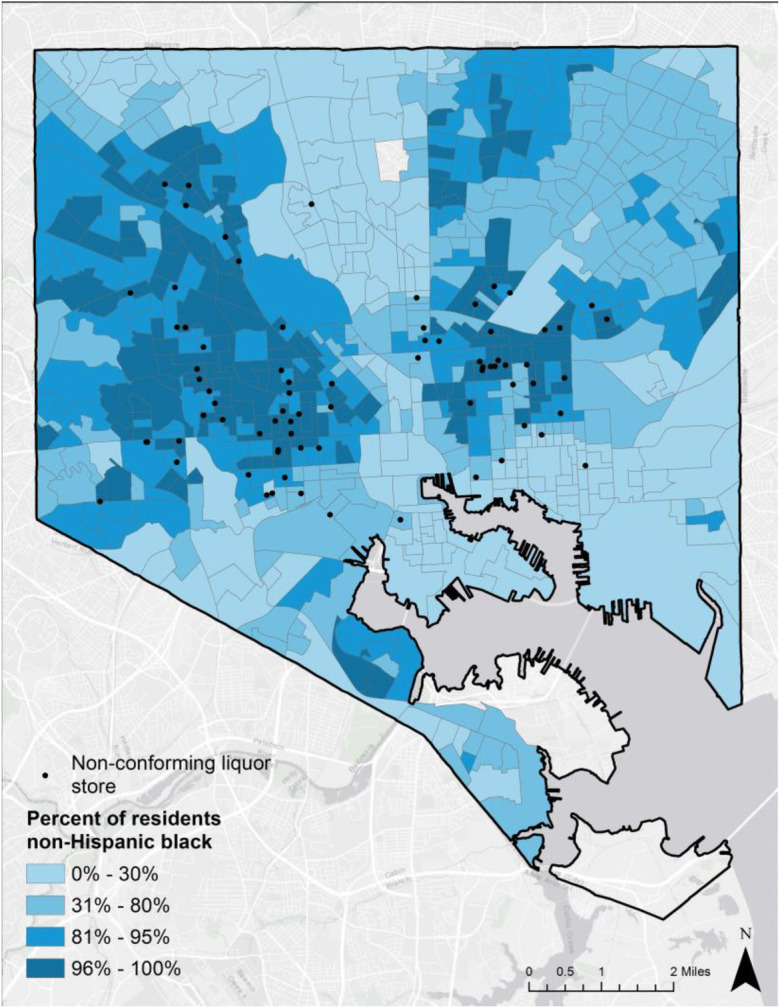
Nonconforming liquor stores by percent Black (source: Authors’ analysis of American Community Survey 2011–15 data and Baltimore City Planning Department administrative data)
Fig. 3.
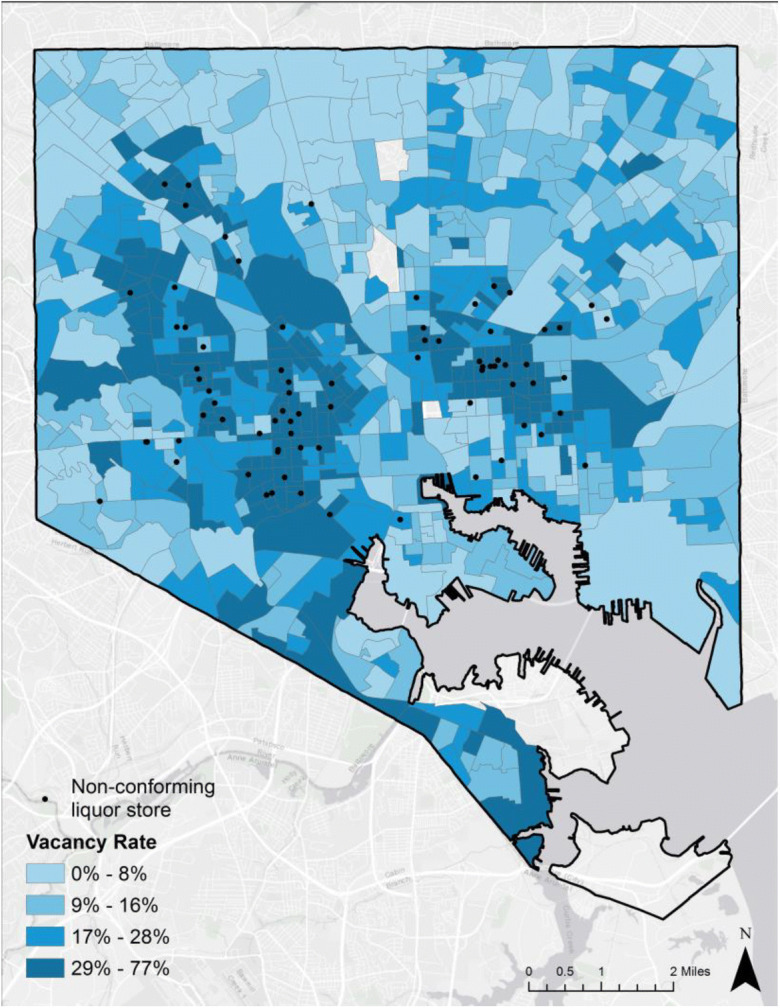
Nonconforming liquor stores by vacancy rate (source: Authors’ analysis of American Community Survey 2012–15 data and Baltimore City Planning Department administrative data)
Fig. 4.
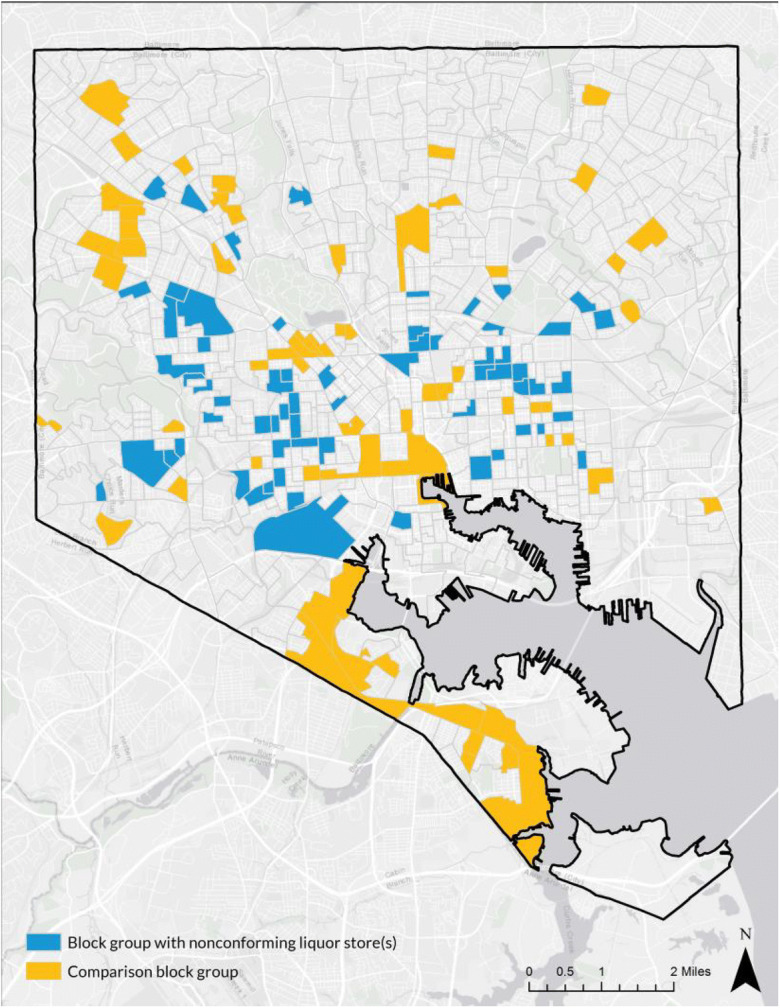
Affected neighborhoods and comparison neighborhoods
Predicting Impact
To explore how the liquor store closures and conversions might impact crime, we estimate the impact of prior liquor store openings and closings on crime in Baltimore (see Fig. 7 in Appendix A for liquor store openings and closings by year). To do so, we use panel econometric techniques to compare changes in crime on block groups before and after a liquor store opening and closing. This allows us to remove any time-invariant unobserved heterogeneity within block groups, such as their baseline levels of crime, income, and vacancy. By doing so, we compare block groups with themselves before and after a closing, rather than one block group to another at one point in time, which might be different in unobservable ways.
Fig. 7.
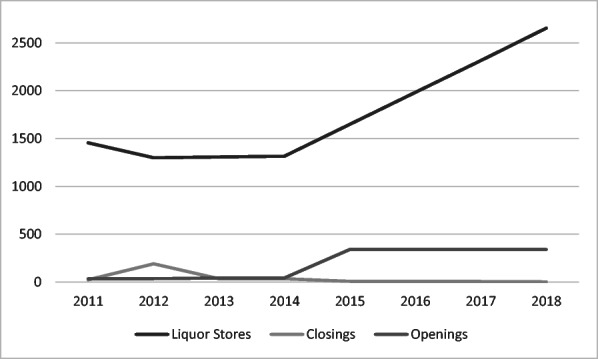
Liquor Store Openings and Closings by Year, 2012–2017
To begin, we examine the average number of crimes on a block group before and after a liquor store opening in Baltimore (Figs. 5). Without controlling for any correlates such as citywide trends, we see that crime increases the year that the liquor store opens, and then decreases again afterwards. This could be because liquor stores enter neighborhoods as they also happen to be increasing in crime due to overall changes in the neighborhood economy, or due to the increased crime that often accompanies construction sites [10].
Fig. 5.
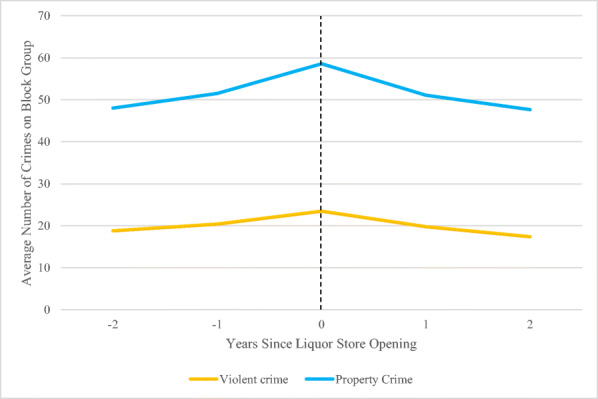
Average number of crimes on each block group before and after a liquor store opening (source: author calculations of Baltimore City Crime Data and Baltimore City Liquor store data). Vertical dotted line represents the year in which a liquor store opens. Crime in the year 2015 has been omitted and interpolated since this was the year of the Baltimore riots, which caused some liquor stores to close
Surprisingly, a similar trend can be seen for liquor store closings and property crime (Fig. 6). Property crime increases the year that a liquor store closes and then declines again, but violent crime decreases slightly both the year of the closing and the year after. This could be because the property crime increase caused the liquor store to close, or because secondary factors caused the neighborhood to worsen, causing both crime to increase and liquor stores to go out of business.
Fig. 6.
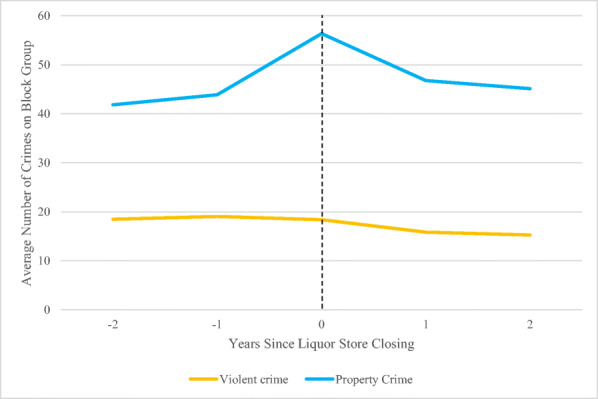
Average number of crimes on each block group before and after a liquor store closing (source: author calculations of Baltimore City Crime Data and Baltimore City Liquor store data). Vertical dotted line represents the year in which a liquor store opens. Crime in the year 2015 has been omitted and interpolated since this was the year of the Baltimore riots, which caused some liquor stores to close
To control for these correlates and other unobserved neighborhood characteristics that may be associated with both crime and liquor stores, we run a random trend fixed effects model that compares changes in crime on block groups with liquor store openings and closings to those without. This model removes all time-invariant unobserved heterogeneity on the block group, such as starting levels of crime, poverty, and number of other liquor stores nearby. We also control for any trends in crime over time on each block group by including individual block group trends, which removes concerns about liquor stores opening or closing on block groups due to general trends in crime.
Because the dependent variable, the number of crimes on a block group in a given year, takes on nonnegative integer values (is a count variable), a linear model for E(y|x) is not ideal because it can lead to negative predicted values (Wooldridge, 2002, p. 388). Because y can also take on the value zero with positive probability, a log transformation is inappropriate. Therefore, we assume that Yi given Xitakes on a Poisson distribution. The Poisson model is as follows:
| 2 |
where .6 Provided that E(yi, t|xi, t) = exp(xβ), estimates of β are consistent even if the mean does not equal the variance—when there is overdispersion.7
We then estimate the above model using multinomial quasi-conditional maximum likelihood estimation as described in Wooldridge, 1999. We specify liquor stores as stock variables and estimate the following equation:
| 3 |
Each variable is measured at the block group and year level. β1LiquorStoreClo sin gsi, tandβ2LiquorStoreOpeningsi, t equal the number of liquor stores that opened and closed, respectively, on block group i in year t. Block group and year fixed effects are represented by θi and γt respectively, and block group time trends are represented by ςit. Time invariant variables are captured by the block group level fixed effects and are therefore not included in this equation. We use standard errors clustered at the block group level that are robust to heteroskedasticity and arbitrary forms of error correlation within each block group.8 Treatment variables are set up as stock variables that turn on the year of the treatment and remain one in all years post-treatment. Therefore, our treatment effects are average treatment effects of all years post-closure.
Results from this analysis show that liquor store closings are statistically significantly associated with reductions in violent crime, and liquor store openings are statistically significantly associated with increases in violent crime (Table 3). For every liquor store closing, violent crimes decline by 1.4%, or 0.19 crimes per year, on average. For every liquor store opening, violent crimes increase by 1.1% per year, or 0.15 crimes, on average.
Table 3.
Relationship between liquor store openings/closings and crime in Baltimore, MD
| (1) | (2) | |
|---|---|---|
| Violent crime | Property crime | |
| Poisson | Poisson | |
| Liquor store closings | − 0.014*** | 0.009 |
| (0.002) | (0.000) | |
| Liquor store openings | 0.011*** | 0.008 |
| (0.003) | (0.000) | |
| Year fixed effects | Yes | Yes |
| Block group fixed effects | Yes | Yes |
| Individual block group time trends | Yes | Yes |
| Observations | 3320 | 3385 |
| Number of block groups | 664 | 677 |
Results are semi-elasticities of liquor store openings and closings on crime from a random trend model that includes block group fixed effects, year fixed effects, and time trends. Sample is a yearly panel of all block groups in Baltimore, Maryland from 2012 to 2017. Due to riots in 2015 and their relationship with liquor store closings, crime in that year was dropped and interpolated. Crime offenses refer to the number of incidents on each block group in each year. Robust standard errors in parentheses, clustered at the block group level. *Significant at 10%; *significant at 5%; ***significant at 1%
Controlling for liquor store openings and closings on nearby block groups, we see that liquor store closings are still associated with a statistically significant reduction in violent crime (of 0.4%) and that liquor store openings are associated with a statistically significant increase in violent crime both on the block group in question and the nearby block groups (of 0.8% and 0.4% respectively) (Table 4). This suggests that displacement into the immediate vicinity is not occurring (whereby liquor store closings just cause crime to move over one neighborhood), but rather crime is declining in the neighborhood in question without an increase in nearby neighborhoods. And, the increase in violent crimes on block groups nearby those with liquor store openings suggests that not only is displacement not occurring, but negative spillovers are actually occurring.
Table 4.
Relationship between liquor store openings/closings and crime in Baltimore, MD, 2012–2017, with spatially lagged variables
| (1) | (2) | |
|---|---|---|
| Violent crime | Property crime | |
| Poisson | Poisson | |
| Liquor store closings | − 0.004*** | 0.011 |
| (0.001) | (0.000) | |
| Liquor store closings on contiguous block groups | − 0.006 | 0.003 |
| (0.004) | (0.000) | |
| Liquor store openings | 0.008*** | 0.003 |
| (0.002) | (0.000) | |
| Liquor store openings on contiguous block groups | 0.004* | − 0.000 |
| (0.003) | (0.000) | |
| Year fixed effects | Yes | Yes |
| Block group fixed effects | Yes | Yes |
| Individual block group time trends | Yes | Yes |
| Observations | 3984 | 4062 |
| Number of block groups | 664 | 677 |
Results are semi-elasticities of liquor store openings and closings on crime from a random trend model that includes block group fixed effects, year fixed effects, and time trends. Sample is a yearly panel of all block groups in Baltimore, Maryland from 2012 to 2017. Due to riots in 2015 and their relationship with liquor store closings, crime in that year was dropped and interpolated. Crime offenses refer to the number of incidents on each block group in each year. Robust standard errors in parentheses, clustered at the block group level. *Significant at 10%; *significant at 5%; ***significant at 1%
Robustness Checks
To ensure that our model is robust to various specifications, we run a number of robustness checks. First, we check that our results are not sensitive to our decisions about how to treat 2015. Table 5 shows the relationship between liquor store openings and closing and crime with 2015 dropped rather than interpolated. Results are consistent and larger than our main results.
Table 5.
Relationship between liquor store openings/closings and crime in Baltimore, MD, 2015 dropped
| (1) | (2) | |
|---|---|---|
| Violent crime | Property crime | |
| Poisson | Poisson | |
| Liquor store closings | − 0.009*** | 0.007 |
| (0.002) | (0.000) | |
| Liquor store openings | 0.021*** | 0.013 |
| (0.007) | (0.000) | |
| Year fixed effects | Yes | Yes |
| Block group fixed effects | Yes | Yes |
| Individual block group time trends | Yes | Yes |
| Observations | 3320 | 3385 |
| Number of block groups | 664 | 677 |
Results are semi-elasticities of liquor store openings and closings on crime from a random trend model that includes block group fixed effects, year fixed effects, and time trends. Sample is a yearly panel of all block groups in Baltimore, Maryland from 2012 to 2017. Due to riots in 2015 and their relationship with liquor store closings, that year of data was dropped. Crime offenses refer to the number of incidents on each block group in each year. Robust standard errors in parentheses, clustered at the block group level. *Significant at 10%; *significant at 5%; ***significant at 1%
Next, we run a falsification test to ensure that pre trends are not biasing our results. To do so, we estimate the impact of future liquor store openings and closings on current crime levels (Table 6). Since the coefficients are not statistically significant, this suggests that endogeneity is not biasing our results.
Table 6.
Falsification test for relationship between liquor store openings/closings and crime in Baltimore, MD
| (1) | (2) | |
|---|---|---|
| Violent crime | Property crime | |
| Poisson | Poisson | |
| Future liquor store closings | − 0.021 | − 0.034 |
| (0.101) | (0.000) | |
| Future liquor store openings | − 0.000 | − 0.008 |
| (0.002) | (0.000) | |
| Year fixed effects | Yes | Yes |
| Block group fixed effects | Yes | Yes |
| Individual block group time trends | Yes | Yes |
| Observations | 3300 | 3385 |
| Number of block groups | 664 | 677 |
Results are semi-elasticities of liquor store openings and closings on crime from a random trend model that includes block group fixed effects, year fixed effects, and time trends. Sample is a yearly panel of all block groups in Baltimore, Maryland from 2012 to 2017. Due to riots in 2015 and their relationship with liquor store closings, crime in that year was dropped and interpolated. Crime offenses refer to the number of incidents on each block group in each year. Robust standard errors in parentheses, clustered at the block group level. *Significant at 10%; *significant at 5%; ***significant at 1%
Conclusion
While these initial analyses suggest that the liquor store provisions of Transform Baltimore may have positive effects on crime reduction in the short run, evaluation of the actual implementation is necessary to confirm this. Prior closed liquor stores may be quite different from those targeted by the new provision, since they tend to be located in lower income, higher crime neighborhoods. And, affected liquor store closings are different from voluntary closures which may themselves be a response to changes in crime.
Additionally, our analysis suggests that the closures are targeted in areas that have lower income and higher crime. The policy is designed to eliminate all nonconforming liquor stores in Baltimore without considering owner characteristics. Additional qualitative and quantitative analyses of the closures will be needed to better understand the extent to which the law has inequitable impacts or unanticipated negative consequences for neighborhood residents in affected neighborhoods.
The liquor store provisions of Transform Baltimore should be monitored and evaluated as they are rolled out, and the impacts estimated to determine whether zoning can be used as an appropriate tool for increasing health equity. This monitoring may also provide opportunities to critically evaluate impacts and design companion policy approaches in an effort to optimize the desired impacts of the policy on neighborhood crime.
Appendix
Table 7.
Relationship between liquor store openings/closings and crime in Baltimore, MD, 2012–2017 with 2015 included
| (1) | (2) | |
|---|---|---|
| Violent crime | Property crime | |
| Poisson | Poisson | |
| Liquor store closings | − 0.000 | 0.013 |
| (0.001) | (0.000) | |
| Liquor store openings | 0.000 | − 0.002 |
| (0.004) | (0.000) | |
| Year fixed effects | Yes | Yes |
| Block group fixed effects | Yes | Yes |
| Individual block group time trends | Yes | Yes |
| Observations | 3990 | 4068 |
| Number of block groups | 665 | 678 |
Results are semi-elasticities of liquor store openings and closings on crime from a random trend model that includes block group fixed effects, year fixed effects, and time trends. Sample is a yearly panel of all block groups in Baltimore, Maryland from 2012 to 2017. Due to riots in 2015 and their relationship with liquor store closings, crime in that year was dropped and interpolated. Crime offenses refer to the number of incidents on each block group in each year. Robust standard errors in parentheses, clustered at the block group level. *Significant at 10%; *significant at 5%; ***significant at 1%
Funding Information
This work was supported by the Johns Hopkins twenty-first Century Cities Initiative. Thanks to Laurie Feinberg and her team at the City of Baltimore’s Department of Planning for their partnership in this research.
Footnotes
For brevity, we refer to this change as a closure throughout the rest of the paper, since that is the most likely option to be selected by the stores.
Author calculations based on total liquor stores in 2017
See Baltimore City Municipal Code Article 32: Zoning (As Enacted & Corrected, Effective June 5, 2017, by Ords. 16–581 & 17–015
And As Last Amended by Ord. 18–216).
Interview on Oct. 17th 2017
Interview on Oct. 17th 2017
Winkelmann, 2008
Fixed effects estimations in nonlinear models such as this one generally lead to inconsistent estimates. However, the Poisson distribution can be arbitrarily misspecified and any kind of serial correlation can be present and the fixed effects Poisson estimator is consistent under mild regularity conditions (Wooldridge, 2002 p 648). Provided that E(y| x) = exp(xβ), estimates of β are consistent even if the mean does not equal the variance. Therefore, a fixed effects model is appropriate and over dispersion can be ignored.
Winkelmann, 2008
Because of the riots in the city in 2015 which caused some liquor stores to close, we remove 2015 crimes from the dataset and interpolate them within each block group. This corrects endogeneity caused by crimes from the riots causing stores to close. Results are robust in sign but not significant to inclusion of 2015 crime (see Appendix, Table 7).
Publisher’s Note
Springer Nature remains neutral with regard to jurisdictional claims in published maps and institutional affiliations.
References
- 1.Abdul-Kareem M, Thornton D. Using zoning to create healthy food environments in Baltimore City. Washington, DC: Harrison Institute for Public Law – Georgetown University Law Center; 2009. [Google Scholar]
- 2.Billings SB. Local option, alcohol and crime. B E Journal of Economic Analysis and Policy. 2013;14(3):791–816. doi: 10.1515/bejeap-2013-0040. [DOI] [Google Scholar]
- 3.Chamberlain, Andrew. 2014. “Urban Crime and Spatial Proximity to Liquor: Evidence from a Quasi-Experiment in Seattle.” Working Paper. Available at SSRN: https://ssrn.com/abstract=2502610 or 10.2139/ssrn.2502610.
- 4.Conlin M, Dickert-Conlin S, Pepper J. The effect of alcohol prohibition on illicit drug-related crimes. J Law Econ. 2005;48(1):215–234. doi: 10.1086/428017. [DOI] [Google Scholar]
- 5.Lamar AS. Zoning as taxidermy: neighborhood conservation districts and the regulation of aesthetics. Indiana Law J. 2015;90:1525–1590. [Google Scholar]
- 6.Lipton R, Gruenewald P. The spatial dynamics of violence and alcohol outlets. J Stud Alcohol. 2002;63(2):187–195. doi: 10.15288/jsa.2002.63.187. [DOI] [PubMed] [Google Scholar]
- 7.Mosher JF, Treffers RD. State pre-emption, local control, and alcohol retail outlet density regulation. American Journal of Preventative Medicine. 2013;44(4):399–405. doi: 10.1016/j.amepre.2012.11.029. [DOI] [PubMed] [Google Scholar]
- 8.Rossen LM, Pollack KM. Making the connection between zoning and health disparities. Environmental Justice. 2012;5(3):119–127. doi: 10.1089/env.2011.0037. [DOI] [Google Scholar]
- 9.Scribner R, Cohen DR, Kaplan SG, Allen SH. Alcohol availability and homicide in New Orleans: conceptual considerations for small area analysis of the effect of alcohol outlet density. J Stud Alcohol. 1999;60(3):310–316. doi: 10.15288/jsa.1999.60.310. [DOI] [PubMed] [Google Scholar]
- 10.Spader J, Cortes A, Burnett K, Buron L, DiDomenico M, Jefferson A, Whitlow S, Buell JL, Redfearn C, Schuetz J. Evaluation of the neighborhood stabilization program. Bethesda, MD: Abt Associates Inc.; 2015. [Google Scholar]
- 11.Stacy, Christina Plerhoples, Joe Schilling, Ruthy Gourevitch, Jacob Lowy, Brady Meixell, and Rachel L.J. Thornton. 2019. “Bridging the housing and health policy divide: lessons in community development from Memphis and Baltimore.” Housing Policy Debate, forthcoming, 29, 403, 420 [DOI] [PMC free article] [PubMed]
- 12.Strum R, Cohen DA. Zoning for health? The year-old ban on new fast-food restaurants in South LA. Health Aff. 2009;28(6) [DOI] [PMC free article] [PubMed]


