

Abstract
Drug overdoses are a national and global epidemic. However, while overdoses are inextricably linked to social, demographic, and geographical determinants, geospatial patterns of drug-related admissions and overdoses at the neighborhood level remain poorly studied. The objective of this paper is to investigate spatial distributions of patients admitted for drug-related admissions and overdoses from a large, urban, tertiary care center using electronic health record data. Additionally, these spatial distributions were adjusted for a validated socioeconomic index called the Area Deprivation Index (ADI). We showed spatial heterogeneity in patients admitted for opioid, amphetamine, and psychostimulant-related diagnoses and overdoses. While ADI was associated with drug-related admissions, it did not correct for spatial variations and could not account alone for this spatial heterogeneity.
Electronic supplementary material
The online version of this article (10.1007/s11524-020-00436-8) contains supplementary material, which is available to authorized users.
Keywords: Drug overdoses, Epidemiology, Area deprivation, Socioeconomics, Opioid epidemic
Introduction
The use of geospatial analysis to target high-risk areas of drug overdose has allowed for a more nuanced understanding of the socioeconomic and demographic factors associated with overdose. Recent studies have demonstrated that while opioid overdoses still disproportionately affect higher-poverty areas and racial minorities, deaths have become more dispersed across affluent and impoverished neighborhoods [1]. While some studies have demonstrated a concentration of opioid overdose deaths in metropolitan areas [2], other studies have shown a broader geographical dispersion that is related to the type of drug of abuse [3–10]. Many of these studies suggest that usual classifications of geographic areas (e.g., urban vs. rural) may not be adequate when describing the changes in geographical distributions of drug overdoses [9].
A number of sociodemographic indices exist that link geographic areas with census-based data. One such indicator, the Area Deprivation Index (ADI) is an index of variables from the United States Census and American Community Survey that is tabulated at the census block group level. The components of ADI include theoretical domains of income, education, employment, and housing quality [11], and ADI has been used as a predictor for 30-day rehospitalization [12] and has been associated with broad health outcomes, such as high CMV seroprevalence among pregnant women [13] and diabetes prevalence [14].
Hence, in order to develop a better understanding of socioeconomic indicators and risk factors contributing to opioid and drug abuse, overdose, and death, we hypothesized that the validated ADI may correlate to drug overdose and drug-related hospitalization. Given that ADI is a neighborhood-level index, it is linked and thus dependent on geospatial context. In this retrospective study, we seek to determine whether neighborhood socioeconomic disadvantage as captured by ADI could be a useful metric to determine drug-related hospital admissions. In doing so, we also seek to characterize the spatial distribution of patients admitted to a large urban academic medical center in Durham County, NC, for drug-related admissions and overdoses. This would help understand neighborhood factors that predict higher risk of drug admissions. This could potentially be used as a tool for health policy decision-making for clinical action targeting the opioid and drug-related mortality epidemic.
Methods
Study Design and Population
This was a retrospective cohort study of patients admitted to Duke University Hospital Health System with a drug-related admission or drug poisoning-related admission (as identified by International Classification of Disease (ICD) codes—Tables S1 and S2) between June 1, 2013, and Feb 1, 2018.
Data Source
We searched within the Duke University Health System electronic health records to identify patients admitted for any conditions related to opioid, amphetamine, or psychostimulants. Multiple drug types were included because prevalence of these was identified using prespecified ICD codes related to acute drug-related admissions (Table 1). We further stratified patients who were admitted for drug overdoses as defined by ICD codes for poisoning-related admissions for the above drug classes. Given the wide range of possible ICD codes for drug-related admissions, ICD codes with fewer than 20 patients were not included in the study due to possible outliers in the coding process. We included patients whose address of residence was in Durham County, North Carolina. Residential addresses are geocoded within the Duke hospital electronic health records system, which generates longitude and latitude coordinates of each patient’s self-reported residence.
Table 1.
Characteristics of patients across drug-related admission and overdose cohorts
| Characteristics | All drug-related admissions | All drug-related overdoses | ||
|---|---|---|---|---|
| n = 10,352 | % | n = 859 | % | |
| Male | 5228 | 50.5 | 461 | 53.7 |
| Unknown gender | 1 | 0.0 | 0 | 0.0 |
| Female | 5123 | 49.5 | 398 | 46.3 |
| Dead | 2542 | 24.6 | 204 | 23.7 |
| Alive | 7810 | 75.4 | 655 | 76.3 |
| Black or African American | 3984 | 38.5 | 370 | 43.1 |
| Caucasian/White | 5733 | 55.4 | 446 | 51.9 |
| Multiracial | 155 | 1.5 | 14 | 1.6 |
| Hispanic | 232 | 2.2 | 17 | 2.0 |
| Asian | 42 | 0.4 | 3 | 0.3 |
| American Indian | 80 | 0.8 | 2 | 0.2 |
| Unknown race/ethnicity | 126 | 1.2 | 7 | 0.8 |
In addition to EHR data, the publicly available Area Deprivation Index (ADI) was used to evaluate the influence of neighborhood socioeconomic disadvantage on drug admissions and overdoses. ADI is a weighted composite of 17 variables from census and survey data [15]. This well-validated measure of socioeconomic variables ranks ADI from low (1—least disadvantaged) to high (10—most disadvantaged). Variables and weighting are described elsewhere [12, 15]. The objectives were to (1) examine the association between spatial characteristics and drug-related admissions; (2) examine the association between ADI and drug-related admissions; and (3) to adjust spatial distributions for ADI to determine if spatial heterogeneity could be abolished by considering ADI alone.
Statistical Analysis
Nonspatial statistics were used including chi-square and t tests as appropriate. For spatial analysis, we fit hierarchical Bayesian spatial models using the statistical programming language R (www.r-project.org) and the package INLA. The INLA package facilitates construction of hierarchical Bayesian models and makes use of integrated, nested LaPlace approximation to estimate the posterior distribution. For this study, our primary outcome variables were (1) the number of drug-related admissions per census block group and (2) the number of drug overdoses per census block group.
For this count-population approach to modeling, we used a spatial database of Duke patients as our population control. Patients of the Duke University Health System are not randomly distributed in space, and their density diminishes with increasing distance from the Duke facilities and clinics. For this reason, we aggregated total Duke patients by census block groups, which was the spatial unit of aggregation for our drug-related case counts. Our models were conditional autoregressive (CAR) models that used a Besag-York-Mollie spatial correlation structure [16]. We used a Poisson likelihood function after comparing Poisson, negative binomial, and binomial models. The percentile of ADI (based on statewide ADI values for NC) was our sole fixed effect, and total Duke patients were used as a population offset. Using a polygon shapefile of the census block groups in Durham County, NC, we constructed an adjacency matrix using the R packages sf, sp, and spdep. This allowed us to incorporate the spatial structure of our observations in our model. Cartographic output from our models was produced using the R packages ggplot2 and viridis, and the visualization of the posterior fixed effects used the package coefINLA.
The Bayesian posterior probability distribution of our models represents the prevalence of opioid admissions and overdoses (cases offset by the population at risk), which were observed and modeled at the level of the census block group. Cartographic output represents the modeled prevalence at this block group level throughout Durham County. For our fixed effect (ADI), we report the probability of a non-zero effect of ADI on this prevalence, and we report the change in opioid admission and overdose prevalence that would be expected with a 1 unit change in ADI. In our data preparation, we divided the ADI percentile values by 5, so that in our models, a 1 unit change in ADI would represent a change of 20 percentile.
Ethical Review
This study was approved by the Duke University Institutional Review Board. A waiver of informed consent was approved for this retrospective study.
Results
Using ICD diagnoses for patients with a drug-related diagnosis and those with an overdose-related diagnosis (Tables S1 and S2), we identified 10,352 and 859 patients, respectively, who were included in the initial analysis. Of those in the all drug diagnosis cohort, 3314 patients had geocoded addresses and an address in Durham County. Of the drug overdose cohort, 387 patients had geocoded addresses in Durham County and were included in geospatial modeling. Patient characteristics are shown in Table 1. In the all drug cohort, the median age was 49 years old (IQR 36, 59), 50.5% were male, 55.4% were White, and 38.5% were Black. Similar characteristics were noted in the overdose cohort, in which the median age was 48 years old (IQR 40, 57), 53.7% were male, 51.9% were White, and 43.1% were Black. Mortality presented in either cohort represents death recorded at any time, not necessarily during their index admission. Overdoses and admissions were closely correlated (Fig. 1).
Fig. 1.
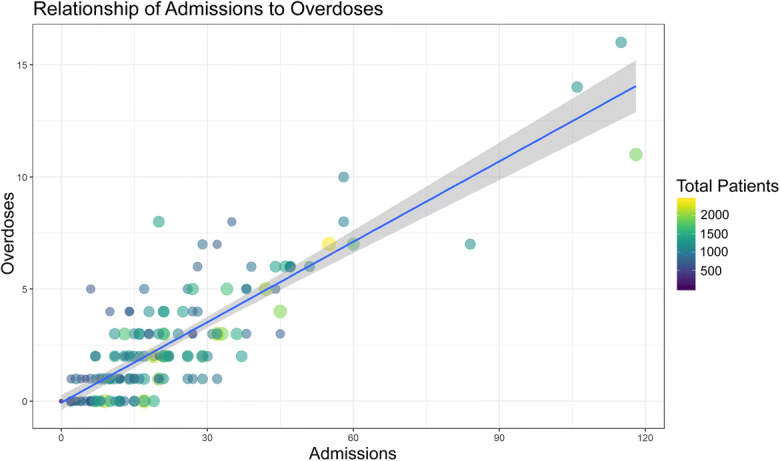
Scatterplot of drug-related admissions vs overdoses with point size and color mapping to the total number of patients
Higher ADI (greater neighborhood disadvantage) was associated with both more drug admissions (probability of a positive effect was 99.8% for admissions and 97.0% for overdoses) (Fig. 2). Every 20 percentile increase in ADI would correspond to a 1.03-fold increase in both admissions and overdoses, corresponding to an additional 1 admission for every 2000 patients and 1 overdose for every 20,000 patients (Fig. 2).
Fig. 2.

Posterior fixed effects plot looking at ADI associated with drug-related admissions and overdoses. ADI is scaled such that 1 represents a 20 percentile change in ADI. Note that the distributions do not cover 0 and thus would be extremely improbable that there is no effect of ADI on admissions for drug-related issues or overdoses
Both drug-related admissions and overdoses were geographically variable (Figs. 3 and 4). As a proportion of total Duke patients, the prevalence of drug-related admissions was between 0.4 and 8.3% within the block groups of Durham County. Drug overdoses ranged from 0.05 to 0.95%. In both cases, the highest prevalence was in the city of Durham in the center of Durham County, a higher population density urban area with a large minority population. Admissions and overdoses were less prevalent particularly to the south, which includes more affluent suburban communities.
Fig. 3.
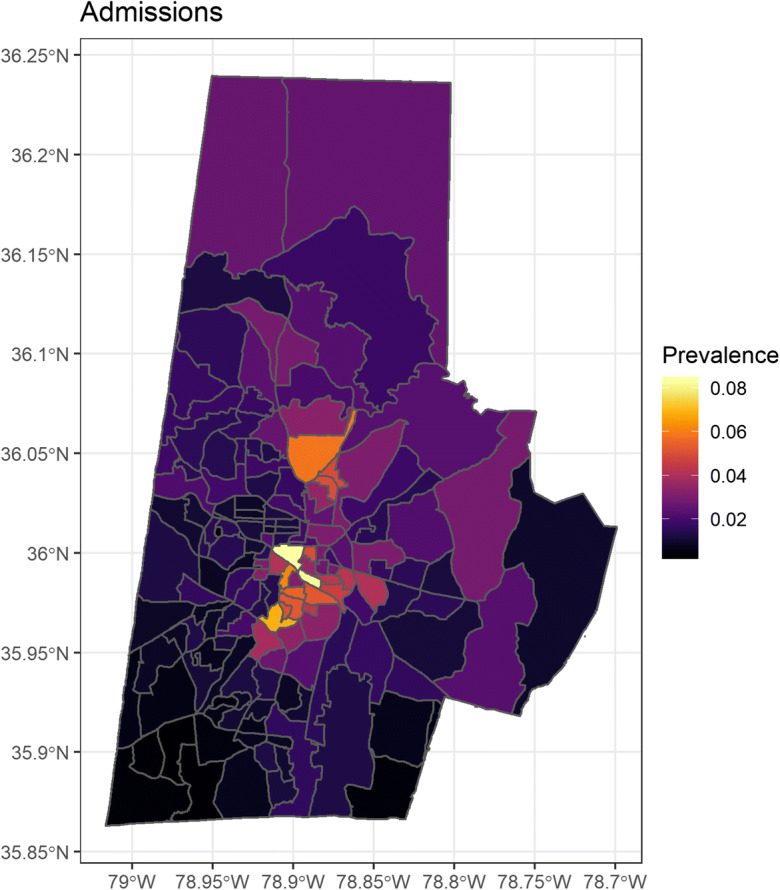
Bayesian spatial regression of drug-related admissions adjusted for ADI—color scale represents the rate ratio based on number of Duke patients per census block group
Fig. 4.
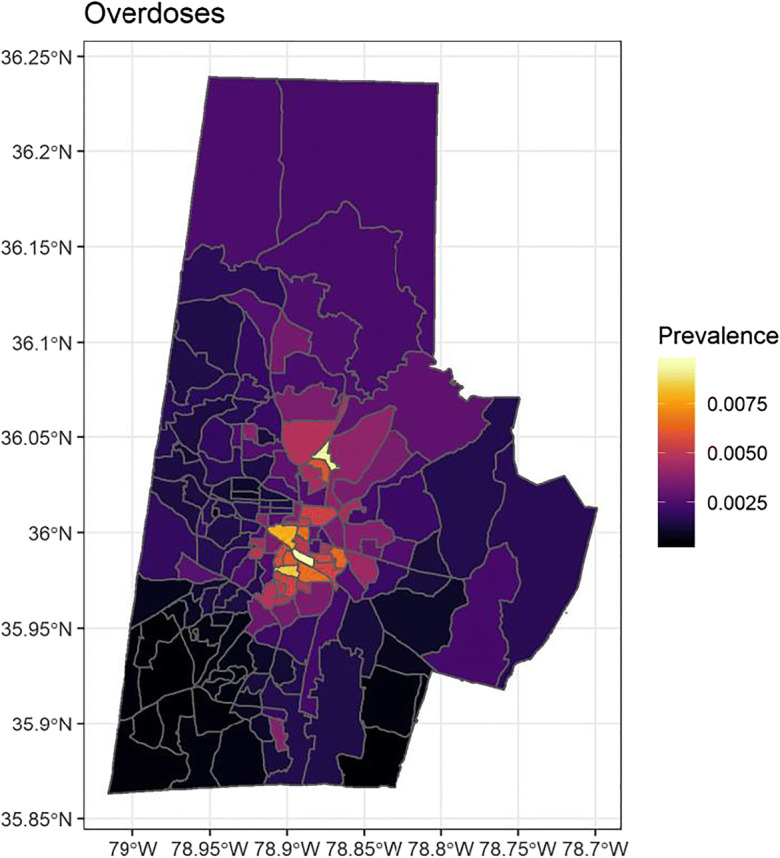
Bayesian spatial regression of drug-related overdoses adjusted for ADI—color scale represents the rate ratio based on number of Duke patients per census block group
Discussion
In this retrospective spatial analysis, we showed spatial heterogeneity in patients admitted for opioid, amphetamine, and psychostimulant-related diagnoses and overdoses in a large urban medical center in North Carolina. A number of urban neighborhoods were identified as having higher than expected rates of admission which remained present despite adjustment with a composite socioeconomic index. Notably, even though adjusting for ADI did not ablate spatial heterogeneity, neighborhood ADI was associated with a greater prevalence of drug-related admissions and overdoses.
The explanation for variability in geospatial distributions of patients, even when adjusted for differences in socioeconomic characteristics, remains unclear. The hypothesis that socioeconomic characteristics of specific neighborhoods or geographic areas are supported by various other studies [1, 17, 18]. However, specific social and economic determinants are numerous and the ability to isolate one variable, such as race, has led to conflicting conclusions regarding positive or negative associations with opioid overdoses [19, 20]. Similarly, studies of urban vs. rural differences in drug poisoning mortality have been inconsistent [21, 22]. Single socioeconomic component approaches may be incomplete measures of the complexity of any disease [12]. Socioeconomic indices that combine multiple different census-based variables may be better suited to assess such determinants than individual variables and indeed have been associated with opioid treatment disparities [23–25]. We used ADI in this analysis because it is well validated and has been mapped to nearly every neighborhood in the USA. This differs from other studies evaluating socioeconomic indices at the larger county or state level [25]. Our findings using ADI demonstrated a statistical association with drug-related diagnoses and overdoses.
The observation that geospatial heterogeneity changes minimally following ADI adjustment is notable for a number of reasons. While ADI does not contain health-related variables, it has been shown to correlate with a number of health outcomes, including 30-day rehospitalization [12], CMV seroprevalence in pregnancy [13], diabetes, blood pressure, and cholesterol control [26]. Hence, while it cannot capture all socioeconomic variables of a given neighborhood, it seems to represent a reasonable surrogate for the effect of neighborhood deprivation on health. The unchanged spatial heterogeneity pre- and post-ADI adjustment suggests that the observed spatial findings are associated with other unmeasured variables. While ADI contains notable components that have been shown to be individual risk factors for opioid overdoses [27], they may be negated by other components of ADI. Alternatively and more interestingly, the finding that ADI does not seem to explain the geographic patterns of drug exposure could be because drug use (e.g., opioid use) may be equally prevalent in resource-rich and resource-poor neighborhoods. This would suggest changing characteristics to the drug epidemic—i.e., they are becoming a universal and resource blind problem. This is supported by the fact that rates of heroin use and prescription opioids have been changing across different racial groups and rates have become less disparate over time [28]. Similarly, there may be a convergence in opioid mortality rates in various rural and urban counties [29]. Broader dispersion of overdose deaths has been suggested by other groups looking at San Francisco neighborhoods [1]. Spatiotemporal shifts have also been demonstrated for analgesic overdose fatalities in New York City but interestingly, not for methadone overdose fatalities during the same time period [18].
While national-, state-, and county-level geographic models improve understanding in overall trends of opioid prescribing, overdoses, and mortality [1, 30], our data support the use of higher granularity spatial analyses to characterize drug-related admissions [31]. Other studies looking at city-level overdoses demonstrate unique areas of overdose deaths associated with high- versus low-poverty areas depending on the culprit drug [1]. Other groups have found differences based on gender and ethnic makeup of neighborhoods in New York City [18]. Similarly, in a study of New York City neighborhoods, analgesic-related fatalities occurred more in lower-income and fragmented neighborhoods [17] based on census data.
The limitations of using ICD codes have been well described [32] and chart review to validate diagnoses was not performed. Such codes may not accurately and consistently define overdoses and similar drug-related issues from patient to patient. Specific codes may be vague and not uniformly applied to patient admissions of different clinical context. Similarly, our definition of “drug-related admissions” is a broad category and can easily represent a very divergent sequelae—for example, an admission for severe opioid-induced constipation in an elderly patient versus one for endocarditis in a young intravenous drug user. This results in a heterogeneous cohort which may be problematic when attempting to analyze neighborhood-level effects of such unrelated patient populations. Nonetheless, the use of ICD codes to isolate drug overdoses is consistent with the literature [17, 33]. Additionally, the Centers for Disease Control and Prevention provide ICD-9 and ICD-10 codes to help researchers and local government for database queries with the caveat that they are not standardized [34].
Other limitations should be noted as well. Longitude and latitude coordinates are based on patient-reported addresses. These are not externally verified, and a given address may not represent where a patient actually lives. Addresses may change as individuals move, and a most recent address may not represent the bulk of a patient’s exposures. Furthermore, address data may fail to adequately capture homeless patients. Finally, ADI is a snapshot index of socioeconomics of a given area and is reliant on census and survey data. Changing socioeconomic profiles of a given neighborhood (e.g., gentrification) will not be captured.
In addition to using broad categories for inclusion (as described above), we did not differentiate between drug classes (e.g., heroine vs. methadone vs. amphetamines) due to inability to confirm substance by autopsy or lab testing. Hence, different substances of abuse may have different spatial patterns, as has been described by other groups [1]. Lastly, while ADI is a well-validated index of broad socioeconomic variables, there are undoubtedly important unmeasured confounders that could contribute to spatial heterogeneity.
Conclusions
In this study, we found that there exists geospatial clustering of substance use-related admissions and overdoses compared with the general population. A well-validated socioeconomic index, ADI, is associated with an increased risk of admissions but does not correct for spatial variability suggesting unmeasured unique socioeconomic indicators associated with geographic regions. Alternatively, because ADI does not correct the spatial heterogeneity, the socioeconomic patterns of drug use may be changing such that socioeconomically affluent and impoverished areas may be similarly affected. We also demonstrate that ICD codes can be coupled with local coordinates via EMR for studying drug epidemics. These may have important policy implications regarding isolation of high-risk geographic locations and for future studies on how drug use, misuse, and overdoses change with temporally.
Electronic supplementary material
(DOCX 21 kb)
(DOCX 13 kb)
Acknowledgements
We would like to thank Dr. Thomas E. Buccheit and Dr. Steven D. Prakken for their discussion and brainstorming during the early phases of this project.
Compliance with Ethical Standards
This study was approved by the Duke University Institutional Review Board. A waiver of informed consent was approved for this retrospective study.
Footnotes
Publisher’s Note
Springer Nature remains neutral with regard to jurisdictional claims in published maps and institutional affiliations.
References
- 1.Visconti AJ, Santos GM, Lemos NP, Burke C, Coffin PO. Opioid overdose deaths in the city and county of San Francisco: prevalence, distribution, and disparities. J Urban Health. 2015;92(4):758–772. doi: 10.1007/s11524-015-9967-y. [DOI] [PMC free article] [PubMed] [Google Scholar]
- 2.Garfield J. E D: fatal overdose trends in major us cities: 1990–1997. Addiction Research & Thery. 2001;9(5):425–436. doi: 10.3109/16066350109141762. [DOI] [Google Scholar]
- 3.Brownstein JS, Green TC, Cassidy TA, Butler SF. Geographic information systems and pharmacoepidemiology: using spatial cluster detection to monitor local patterns of prescription opioid abuse. Pharmacoepidemiol Drug Saf. 2010;19(6):627–637. doi: 10.1002/pds.1939. [DOI] [PMC free article] [PubMed] [Google Scholar]
- 4.Havens JR, Talbert JC, Walker R, Leedham C, Leukefeld CG. Trends in controlled-release oxycodone (OxyContin) prescribing among Medicaid recipients in Kentucky, 1998-2002. J Rural Health. 2006;22(3):276–278. doi: 10.1111/j.1748-0361.2006.00046.x. [DOI] [PubMed] [Google Scholar]
- 5.Dasgupta N, Jonsson Funk M, Brownstein J. Comparing unintentional opioid poisoning mortality in metropolitan and non-metropolitan counties, United States, 1999–2003. In: Thomas Y, Richardson D, Cheung I, editors. Geography and drug addiction. New York: Springer; 2008. [Google Scholar]
- 6.McLafferty S. Placing substance abuse. In: Thomas Y, Richardson D, Cheung I, editors. Geography and drug addiction. New York: Springer; 2008. [Google Scholar]
- 7.Paulozzi LJ, Ryan GW. Opioid analgesics and rates of fatal drug poisoning in the United States. Am J Prev Med. 2006;31(6):506–511. doi: 10.1016/j.amepre.2006.08.017. [DOI] [PubMed] [Google Scholar]
- 8.Paulozzi LJ, Xi Y. Recent changes in drug poisoning mortality in the United States by urban-rural status and by drug type. Pharmacoepidemiol Drug Saf. 2008;17(10):997–1005. doi: 10.1002/pds.1626. [DOI] [PubMed] [Google Scholar]
- 9.Rigg KK, Monnat SM, Chavez MN. Opioid-related mortality in rural America: geographic heterogeneity and intervention strategies. Int J Drug Policy. 2018;57:119–129. doi: 10.1016/j.drugpo.2018.04.011. [DOI] [PubMed] [Google Scholar]
- 10.Zerzan JT, Morden NE, Soumerai S, Ross-Degnan D, Roughead E, Zhang F, Simoni-Wastila L, Sullivan SD. Trends and geographic variation of opiate medication use in state Medicaid fee-for-service programs, 1996 to 2002. Med Care. 2006;44(11):1005–1010. doi: 10.1097/01.mlr.0000228025.04535.25. [DOI] [PubMed] [Google Scholar]
- 11.Health UoWSoMaP: Area Deprivation Index. v2.0 edn. Madison, WI; 2015.
- 12.Kind AJ, Jencks S, Brock J, Yu M, Bartels C, Ehlenbach W, Greenberg C, Smith M. Neighborhood socioeconomic disadvantage and 30-day rehospitalization: a retrospective cohort study. Ann Intern Med. 2014;161(11):765–774. doi: 10.7326/M13-2946. [DOI] [PMC free article] [PubMed] [Google Scholar]
- 13.Lantos PM, Hoffman K, Permar SR, Jackson P, Hughes BL, Kind A, Swamy G. Neighborhood disadvantage is associated with high cytomegalovirus seroprevalence in pregnancy. J Racial Ethn Health Disparities. 2018;5(4):782–786. doi: 10.1007/s40615-017-0423-4. [DOI] [PMC free article] [PubMed] [Google Scholar]
- 14.Sheets L, Petroski GF, Jaddoo J, Barnett Y, Barnett C, Kelley LEH, Raman V, Kind AJH, Parker JC. The effect of neighborhood disadvantage on diabetes prevalence. AMIA Annu Symp Proc. 2017;2017:1547–1553. [PMC free article] [PubMed] [Google Scholar]
- 15.Singh GK. Area deprivation and widening inequalities in US mortality, 1969-1998. Am J Public Health. 2003;93(7):1137–1143. doi: 10.2105/AJPH.93.7.1137. [DOI] [PMC free article] [PubMed] [Google Scholar]
- 16.Besag J, York J, Mollie A. Bayesian image restoration, with two applications in spatial statistics. Ann Inst Stat Math. 1991;43(1):1–49. doi: 10.1007/BF00116466. [DOI] [Google Scholar]
- 17.Cerda M, Ransome Y, Keyes KM, Koenen KC, Tardiff K, Vlahov D, Galea S. Revisiting the role of the urban environment in substance use: the case of analgesic overdose fatalities. Am J Public Health. 2013;103(12):2252–2260. doi: 10.2105/AJPH.2013.301347. [DOI] [PMC free article] [PubMed] [Google Scholar]
- 18.Cerda M, Ransome Y, Keyes KM, Koenen KC, Tracy M, Tardiff KJ, Vlahov D, Galea S. Prescription opioid mortality trends in New York City, 1990-2006: examining the emergence of an epidemic. Drug Alcohol Depend. 2013;132(1–2):53–62. doi: 10.1016/j.drugalcdep.2012.12.027. [DOI] [PMC free article] [PubMed] [Google Scholar]
- 19.Green CR, Ndao-Brumblay SK, West B, Washington T. Differences in prescription opioid analgesic availability: comparing minority and white pharmacies across Michigan. J Pain. 2005;6(10):689–699. doi: 10.1016/j.jpain.2005.06.002. [DOI] [PubMed] [Google Scholar]
- 20.Burgess DJ, Phelan S, Workman M, Hagel E, Nelson DB, Fu SS, Widome R, van Ryn M. The effect of cognitive load and patient race on physicians’ decisions to prescribe opioids for chronic low back pain: a randomized trial. Pain Med. 2014;15(6):965–974. doi: 10.1111/pme.12378. [DOI] [PubMed] [Google Scholar]
- 21.Piercefield E, Archer P, Kemp P, Mallonee S. Increase in unintentional medication overdose deaths: Oklahoma, 1994-2006. Am J Prev Med. 2010;39(4):357–363. doi: 10.1016/j.amepre.2010.05.016. [DOI] [PubMed] [Google Scholar]
- 22.Hall AJ, Logan JE, Toblin RL, Kaplan JA, Kraner JC, Bixler D, Crosby AE, Paulozzi LJ. Patterns of abuse among unintentional pharmaceutical overdose fatalities. JAMA. 2008;300(22):2613–2620. doi: 10.1001/jama.2008.802. [DOI] [PubMed] [Google Scholar]
- 23.Joynt M, Train MK, Robbins BW, Halterman JS, Caiola E, Fortuna RJ. The impact of neighborhood socioeconomic status and race on the prescribing of opioids in emergency departments throughout the United States. J Gen Intern Med. 2013;28(12):1604–1610. doi: 10.1007/s11606-013-2516-z. [DOI] [PMC free article] [PubMed] [Google Scholar]
- 24.Ndlovu M, Bedson J, Jones PW, Jordan KP. Pain medication management of musculoskeletal conditions at first presentation in primary care: analysis of routinely collected medical record data. BMC Musculoskelet Disord. 2014;15:418. doi: 10.1186/1471-2474-15-418. [DOI] [PMC free article] [PubMed] [Google Scholar]
- 25.Gebauer S, Salas J, Scherrer JF. Neighborhood socioeconomic status and receipt of opioid medication for new back pain diagnosis. J Am Board Fam Med. 2017;30(6):775–783. doi: 10.3122/jabfm.2017.06.170061. [DOI] [PubMed] [Google Scholar]
- 26.Durfey SNM, Kind AJH, Buckingham WR, DuGoff EH, Trivedi AN. Neighborhood disadvantage and chronic disease management. Health Serv Res. 2019;54(Suppl 1):206–216. doi: 10.1111/1475-6773.13092. [DOI] [PMC free article] [PubMed] [Google Scholar]
- 27.Ho JY. The contribution of drug overdose to educational gradients in life expectancy in the United States, 1992-2011. Demography. 2017;54(3):1175–1202. doi: 10.1007/s13524-017-0565-3. [DOI] [PMC free article] [PubMed] [Google Scholar]
- 28.Pouget ER, Fong C, Rosenblum A. Racial/ethnic differences in prevalence trends for heroin use and non-medical use of prescription opioids among entrants to opioid treatment programs, 2005-2016. Subst Use Misuse. 2018;53(2):290–300. doi: 10.1080/10826084.2017.1334070. [DOI] [PubMed] [Google Scholar]
- 29.McClellan CB. Disparities in opioid related mortality between United States counties from 2000 to 2014. Drug Alcohol Depend. 2019;199:151–158. doi: 10.1016/j.drugalcdep.2019.03.005. [DOI] [PubMed] [Google Scholar]
- 30.Mosher H, Zhou Y, Thurman AL, Sarrazin MV, Ohl ME. Trends in hospitalization for opioid overdose among rural compared to urban residents of the United States, 2007-2014. J Hosp Med. 2017;12(11):925–929. doi: 10.12788/jhm.2793. [DOI] [PubMed] [Google Scholar]
- 31.Wagner J, Neitzke-Spruill L, O’Connell D, Highberger J, Martin SS, Walker R, Anderson TL. Understanding geographic and neighborhood variations in overdose death rates. J Community Health. 2019;44(2):272–283. doi: 10.1007/s10900-018-0583-0. [DOI] [PubMed] [Google Scholar]
- 32.Strom BL. Data validity issues in using claims data. Pharmacoepidemiol Drug Saf. 2001;10(5):389–392. doi: 10.1002/pds.610. [DOI] [PubMed] [Google Scholar]
- 33.Seth P, Scholl L, Rudd RA, Bacon S. Overdose deaths involving opioids, cocaine, and psychostimulants - United States, 2015-2016. MMWR Morb Mortal Wkly Rep. 2018;67(12):349–358. doi: 10.15585/mmwr.mm6712a1. [DOI] [PMC free article] [PubMed] [Google Scholar]
- 34.Presription Drug Overdose Data & Statistics - Guide to ICD-9-CM and ICD-10 Codes Related to Poisoning and Pain. In: Prevention DoUI, Version 1.3 editor. Atlanta, GA: National Center for Injury Prevention and Control - Centers for Disease Control and Prevention; 2013.
Associated Data
This section collects any data citations, data availability statements, or supplementary materials included in this article.
Supplementary Materials
(DOCX 21 kb)
(DOCX 13 kb)