

Summary
Amyloid precursor protein (APP) is associated with both familial and sporadic forms of Alzheimer’s disease. Despite its importance, the role of APP family in neuronal function and survival remains unclear due to perinatal lethality exhibited by knockout mice lacking all three APP family members. Here we report that selective inactivation of APP family members in excitatory neurons of the postnatal forebrain results in neither cortical neurodegeneration nor increases in apoptosis and gliosis up to ~2 years of age. However, hippocampal synaptic plasticity, learning and memory are impaired in these mutant mice. Furthermore, hippocampal neurons lacking APP family exhibit hyperexcitability, as evidenced by increased neuronal spiking in response to depolarizing current injections, whereas blockade of Kv7 channels mimics and largely occludes the effects of APP family inactivation. These findings demonstrate that APP family is not required for neuronal survival, and suggest that APP family may regulate neuronal excitability through Kv7 channels.
Keywords: APLP1, APLP2, Presenilin, M-channel, knockout, conditional knockout, cerebral cortex, hippocampus, apoptosis, LTP
eTOC Blurb
Despite the importance of the amyloid precursor protein in Alzheimer’s disease, it remains unclear whether it supports neuronal survival in the cerebral cortex during aging. Lee et al. show that the amyloid precursor protein family is dispensable for neuronal survival but is required for regulating neuronal excitability and synaptic plasticity.
Introduction
The amyloid precursor protein (APP) was the first protein associated with sporadic Alzheimer’s disease (AD) through isolation of amyloid fibrils from postmortem AD brains and identification of its partial amino acid sequence (Glenner and Wong, 1984). Subsequently, mutations in APP were reported in hereditary cerebral hemorrhage with amyloidosis (Levy et al., 1990; Van Broeckhoven et al., 1990) and familial AD (FAD) (Goate et al., 1991). To date, more than 30 mutations have been reported in APP, all surrounding the α-, β- or γ-secretase cleavage sites (alzforum.org/mutations/app). The genetic link of APP mutations to FAD and the presence of amyloid peptides, which result from the β- and γ-secretase cleavages of APP, in sporadic AD brains highlight the importance of APP in AD pathogenesis.
APP is a type I transmembrane protein evolutionarily conserved throughout the animal kingdom, and it has the highly conserved E1 and E2 domains in the extracellular region and the YENPTY motif near the C-terminus (Zheng and Koo, 2006). In mammals APP has two homologues, amyloid precursor-like proteins 1 and 2 (APLP1 and APLP2), which were identified based on their sequence homology (Wasco et al., 1992; Wasco et al., 1993). Genetic analysis of single, double and triple germline knockout (KO) mice provided experimental support for functional redundancy among APP family members (Heber et al., 2000; Herms et al., 2004; Muller et al., 1994; von Koch et al., 1997; Zheng et al., 1995). The phenotypes of APP KO mice were quite subtle (Dawson et al., 1999; Muller et al., 1994; Phinney et al., 1999; Seabrook et al., 1999; Zheng et al., 1995), whereas APP/APLP2 double KO mice displayed highly penetrant early postnatal lethality and APP/APLP1/APLP2 triple KO (TKO) mice exhibited perinatal lethality (Heber et al., 2000; Herms et al., 2004; von Koch et al., 1997). The genetic redundancy and the perinatal lethality of germline TKO mice precluded the study of the function of APP family in the adult and the aging brain. Thus, despite the importance of APP in AD pathogenesis, it was unclear whether APP family is required for neuronal survival in the cerebral cortex during aging.
To address this question, we circumvented the requirement of APP family in embryonic development and generated APP/APLP1/APLP2 conditional TKO (cTKO) mice, in which all APP family members are selectively inactivated in excitatory neurons postnatally in the forebrain. In contrast to the perinatal lethality of germline TKO mice, cTKO mice are grossly normal. To our surprise, inactivation of all three members of the APP family in excitatory neurons of the cerebral cortex did not result in neurodegeneration up to ~2 years of age. However, hippocampal spatial learning and memory are impaired in cTKO mice at 3 months of age, and long-term potentiation (LTP) and NMDA receptor-mediated responses are also reduced in the hippocampal Schaffer collateral (SC) - CA1 pathway. While basal synaptic transmission is unaffected, paired-pulse facilitation (PPF) and synaptic facilitation are enhanced in cTKO mice. Moreover, hippocampal CA1 pyramidal neurons from cTKO mice exhibit depolarized resting membrane potential, lower action potential threshold, and higher spike firing frequency, indicating enhanced neuronal excitability. Furthermore, pharmacological inhibition of Kv7 channels, the M-current mediating voltage-gated potassium channel, in hippocampal slices mimics and largely occludes the neuronal excitability phenotypes observed in CA1 neurons from cTKO mice. Together, these findings demonstrate that APP family is not required for cortical neuronal survival during aging, and suggest that APP family may regulate neuronal excitability at least in part through Kv7 channels.
Results
Generation and Molecular Characterization of cTKO Mice
APP, APLP1 and APLP2 share high levels of sequence homology and several conserved motifs (Figure 1A). To circumvent the requirement of APP family in embryonic development, we generated cTKO mice, in which all three APP family members are inactivated selectively in excitatory neurons of the cerebral cortex. To introduce two loxP sites into the APP, APLP1 or APLP2 genomic locus flanking the promoter and exon 1 (APP, APLP2) or exons 1 and 2 (APLP1), we first generated the targeting vector for each gene and then transfected it into embryonic stem (ES) cells (Figures 1B, S1A, S1C, S1E). The ES cell clones carrying the proper homologous recombination events were identified by Southern analysis using the 3’ (APP) or the 5’ (APLP1 and APLP2) external probes (Figure S1B, S1D, S1F), and further validated by sequencing following genomic PCR. Correctly targeted ES cell clones were then used to produce heterozygous APP, APLP1, or APLP2 mutant mice carrying the targeted allele, which were crossed with the Actin-FLP mouse (Rodriguez et al., 2000) to remove the PGK-NEO selection cassette flanked by the two FRT sites to generate the floxed alleles (Figure S1A, S1C, S1E). The resulting heterozygous and homozygous floxed APP, APLP1, and APLP2 mice were confirmed by Southern analysis using both the 5’ and the 3’ external probes (Figures S1A–F). Northern and Western analyses showed normal levels and sizes of APP, APLP1, and APLP2 mRNAs (data not shown) and proteins (Figure S1G–I) in the cerebral cortex of homozygous floxed mice, indicating that introduction of the loxP sequences does not affect transcription, splicing and translation.
Figure 1. Selective Inactivation of APP, APLP1 and APLP2 in cTKO Mice.

(A) Schematic illustrations of APP, APLP1, and APLP2 showing conserved protein structure and domains. APP695 is the abundant isoform derived from exons 1–6, 9–18; APLP1654 is derived from exons 1–17; APLP2751 is derived from exons 1–13, 15–18 (based on Ensembl Genome Database: APP, ENSMUSG00000022892; APLP1, ENSMUSG00000006651; APLP2, ENSMUSG00000031996); SP: signaling peptide; E1: the extracellular domain containing the heparin-binding motif, the growth factor-like domain, and the cooper- and zinc-binding motif; Ac: an acidic domain; KPI: the Kunitz-type protease inhibitor domain; E2: the extracellular domain containing the heparin-binding motif and the random coiled region; Aβ: the amyloid beta peptide; Y: the YENPTY motif. (B) Schematic illustrations of the gene structures of APP, APLP1, and APLP2. The blue (APP), green (APLP1), and orange (APLP2) boxes represent exons encoding the protein sequences. The gray boxes represent the 5’ and 3’ UTRs. The exons are not drawn to scale, and exon 1 contains the start codon ATG. The promoter and the first exon (for APP and APLP2) or the first two exons (for APLP1) are flanked by two loxP sites (red arrowheads). (C) Reduced levels of the APP, APLP1, or APLP2 mRNA in the cortex of cKO mice at 2–3 months of ages, relative to controls. The remaining mRNA detected in the cortex of cKO mice is likely due to APP, APLP1, or APLP2 expression in interneurons and glia, where the Camk2a-Cre transgene is not expressed. (D) Dramatic decreases of APP, APLP1 and APLP2 proteins in the neocortex (NCX) of cTKO mice at the age of 3 months. (E-J”) Immunohistochemical analysis shows abundant APP immunoreactivity (green), which co-localizes with NeuN immunoreactivity (red), in the NCX and hippocampal area CA1 (CA1) of control mice, whereas APP immunoreactivity is largely eliminated in the NCX (F) and hippocampal area CA1 (H) of cTKO mice. Most GAD67-immunoreactive (red) interneurons in the NCX of control mice appear to co-express APP (I”), and the few APP-immunoreactive cells in the NCX of cTKO mice appear to be co-labeled with GAD67 immunoreactivity (J”). Scale bar: 100 μm.
All data represent mean ± SEM (**p<0.01, ***p<0.001, ****p<0.0001). The value in the column indicates the number of mice used in each experiment.
See also Figure S1
We then bred floxed APP, APLP1, and APLP2 mice together to generate triple floxed mice, which were further crossed with Camk2a-Cre transgenic mice to generate cTKO mice (fAPP/fAPP; fAPLP1/fAPLP1; fAPLP2/fAPLP2; Camk2a-Cre). We previously used the same Camk2a-Cre transgene to delete Presenilin-1 in excitatory neurons of the cerebral cortex beginning at postnatal day 18 (Yu et al., 2001). Cre-mediated deletions of the floxed promoter region and the first exon(s) (APP 2.1kb, APLP1 2.8kb, APLP2 1.5kb) are similar to those in germline APP KO (Zheng et al., 1995), APLP1 KO (Heber et al., 2000) and APLP2 KO (von Koch et al., 1997) mice (Figures 1B, S1A, S1C, S1E). Indeed, Northern analysis showed dramatic reduction of APP, APLP1 and APLP2 mRNAs in the cortex of the respective single cKO mice at 2–3 months of age (Figure 1C). Western blotting confirmed selective decreases of APP, APLP1 and APLP2 in the neocortex but not in the cerebellum of cTKO mice at 3 months of age (Figure 1D). Immunohistochemical analysis revealed co-localization of APP and NeuN immunoreactivity in the neocortex and hippocampus of control mice, whereas APP immunoreactivity is largely eliminated in cTKO brains (Figure 1E–H”). APP is also expressed in GAD67-immunoreactive interneurons, and the co-localization seems unaffected in cTKO brains (Figure 1I–J”). These data demonstrate selective inactivation of APP family in the cerebral cortex of cTKO mice by 3 months of age.
Lack of Neurodegeneration in cTKO Mice
In contrast to the perinatal lethality of germline TKO mice (Herms et al., 2004), cTKO mice appear normal with normal body weight (e.g. at 22 months, Control: 43.1±2.6 g; cTKO: 42.6±2.7 g; n=15–17 per genotype, p=0.88, Student’s t-test). To evaluate the consequence of APP family inactivation in the cerebral cortex, we performed histological analysis of cTKO and littermate controls at 3 months of age, and quantified the volume and neuron number in the cerebral cortex using stereological methods. Nissl staining revealed no gross abnormality in cTKO brains, and the volume of the neocortex (NCX) and the hippocampus (HP) is similar between cTKO mice and littermate controls (Figure 2A, 2C; NCX: p=0.17, HP: p=0.68, Student’s t-test). The number of NeuN+ neurons is also unchanged in the neocortex of cTKO mice (Figure 2B, 2D; p=0.72, Student’s t-test). Western analysis showed similar levels of dendritic marker MAP2, and synaptic markers, synaptophysin (SYP), synaptosomal nerve-associated protein 25 (SNAP25) and postsynaptic density protein 95 (PSD95) in cortical lysates from cTKO and control mice at the age of 3 months (Figure 2E).
Figure 2. Absence of Neurodegeneration in cTKO Mice.

(A) Top: Nissl staining of comparable sagittal sections of cTKO mice and littermate controls at the ages of 3, 12, and 22 months shows normal gross morphology in the cTKO brain. Bottom: Higher power views of the boxed areas show no overt alteration in the neocortex and hippocampus of cTKO mice. Scale bar: 100 μm. (B) Top: NeuN immunostaining of comparable sagittal sections of cTKO and control brains at the ages of 3, 12, and 22 months. Bottom: Higher power views of the boxed areas in the neocortex of cTKO and control mice. Scale bar: 100 μm. (C) Stereological quantification shows similar volume of the neocortex and the hippocampus between cTKO and control mice at 3, 12, and 22 months of age (NCX: F2, 38=1.27, p=0.22; 3M: p=0.44, 12M: p=0.58, 22M: p>0.99; HP: F2, 38=0.06, p=0.73; 3, 12, 22M: p>0.99, two-way ANOVA with Bonferroni’s post-hoc comparisons). (D) Stereological quantification shows unchanged neuron number in the neocortex and hippocampal area CA1 of cTKO mice (NCX: F2, 38=0.55, p=0.67; 3, 12, 22M: p>0.99, two-way ANOVA with Bonferroni’s post-hoc comparisons; CA1: p=0.26, Student’s t-test). (E) Western analysis shows unchanged levels of dendritic and synaptic markers in the neocortex of cTKO mice at 3 months of age (MAP2: p=0.43, SYP: p=0.62, SNAP25: p=0.77, PSD95: p=0.25, Student’s t-test). All values are normalized to β-Actin. (F) Left: Representative images of active caspase-3-immunoreactive cells in the neocortex cTKO mice and controls at 22 months of age. Right: Stereological quantification of apoptotic cells in the neocortex shows no significant difference between cTKO mice and controls (p=0.45, Student’s t-test). Scale bar: 50 μm.
All data represent mean ± SEM. The value in the column indicates the number of mice used in each experiment.
See also Figure S2
Another gene family linked to FAD, the Presenilin (PS) genes, is essential for cortical neuronal survival, as indicated by increases of apoptosis at 2 months of age followed by age-dependent, striking neuronal loss in PS conditional double KO mice using the same Camk2a-Cre transgene (Saura et al., 2004; Wines-Samuelson et al., 2010). To determine whether the APP family is similarly required for neuronal survival in the aging brain, we performed histological analysis of cTKO mice and littermate controls at the ages of 12 and 22 months. Stereological quantification revealed normal volume of the neocortex and hippocampus in cTKO mice (Figure 2C; NCX: F2, 38=1.27, p=0.22; HP: F2, 38=0.06, p=0.73, two-way ANOVA). Quantification of NeuN+ neurons showed normal neuron number in the neocortex of cTKO mice (Figure 2D; F2, 38=0.55, p=0.67, two-way ANOVA). Moreover, the number of NeuN+ neurons in hippocampal area CA1 is also unchanged in cTKO mice (Figure 2D; p=0.26, Student’s t-test). These data demonstrate that cTKO mice do not develop neurodegeneration in the cerebral cortex.
To examine whether apoptosis is increased in the cerebral cortex of aged cTKO mice, we performed immunostaining using an antibody specific for the active form of caspase-3, a marker for apoptotic cells. Using stereological quantification methods, we found that the number of active caspase-3-positive cells is similar in the neocortex between cTKO and control mice at 22 months of age (Figure 2F; p=0.45, Student’s t-test;). The TUNEL assay further confirmed similar numbers of apoptotic cells in the neocortex of cTKO mice (Figure S2A). In addition, levels of dendritic and synaptic markers are also unchanged in the neocortex of cTKO mice at 22 months of age (Figure S2B). These data show that cortical neurons lacking APP family survive normally in the aging brain.
It was previously reported that APP KO mice develop astrogliosis as shown by increased GFAP immunoreactivity in the cerebral cortex at 14 weeks of age, though astrogliosis was only detected in 4 out of 6 APP KO mice (Zheng et al., 1995). To determine whether inactivation of APP family leads to increases of astrogliosis, we performed Western and immunohistochemical analyses. Consistent with earlier findings in APP KO mice (Zheng et al., 1995), GFAP levels vary among individual mice of either control or cTKO mice (Figure 3). Interestingly, Western analysis showed significant age-dependent increases of GFAP levels (e.g. from 3 to 12 or 22 months in the neocortex) in both control and cTKO groups (Figure 3A, 3B). Immunohistochemical analysis further indicated age-dependent increases of GFAP immunoreactivity (e.g. from 3 to 22 months in the neocortex) in both control and cTKO groups (Figure 3C). While there is generally no significant difference in GFAP levels between cTKO and control mice assessed by Western or quantitative immunohistochemical analysis (Figure 3A–D), GFAP-immunoreactive areas are significantly higher in the hippocampus of cTKO mice at the age of 3 months (Figure 3D). Overall, inactivation of APP family does not have a major impact on astrogliosis during aging.
Figure 3. Largely Normal Astrogliosis in the Cerebral Cortex of cTKO Mice.
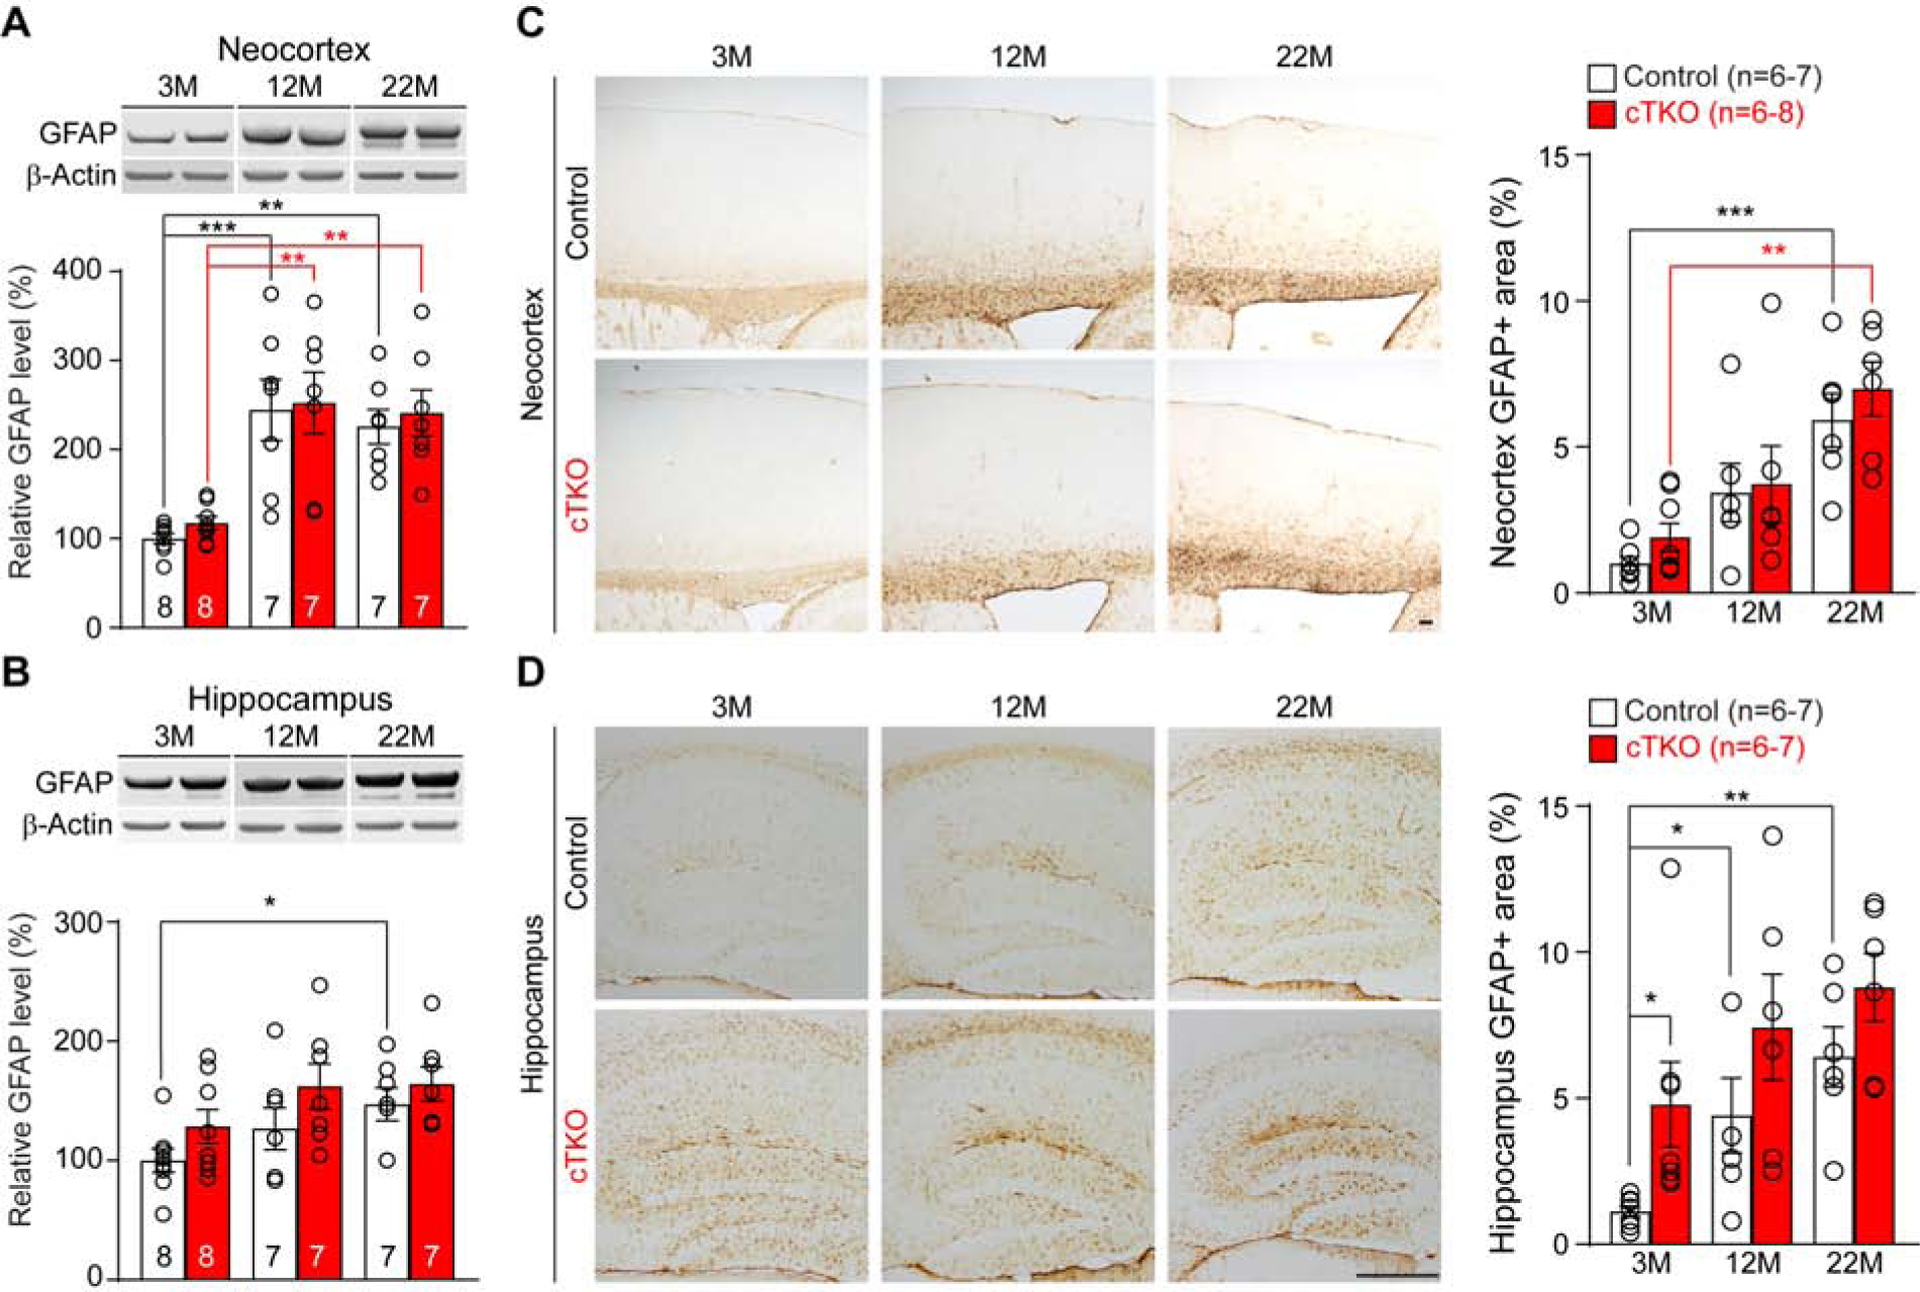
(A) Western analysis shows age-dependent increases of GFAP in control and cTKO mice from 3 to 12 months (Control: p=0.0003; cTKO: p=0.0015, one-way ANOVA with Dunnett’s post-hoc comparisons) and from 3 to 22 months (Control: p=0.0013; cTKO: p=0.0032, one-way ANOVA with Dunnett’s post-hoc comparisons). However, there is no genotypic difference between cTKO and controls (F2, 38=0.02, p=0.98, two-way ANOVA). All values are normalized to β-Actin. (B) Western analysis shows significant increases of GFAP in control mice from 3 to 22 months (p=0.0472, one-way ANOVA with Dunnett’s post-hoc comparisons). There is no significant difference between cTKO and controls (F2, 38=0.19, p=0.83, two-way ANOVA). All values are normalized to β-Actin. (C) Stereological quantification of GFAP-immunoreactive areas shows significant increases from 3 to 22 months in control and cTKO mice (Control: p=0.0005; cTKO: p=0.0015, one-way ANOVA with Dunnett’s post-hoc comparisons). There is no genotypic difference between cTKO and control mice (F2, 33=0.11, p=0.89, two-way ANOVA). Scale bar: 100 μm. (D) Stereological quantification of GFAP-immunoreactive areas shows age-dependent increases in control mice (3M vs. 12M, p=0.0363; 3M vs. 22M, p=0.0014, one-way ANOVA with Dunnett’s post-hoc comparisons) and genotypic increases in cTKO mice at 3 months (p=0.03, Student’s t-test). There is no age-dependent genotypic difference between cTKO and control groups (F2, 32=0.14, p=0.87, two-way ANOVA). Scale bar: 100 μm.
All data represent mean ± SEM (*p<0.05, **p<0.01, ***p<0.001). The value in the column indicates the number of mice used in each experiment.
Learning and Memory Deficits in cTKO Mice
We further examined cTKO mice and littermate controls at the age of 3 months in various behavioral paradigms for abnormalities in motor coordination, and learning and memory. Involuntary movement and motor coordination assessed by the accelerated rotarod test were similar between cTKO mice and controls (Figure 4A). Moreover, the open field test showed that cTKO and control mice exhibited similar horizontal and vertical movements, and spent similar amount of time in the margin or the center of the open field arena (Figure 4B). To determine the impact of APP/APLP1/APLP2 inactivation on spatial learning and memory, we assessed cTKO and control mice in the hidden platform version of the Morris water maze task. We found that the escape latency of both cTKO and control mice improved during the 13-day training course (Figure 4C; p<0.0001, two-way ANOVA Tukey’s post-hoc comparisons). However, cTKO mice exhibited significantly longer latencies during the 13-day training period (Figure 4C; F1, 28=4.39, p=0.045, two-way ANOVA). While both genotypic groups showed a preference for the target quadrant, relative to each of the other three quadrants, in the post-training probe trials at days 7 and 13, cTKO mice displayed significantly lower target quadrant occupancy in the probe test at day 13, relative to control mice (Figure 4E; p=0.02, Student’s t-test). Both cTKO and control mice showed similar escape latencies in the visible platform task (Figure 4D; p=0.39, Student’s t-test), suggesting that the learning and memory impairment observed in cTKO mice is unlikely due to vision defects. These data indicate that inactivation of APP family results in impaired spatial learning and memory.
Figure 4. Impaired Hippocampal Learning and Memory in cTKO Mice.

(A) During the rotarod test, cTKO mice and littermate controls show similar latencies to fall off an accelerating rod (F1, 14=0.03, p=0.86, two-way ANOVA). The average time before falling off the rod is shown for each of the three consecutive trials. (B) During the open field test, cTKO and control mice display similar horizontal (p=0.93) and vertical (p=0.79) spontaneous movements as well as the time spent on the margin or the center (p=0.44, Student’s t-test). (C) During the 13-day training period of the water maze task, cTKO and littermate control mice improved their performance (F12, 364=35.97, p<0.0001, two-way ANOVA; day 1 vs. 13 Tukey’s post-hoc comparisons, p<0.0001). The escape latency of cTKO mice is significantly longer than that of controls (F1, 28=4.39, p=0.045, two-way ANOVA). (D) In the visible platform task, the escape latency is similar between cTKO mice and controls (p=0.39, Student’s t-test). (E) During the post-training probe trials, cTKO and control mice showed significantly higher target quadrant occupancy, compared to each of the other three quadrants at days 7 and 13 (e.g. T vs. AL: p<0.0001 for both control and cTKO groups, one-way ANOVA with Tukey’s post-hoc comparisons). The target quadrant occupancy of cTKO mice is significantly lower than that of control mice at day 13 (p=0.02, Student’s t-test). For platform crossing, control mice showed higher number of crossings relative to the corresponding platform location of the other three quadrants at days 7 and 13 (e.g. T vs. AL: p<0.0001, one-way ANOVA with Tukey’s post-hoc comparisons), whereas cTKO mice showed higher number of crossings relative to the corresponding platform location of the other three quadrants only at day 13 (e.g. T vs. AL: p=0.0001, one-way ANOVA with Tukey’s post-hoc comparisons). However, there is no significant difference on platform crossings between cTKO mice and controls (p=0.14, Student’s t-test). T: target quadrant; AL: adjacent left quadrant; AR: adjacent right quadrant; OP: opposite quadrant.
All data represent mean ± SEM (*p<0.05). The value in the column indicates the number of mice used in each experiment.
Impaired Long-term and Short-term Synaptic Plasticity
The hippocampal learning and memory deficits observed in cTKO mice prompted us to examine whether inactivation of APP family affects hippocampal synaptic transmission and plasticity. We performed electrophysiological recordings of neurotransmission at SC-CA1 synapses using acute hippocampal slices of cTKO and littermate control mice at 3 months of age. We found that the input-output curves of the evoked field excitatory postsynaptic potentials (fEPSPs) are similar between control and cTKO mice (Figure 5A). We further measured miniature excitatory postsynaptic currents (mEPSCs) by performing whole-cell recording from CA1 neurons, and found that both the frequency and the amplitude of mEPSCs are similar between cTKO and control neurons (Figure 5B). These results indicate that basal synaptic transmission is normal in the absence of APP family.
Figure 5. Impaired Hippocampal Synaptic Plasticity in cTKO mice.
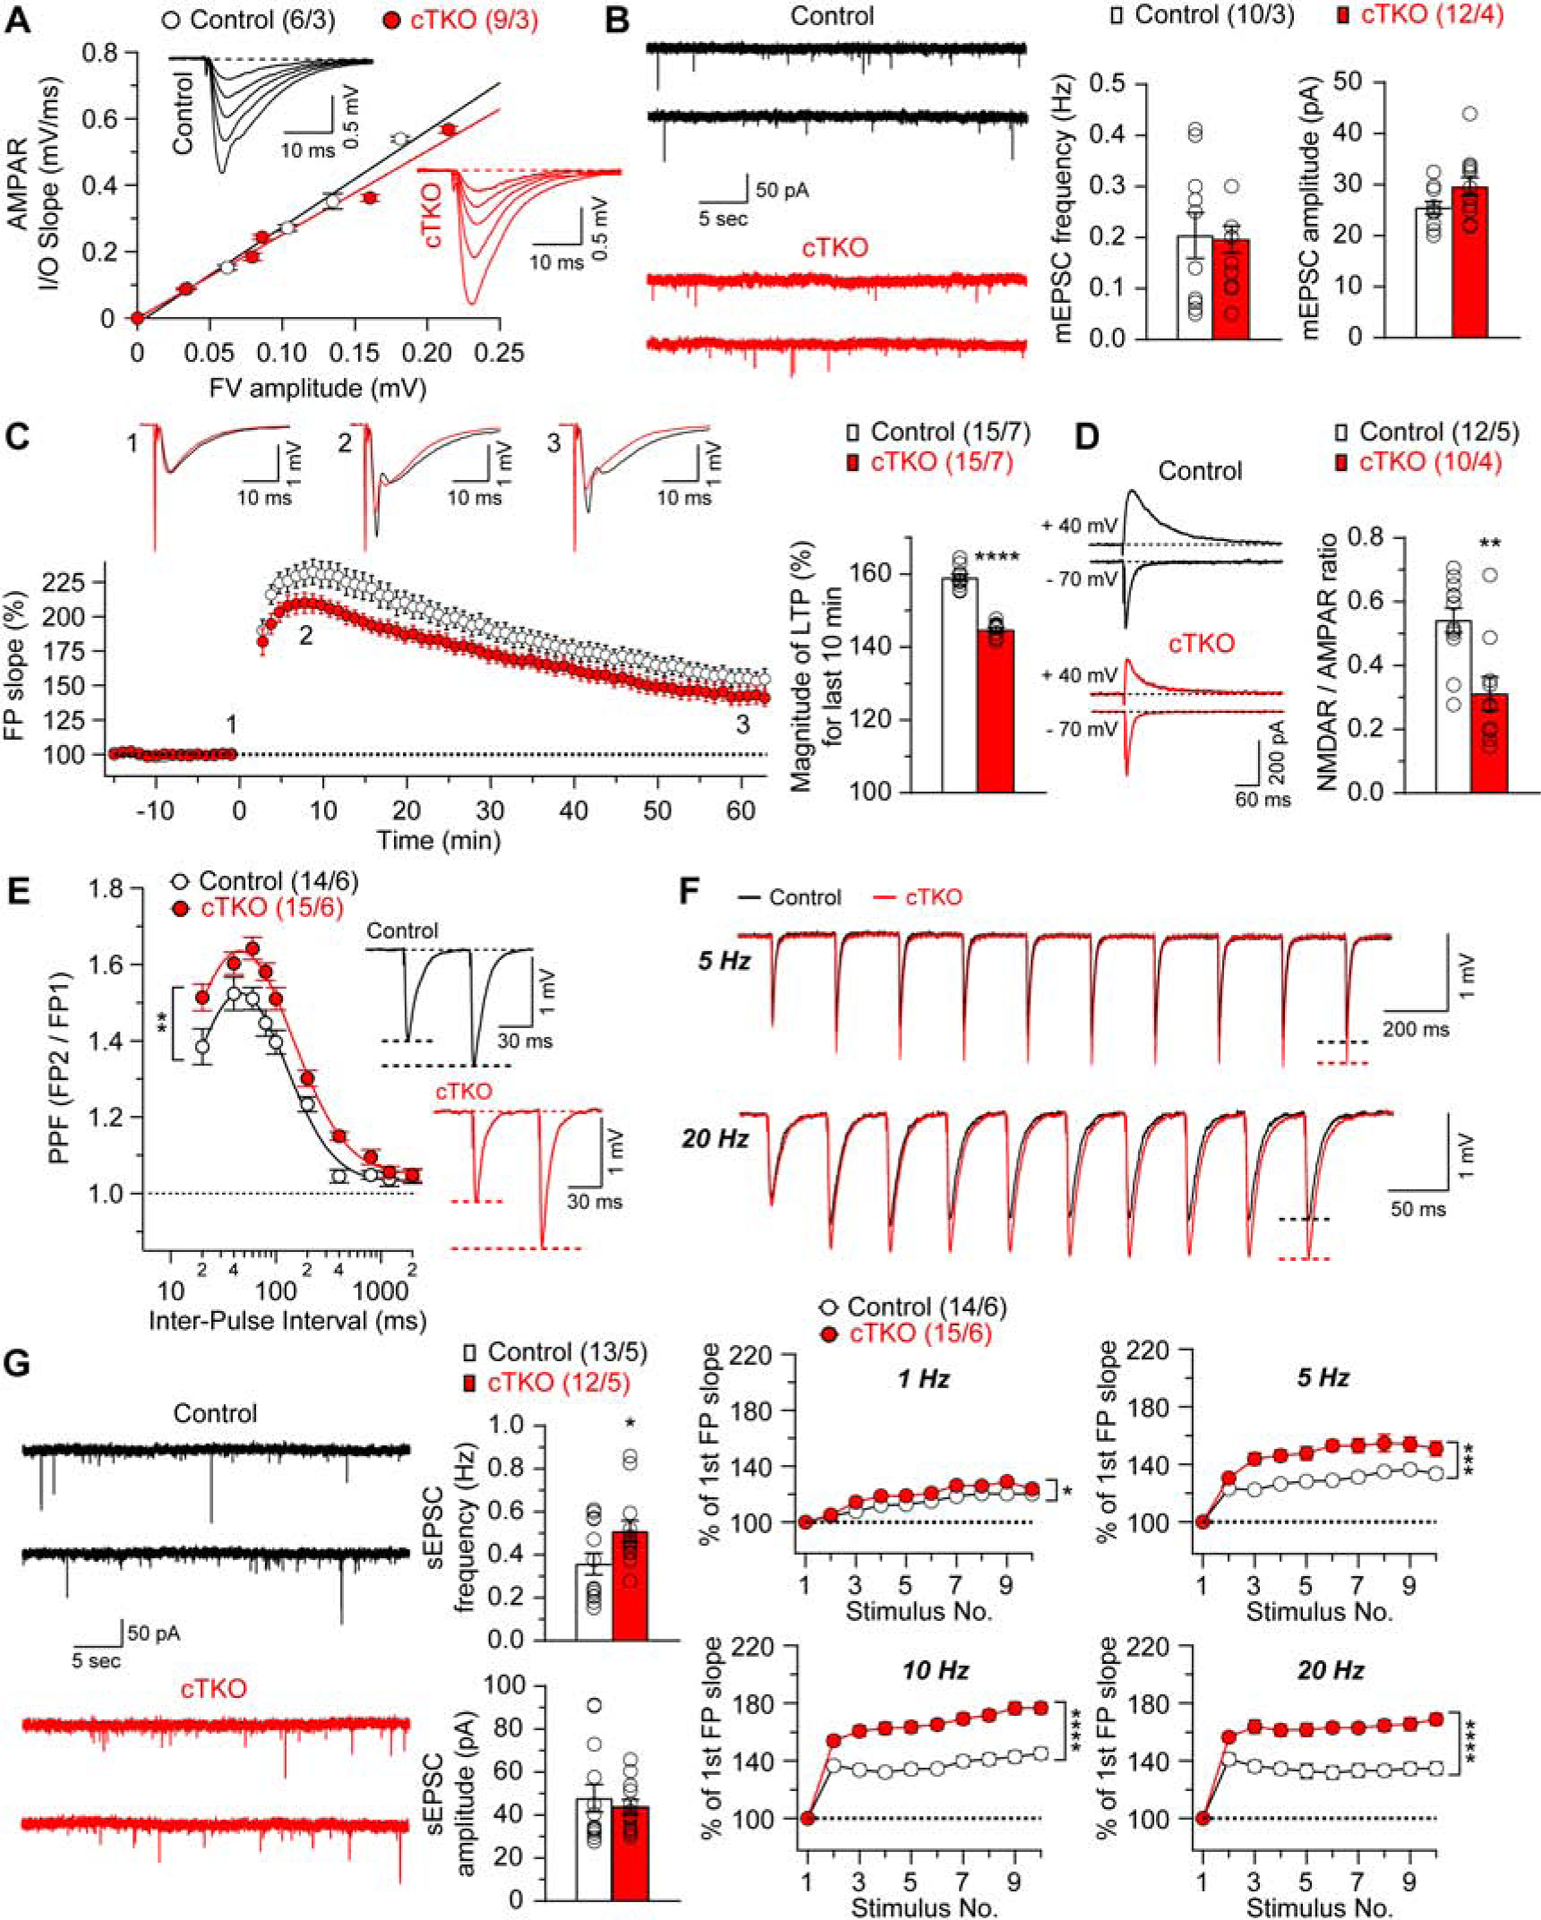
(A) Normal AMPAR-mediated input/output curves in cTKO mice. The amplitude of the fiber volley (FV) is plotted against the initial slope of the evoked fEPSPs for cTKO and control mice. The lines represent the best linear regression fit. The input/output slopes are similar between control (y=2.91x, R2=0.99) and cTKO (y=2.53x, R2=0.98) mice (p=0.14; linear regression). Insets are representative fEPSP traces evoked by stimuli of increasing intensity from control and cTKO mice. (B) Representative traces of mEPSCs in CA1 neurons from control and cTKO mice. Statistical analysis indicates normal mEPSC frequency and amplitude in cTKO neurons (frequency: p=0.88; amplitude: p=0.08; unpaired t-test). The mEPSCs were recorded under whole-cell voltage clamp conditions in the presence of TTX and picrotoxin. (C) LTP induced by 5 trains of TBS is diminished in cTKO mice. Superimposed traces are averages of four consecutive responses 1 min before (1), 7 min (2) and 60 min (3) after TBS induction. Summary graph shows the magnitude of LTP measured during the last 10 min post-induction (51–60 min) in control and cTKO hippocampal slices (Control: 158.9±0.9%, cTKO: 144.7±0.6%, p<0.0001, unpaired t-test). (D) Reduction of evoked NMDAR-mediate EPSCs in cTKO mice. The sample traces of evoked AMPAR- and NMDAR-mediated EPSCs recorded in whole-cell voltage clamp mode in the same cell at −70 mV (lower traces) and +40 mV (upper traces), respectively, are shown. The NMDAR-mediated component of the EPSC was measured 60 ms after the peak of the AMPAR EPSCs. Summary graph shows that the NMDAR/AMPAR ratio is reduced in cTKO neurons (Control: 0.54±0.04, cTKO: 0.31±0.05, p=0.0017, unpaired t-test). (E) Enhanced PPF in cTKO mice. Averaged PPF values are plotted as a function of the inter-stimulus intervals (20–2000 ms). PPF is higher in cTKO mice relative to littermate controls (F1, 27=10.37; p=0.003; two-way ANOVA). Insets are representative fEPSP traces evoked by two consecutive stimuli with a 60 ms inter-pulse interval. (F) Top: Superimposed fEPSP traces of frequency facilitation elicited by 5 and 20 Hz stimulus trains show greater enhancement in cTKO mice relative to controls. Bottom: Summary graphs show that synaptic facilitation elicited by stimulus trains is enhanced in a frequency-dependent manner, and that the enhancement is greater in cTKO relative to controls (1 Hz: F1, 27=6.47, p=0.017; 5 Hz: F1, 27=15.83, p=0.0005; 10 Hz: F1, 27=37.26, p<0.0001; 20 Hz: F1, 27=29.93, p<0.0001; two-way ANOVA). The slopes of shown fEPSP are normalized to the slope of the first fEPSP of the stimulus train. (G) Representative traces of sEPSCs recorded in CA1 neurons from control and cTKO mice. Statistical analysis indicates that cTKO neurons exhibit significantly enhanced sEPSC frequency (Control: 0.36±0.05 Hz, cTKO: 0.51±0.05 Hz; p=0.04, unpaired t-test) but unchanged amplitude (Control: 47.8±6.4 pA, cTKO: 43.7±3.4 pA; p=0.59, unpaired t-test). The sEPSCs were recorded from CA1 pyramidal neurons under whole-cell voltage clamp mode in the presence of picrotoxin.
All data represent mean ± SEM (*p<0.05, **p<0.01, ***p<0.001, ****p<0.0001). The number of neurons/mice used in each experiment is shown in parentheses.
See also Figure S3
To evaluate the effect of APP family inactivation on synaptic plasticity, we first induced LTP by delivering five trains of theta burst stimulation (TBS) through the stimulation electrode positioned in the stratum radiatum. The initial slope of fEPSPs is reduced in hippocampal slices from cTKO mice, and the magnitude of LTP, measured during the last 10 min post-induction, is smaller in cTKO mice compared to controls (Figure 5C; p<0.0001, unpaired t-test). Given the importance of NMDA receptors (NMDARs) for the induction of SC-CA1 LTP (Bliss and Collingridge, 1993), we assessed the ratio of NMDAR-mediated EPSCs to AMPAR-mediated EPSCs recorded under whole-cell voltage clamp conditions in CA1 neurons. We found that the NMDAR/AMPAR ratio for the EPSCs at SC-CA1 synapses is reduced in cTKO mice (Figure 5D; p=0.0017, unpaired t-test). Since the efficacy of AMPA receptor-mediated synaptic transmission is unaffected in cTKO mice, the observed decrease in the NMDAR/AMPAR EPSC amplitude ratio indicates that the function of NMDA receptors is impaired in the absence of APP family, possibly contributing to the observed LTP deficits in these mice.
We next examined whether short-term synaptic plasticity, which could affect the functional efficiency of neurotransmission, is also affected in cTKO mice. We evaluated two forms of short-term synaptic plasticity, PPF and frequency facilitation at the SC-CA1 synapse. PPF induced by two paired stimuli delivered at inter-pulse intervals ranging from 20 to 2000 ms is higher in cTKO hippocampal slices, indicating increased short-term synaptic plasticity (Figure 5E; F1, 27=10.37, p=0.003, two-way ANOVA). Consistent with these results, frequency facilitation, induced by short trains of presynaptic stimulation (10 pulses), which were delivered at frequencies ranging from 1 to 20 Hz, is also more prominent in cTKO mice (Figure 5F). Furthermore, the frequency of spontaneous EPSCs (sEPSCs), recorded in CA1 neurons from cTKO mice under voltage-clamp conditions in the presence of the GABAA receptor blocker, is increased (p=0.04, unpaired t-test), whereas the sEPSC amplitude remains unchanged (Figure 5G; p=0.59, unpaired t-test).
The increases in PPF, frequency facilitation, and sEPSC frequency suggest a possibility of enhanced neural activity in cTKO mice. To test whether the observed functional changes at the level of synaptic function are associated with abnormal GABAergic signaling, we measured GABAA receptor-mediated synaptic responses in CA1 neurons. We found that both the frequency and the amplitude of spontaneous inhibitory postsynaptic currents (sIPSCs) are similar between cTKO and control neurons (Figure S3A). Input/output relations for evoked GABAA receptor-mediated IPSCs (Figure S3B) and paired-pulse depressions (PPD) at inter-pulse intervals ranging from 20 to 1000 ms (Figure S3C) are also unchanged in cTKO neurons. These results indicate that GABAA receptor-mediated inhibition is normal in the absence of APP family.
Enhanced Excitability of cTKO Hippocampal Neurons
We next assessed intrinsic membrane properties of CA1 neurons in hippocampal slices from control and cTKO mice at 3 months of age by performing whole-cell recording in current-clamp mode to measure resting membrane potential (RMP), threshold current for the action potential (AP) generation, onset time of the AP and input resistance (Rin). We found that RMP is significantly more depolarized in CA1 neurons of cTKO mice (Figure 6A, 6B; p=0.0005, unpaired t-test). AP threshold current (p=0.0006, unpaired t-test) and AP onset time (p=0.0036, unpaired t-test) are markedly lower in cTKO neurons (Figure 6B, 6C). In agreement with these findings, the number of APs in response to depolarizing current injections is higher in CA1 neurons of cTKO mice (Figure 6D). The relationship of AP frequency and injected currents showed an upward shift in cTKO neurons (F1, 26=6.05, p=0.02, two-way ANOVA), indicating increased neuronal excitability (Figure 6D). The input resistance is also higher in cTKO neurons (p=0.0002, unpaired t-test), which could explain the observed increase in AP firing triggered by postsynaptic depolarization (Figure 6E). Together, these results indicate that CA1 neurons lacking APP family are hyperexcitable.
Figure 6. Enhanced Excitability of cTKO Hippocampal Neurons.
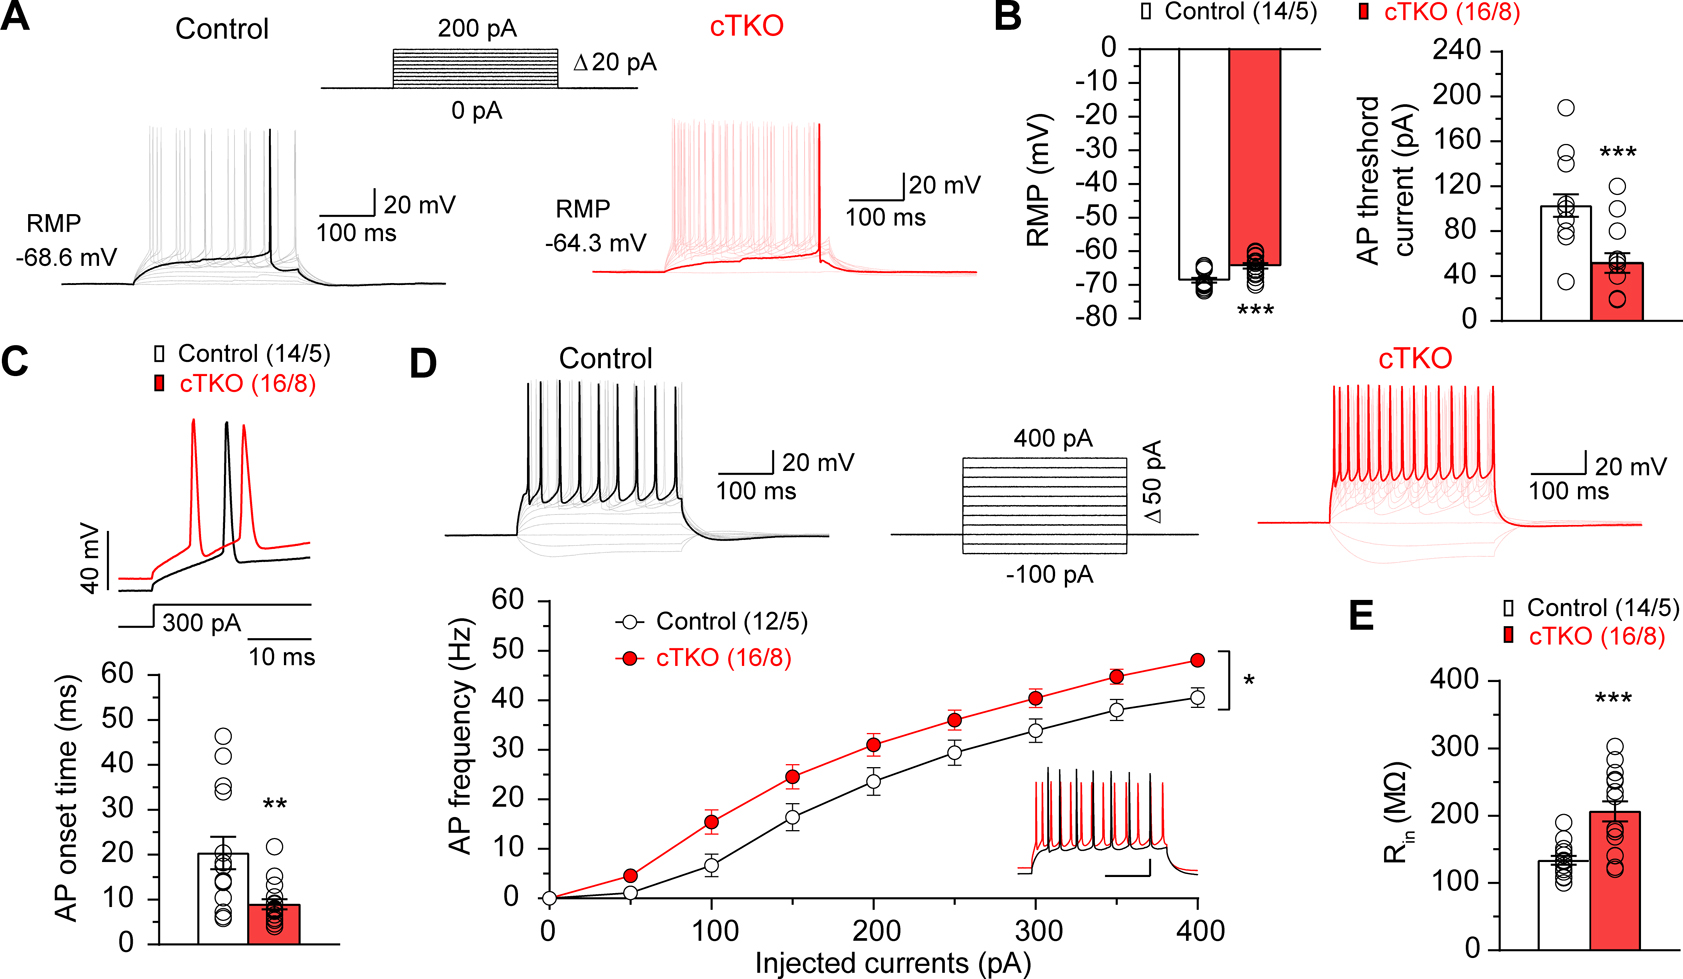
(A) Representative traces of APs evoked by depolarizing current injections (currents ranging from 0 to 200 pA with 20 pA increment and 300 ms duration). (B) Summary bar graphs show the mean values of RMP (Control: −68.6±0.7 mV, cTKO: −64.3±0.8 mV, p=0.0005, unpaired t-test) and AP threshold current (Control: 102.8±9.9 pA, cTKO: 51.6±8.9 pA, p=0.0006, unpaired t-test) in CA1 pyramidal neurons in slices from control and cTKO mice. (C) Top: Expanded traces of 1st APs triggered by 300 pA current injections in CA1 neurons from control (black traces) and cTKO (red traces) mice. Bottom: Summary bar graphs show faster 1st AP onset time in cTKO neurons (9.0±1.1 ms), relative to controls (20.4±3.6 ms; p=0.0036, unpaired t-test). (D) Top: Representative traces of APs induced by depolarizing current injections (ranging from −100 pA to 400 pA with 50 pA increment and 300 ms duration) in CA1 neurons recorded in current clamp mode. Bottom: The F-I curve, AP frequency (F) plotted against the magnitude of injected currents (I), is upward shifted in cTKO neurons relative to controls (F1, 26=6.05; p=0.02; two-way ANOVA). The inset shows superimposed traces of APs recorded in current-clamp mode in control (black) and cTKO (red) CA1 neurons triggered by 300 pA depolarizing current injections. Scale bar: 100 ms, 20 mV. (E) Summary bar graph shows increased input resistance (Rin) in cTKO neurons (206.6±14.9 MΩ) compared to controls (133.8±6.5 MΩ; p=0.0002, unpaired t-test).
All data represent mean ± SEM (*p<0.05, **p<0.01, ***p<0.001). The number of neurons/mice used in each experiment is shown in parentheses.
Reduced Kv7 Channel Function in cTKO Hippocampal Neurons
The hyperexcitability associated with membrane depolarization and enhanced input resistance in cTKO neurons led us to test whether M-currents are altered in the absence of APP family. M channels are composed of subunits of the Kv7 (KCNQ) family, and play a critical role in determining the subthreshold membrane excitability (Delmas and Brown, 2005; Madison and Nicoll, 1984; Wang et al., 1998). We found that application of XE991, a specific Kv7 channel blocker (Wang et al., 1998; Zaczek et al., 1998), to hippocampal slices from control mice enhanced AP frequency of CA1 neurons (Figure 7A, 7B; F1, 22=13.03, p=0.002, two-way ANOVA). XE991 treatment of slices from cTKO mice, however, failed to enhance the frequency of APs triggered by injected currents, indicating that the effects of Kv7 channel blockade on excitability are occluded in cTKO mice (Figure 7B; F1, 21=1.54, p=0.23, two-way ANOVA). Furthermore, AP frequency in cTKO neurons is similar to that in control neurons following XE991 treatment, suggesting that Kv7 channel inhibition mimics the effect of APP family inactivation (Figure 7B; F1, 22=0.20, p=0.66, two-way ANOVA).
Figure 7. Diminished Kv7 Channel Function in cTKO Hippocampal Neurons.

(A) Representative traces of APs in CA1 neurons from control and cTKO mice recorded in current clamp mode. APs were induced by depolarizing current injections (ranging from −100 pA to 400 pA, 300 ms-long, with 50 pA increment) before and after addition of the Kv7 channel blocker, XE991 (3 μM). (B) AP frequency is plotted as a function of the injected current magnitude. The XE991 treatment of slices from control mice results in enhanced AP frequency of CA1 neurons (F1, 22=13.03, p=0.002, two-way ANOVA), whereas XE991 treatment of slices from cTKO mice fails to enhance the frequency of APs triggered by injected currents (F1, 21=1.54, p=0.23, two-way ANOVA). (C) Bar graphs show that XE991-induced depolarization (ΔRMP) is substantially less in neurons from cTKO mice (3.26±0.52 mV), compared to neurons from control mice (7.14±0.79 mV; p=0.0006, unpaired t-test). (D) Bar graphs show that XE991-induced increases in Rin (ΔRin) are much smaller in cTKO neurons (20.91±3.93 MΩ), relative to controls (70.74±15.52 MΩ; p=0.008, unpaired t-test). (E) Bar graphs show that XE991-induced reduction in AP threshold currents is much smaller in cTKO neurons (19.67±4.86 pA), compared to controls (76.25±9.22 pA; p<0.0001, unpaired t-test). (F) Expanded traces of 1st APs in CA1 neurons triggered by 300 pA-current injections in control or cTKO neurons before and after XE991 application. (G) Bar graphs show that XE991-induced reduction in 1st AP onset time is dramatically lower in cTKO neurons (2.93±1.71 ms), relative to controls (15.11±3.22 ms; p=0.0029, unpaired t-test).
All data represent mean ± SEM (**p<0.01, ***p<0.001, ****p<0.0001; NS: not significant). The number of neurons/mice used in each experiment is shown in parentheses.
While XE991 depolarizes RMPs in CA1 neurons from control and cTKO mice (Figure S4A; p < 0.0001, paired t-test), XE991-induced depolarization (ΔRMP) is substantially less in cTKO neurons (Figure 7C; p=0.0006, unpaired t-test). Moreover, XE991 increases Rin in both control and cTKO neurons (Figure S4B), but the effect (ΔRin) in control neurons is much greater, compared to cTKO neurons (Figure 7D; p=0.008, unpaired t-test). Furthermore, AP threshold currents after XE991 treatment in CA1 neurons are markedly reduced (Figure S4C), and the reduction following XE991 application is much greater in control neurons than in cTKO neurons (Figure 7E; p<0.0001; paired t-test). Consistent with these results, XE991 dramatically shortens AP onset time in control neurons (p=0.0007, paired t-test) but not in cTKO neurons (p=0.13, paired t-test; Figures 7F, S4D), and the reduction in XE991-induced AP onset time is substantially smaller in cTKO neurons (Figure 7G; p=0.0029, unpaired t-test). These results further showed that inactivation of APP family mimics the effects of blockade of Kv7 channels, suggesting that Kv channel function is impaired in cTKO neurons.
To determine whether the function of sodium channels may be affected in cTKO mice and whether the XE991 treatment could affect sodium current-mediated components of the action potential, we examined the AP rise time, AP rise slope and AP half-width from the single AP before and after XE991 treatment in control and cTKO mice (Figure S5A). We found no difference between genotypic groups or before and after XE991 treatment in any of the measured parameters (Figure S5B). Thus, the enhanced excitability of CA1 neurons in cTKO mice is likely to be regulated through diminished Kv7 channel function.
Discussion
APP has been the focus of intense research interest (>45,000 publications in the PubMed) since its partial sequence identification (Glenner and Wong, 1984) and its subsequent linkage to FAD (Goate et al., 1991; Rovelet-Lecrux et al., 2006; Sleegers et al., 2006). However, its normal physiological role in mature neurons of the adult brain remained unclear because of the existence of APP functional homologues and the perinatal lethality of germline KO mice, which precluded the study of APP family function postnatally (Herms et al., 2004; Müller et al., 2017; Zheng and Koo, 2006). In this study, we address this question through the creation of conditional triple KO mice, in which APP, APLP1 and APLP2 are selectively inactivated in excitatory pyramidal neurons of the cerebral cortex (Figures 1 and S1). Surprisingly, inactivation of APP family in excitatory cortical neurons, which are most vulnerable in AD, does not result in neurodegeneration, as evidenced by the lack of reduction in cortical volume or cortical neuron number and the lack of increases in apoptosis or astrogliosis in the cerebral cortex of cTKO mice up to ~2 years of age (Figures 2, 3, S2). Consistent with abundant expression of APP, APLP1 and APLP2 in excitatory neurons of the cerebral cortex, APP family plays an important role in the regulation of neuronal function. Specifically, cTKO mice at 3 months of age exhibit hippocampal learning and memory deficits (Figure 4) and decreases in LTP and NMDAR-mediated responses at hippocampal SC-CA1 synapses (Figure 5). Consistent with enhanced PPF and synaptic facilitation as well as frequency of sEPSCs (Figure 5), cTKO neurons exhibit depolarization of the resting membrane potential, decreased action potential threshold and onset time, and increased action potential firing in response to depolarizing current injections (Figure 6). Furthermore, the enhanced excitability observed in CA1 neurons of cTKO mice is phenocopied by inhibition of Kv7 channels (Figure 7). Thus, APP family is not required for neuronal survival in the aging brain but plays a critical role in the regulation of neuronal excitability and synaptic plasticity in the adult brain.
APP Family in the Regulation of Neuronal Excitability and Synaptic Plasticity
APP and APLP2 are ubiquitously expressed, whereas APLP1 expression is more restricted to the nervous system (Lorent et al., 1995; Müller et al., 2017; Zheng and Koo, 2011). Our Northern and Western analyses showed that selective deletion of APP and APLP2 in excitatory neurons of the postnatal forebrain results in ~80% reduction of APP and APLP2 mRNAs and proteins in the cerebral cortex at 3 months of age (Figure 1), demonstrating that APP and APLP2 are normally expressed predominantly in excitatory neurons of the adult cerebral cortex with the remaining 20% distributed among other cell types including interneurons and glia. Furthermore, selective deletion of APLP1 in excitatory neurons leads to a smaller reduction (~60%) in the APLP1 mRNA and protein in the cerebral cortex (Figure 1), suggesting that relative to APP and APLP2 more APLP1 are expressed in inhibitory neurons and/or glia.
Consistent with their abundant expression, our study showed that APP family plays a critical role in excitatory neurons of the cerebral cortex (Figures 4–7). Learning and memory are impaired in cTKO mice at the age of 3 months, as evidenced by increased escape latencies and decreased target quadrant occupancy in the Morris water maze task (Figure 4). LTP induced by TBS as well as NMDAR-mediated responses are also reduced at hippocampal SC-CA1 synapses of cTKO mice at this age (Figure 5). These findings demonstrate a critical role played by the APP family in the regulation of hippocampal memory and long-term synaptic plasticity. Previous reports indicated that only aged APP KO mice exhibited spatial learning and memory impairment and reduced LTP in the Schaffer collateral pathway (Dawson et al., 1999; Ring et al., 2007; Tyan et al., 2012). Compared to our cTKO mice, NEX-Cre driven APP conditional KO mice in the APLP2-null background displayed more severe LTP and memory impairments, indicating that the more severe phenotypes observed in these mice are likely due to developmental effects caused by the earlier ablation of APP and APLP2 beginning at embryonic day 12 (Goebbels et al., 2006; Hick et al., 2015). Indeed, a number of morphological changes, such as reduction in dendritic branching, spine density and spine head size, were reported, suggesting that these morphological changes likely contribute to the severe LTP and memory impairment observed in NEX-Cre driven APP/APLP2 conditional mutant mice (Hick et al., 2015).
We also discovered that selective inactivation of APP family in excitatory neurons leads to alterations in short-term synaptic plasticity and neuronal excitability. PPF, synaptic facilitation, and frequency of spontaneous EPSCs are all enhanced in cTKO mice (Figure 5). Previous analysis of APP KO and APLP2 KO mice from 2 to 24 months of age showed normal PPF at SC-CA1 synapses (Seabrook et al., 1999; Tyan et al., 2012), whereas a more recent study reported increased PPF and synaptic facilitation in APP/APLP2 double KO mice at 2–3 weeks of age (Fanutza et al., 2015), suggesting genetic redundancy of APP and APLP2 in the regulation of presynaptic short-term plasticity. However, these earlier studies all used germline KO mice, and APP KO mice were reported to exhibit developmental phenotypes such as altered spine density (Lee et al., 2010; Tyan et al., 2012). By creating a cell type-specific cTKO mouse circumventing developmental requirement of APP family in neural development, our study unequivocally showed a cell-autonomous role of APP family in the regulation of synaptic plasticity and neuronal excitability in mature excitatory neurons of the cerebral cortex. Indeed, whole-cell recordings revealed depolarized RMP and enhanced AP firing in hippocampal CA1 neurons from cTKO mice, supporting enhanced local network excitability in the absence of APP family, whereas GABAAR-mediated inhibitory responses are unaffected (Figures 6, S3). Further analysis also showed that there is no gender difference in excitability of CA1 neurons from male and female mice within the control or cTKO group (Figure S6).
APP Family and Kv7 Channels
The M current mediated by KCNQ2/KCNQ3 potassium channels plays a critical role in regulating neuronal membrane excitability (Brown and Adams, 1980; Delmas and Brown, 2005; Madison and Nicoll, 1984; Wang et al., 1998). Previous reports showed that blockade of Kv7 channel activity, either by a specific inhibitor such as XE991 or by expression of a dominant-negative Kv7.2 mutant, results in depolarized membrane potentials and enhanced spike frequency in hippocampal CA1 neurons (Peters et al., 2005; Shah et al., 2008), whereas activation of Kv7 channels leads to membrane hyperpolarization and suppression of AP generation (Main et al., 2000; Tatulian et al., 2001; Wickenden et al., 2000). We also found that inhibition of Kv7 channels in hippocampal slices from control mice depolarized RMP and increased spike frequency (Figures 7, S4). Moreover, loss of APP family mimics the effects of Kv7 channel inhibition, including depolarized membrane potential and increased AP frequency, whereas inhibition of Kv7 channels in CA1 neurons from cTKO mice largely occludes the effects of APP family inactivation on intrinsic membrane properties and AP spike firing (Figures 7, S4). These results suggest that reduced Kv7 channel function may underlie hyperexcitability in cTKO mice.
Dominantly inherited loss-of-function mutations in the KCNQ2 and KCNQ3 genes encoding Kv7.2 and Kv7.3, respectively, are associated with infantile and juvenile epilepsy (Biervert et al., 1998; Charlier et al., 1998; Jentsch, 2000; Singh et al., 1998). Heterozygous KCNQ2-null mice also showed hypersensitivity to induction of seizure (Watanabe et al., 2000). Interestingly, APP-null mice displayed hypersensitivity to induced seizures (Steinbach et al., 1998), and APP transgenic mice overexpressing mutant human APP also exhibited spontaneous seizure activity (Palop et al., 2007; Verret et al., 2012), suggesting that neural network activity may be sensitive to alteration of APP dosage. How APP family interacts with Kv7 channels to regulate neuronal excitability is worthy of further investigation. It has been reported that Kv7.2 and Kv7.3 as well as APP are enriched at the axonal terminal in the hippocampal area CA1, and the ankyrin-G binding motif of Kv7.2 and Kv7.3 is required for their localization near the axonal spike initiation site where they influence the AP threshold and spike frequency (Otto et al., 2006; Pan et al., 2006; Peters et al., 2005; Rasmussen et al., 2007; Saura et al., 2005; Shah et al., 2008). It will be interesting to determine whether APP family is required for the axonal localization of these Kv7 subunits, and whether APP family members interact directly with Kv7 subunits.
APP Family Not Required for Neuronal Survival
Genetically, APP and PSEN are the only two gene families that have been linked to FAD with the first FAD mutation (APP V717I) discovered nearly 30 years ago (Goate et al., 1991), followed by the identification of mutations in PSEN1 and PSEN2 in 1995 (Levy-Lahad et al., 1995; Rogaev et al., 1995; Sherrington et al., 1995). In addition to their genetic linkage to FAD, APP and Presenilin are biochemically linked with Presenilin being the catalytic subunit of γ-secretase and APP a physiological substrate. The divergence of their role in cortical neuronal survival, however, suggests distinct pathogenic mechanisms underlying APP and PSEN mutations, which is consistent with the broad distribution of PSEN mutations and the clustering of APP mutations surrounding the secretase cleavage sites (alzforum.org/mutations). Using the same Camk2a-Cre transgene, inactivation of the Presenilin genes results in a 8-fold increase of apoptosis in the cerebral cortex beginning at 2 months of age, followed by age-dependent loss (e.g. 9% at 4 months, 50% at 18 months) of cortical neurons (Saura et al., 2004; Wines-Samuelson et al., 2010). Furthermore, partial inactivation of Presenilin also leads to age-dependent neurodegeneration in the mouse and Drosophila brain (Kang et al., 2017; Watanabe et al., 2014).
It was reported previously that APP-null mice develop astrogliosis in the cerebral cortex in the absence of neuronal loss (Phinney et al., 1999; Seabrook et al., 1999; Zheng et al., 1995). Our analysis did not show increases of astrogliosis in aged APP/APLP1/APLP2 cTKO mice, relative to littermate controls, even though there are age-dependent increases of astrogliosis in the cerebral cortex of both genotypic groups (Figure 3). The difference between APP-null and APP/APLP1/APLP2 cTKO mice in astrogliosis raised the question as to whether APP is expressed in astrocytes and whether astrogliosis seen in APP-null mice is due to loss of APP in astrocytes.
Implications for AD Pathogenesis
The dispensable role of APP family in neuronal survival during aging argues against a loss-of-function mechanism underlying APP mutations. The location of APP mutations, all clustering around the α-, β- or γ-secretase cleavage sites, suggests that altered proteolysis of APP may lead to neurodegeneration in AD pathogenesis. Our study, however, does not rule out the possibility that APP family may be protective of cortical neurons under pathological conditions. For example, it was reported that LTP and memory impairment caused by Aβ and tau oligomers is APP-dependent (Puzzo et al., 2017). The fact that neuronal hyperexcitability observed in cTKO mice at 3 months of age does not result in loss of neurons or increases of apoptosis at 22 months of age argues against the notion that neuronal hyperexcitability per se leads to eventual neuronal loss at old ages.
Our findings that APP family is required for the maintenance of Kv7 channel function is intriguing, raising the question as to whether and how APP mutations may affect Kv7 channels. Interestingly, Kv7 channels are inhibited by stimulation of muscarinic acetylcholine receptors (Madison and Nicoll, 1984; Selyanko et al., 2000; Shapiro et al., 2000), whereas the first FDA approved AD drug, donepezil, is a reversible inhibitor of acetylcholinesterase, leading to increased acetylcholine and activation of muscarinic acetylcholine receptors at the synapse. The molecular pathway by which APP family regulates Kv7 channel activity and neuronal excitability remains to be elucidated, and may be further explored as novel therapeutic targets of AD.
In summary, our current study demonstrates unequivocally that APP family is not required for cortical neuronal survival in the aging brain under physiological conditions. The dispensable role of the APP family in neuronal survival is in direct contrast with an essential role of the Presenilin family in neuronal survival during aging, suggesting distinct pathogenic mechanisms underlying APP and Presenilin FAD mutations. Despite the lack of requirement for neuronal survival, APP family plays an important role in the regulation of neuronal excitability as well as synaptic plasticity, consistent with their abundant expression in the postnatal excitatory neurons. Future studies will be necessary to elucidate the molecular mechanism by which APP family controls neuronal excitability and synaptic plasticity.
STAR Methods
RESOURCE AVAILABILITY
Lead Contact
Further information and requests for resources and reagents should be directed to and will be fulfilled by the Lead Contact, Jie Shen (jshen@bwh.harvard.edu).
Materials Availability
The new mutant mouse lines, floxed APP, APLP1, APLP2 mice, generated in this study are available upon request.
Data and Code Availability
This study did not generate/analyze datasets/code.
Original data for the figures in the paper are available in Mendeley Data [http://dx.doi.org/10.17632/vs48zct2xp.1]
EXPERIMENTAL MODEL AND SUBJECT DETAILS
Mice
All animal use was approved by the IACUC committee of Harvard Medical School and Brigham and Women’s Hospital in accordance with the USDA Animal Welfare Act and PHS Policy on Humane Care and Use of Laboratory Animals. Mice were maintained on a 12 hr light/dark cycle, and were provided with standard rodent chow and water. Mice of either sex were used and mice were randomly allocated to experimental groups. Mice at multiple ages from 2 months to 22 months were used. Floxed APP (fAPP/fAPP), APLP1 (fAPLP1/fAPLP1) and APLP2 (fAPLP2/fAPLP2) mice were generated in this study, and Camk2a-Cre transgenic mice were previously described in Yu et al., 2001. The APP/APLP1/APLP2 cTKO and littermate control mice were maintained on the C57BL/6J and 129 hybrid genetic background, and were obtained from breeding fAPP/fAPP; fAPLP1/fAPLP1; fAPLP2/fAPLP2; Camk2a-Cre or fAPP/+; fAPLP1/fAPLP1; fAPLP2/fAPLP2; Camk2a-Cre with fAPP/fAPP; fAPLP1/fAPLP1; fAPLP2/fAPLP2 mice.
METHOD DETAILS
Generation of APP/APLP1/APLP2 cTKO Mice
The diagrams describing the generation of the targeting vectors and the sequences of the floxed alleles are included (Data S1). To generate the APP targeting vector, we first used C57BL/6 genomic DNA and PCR primers (AH0801 and AH0802) to amplify the left homologous region (5.6 kb) containing the promoter region and exon 1. All PCR primer sequences can be found in Table S1. The PCR product digested by SacII (introduced by AH0801 along with SalI) and NotI (endogenous in APP intron 1) was subcloned into the SacII and NotI sites of pBSK(−). The loxP (34 bp) and EcoRI sequences were then introduced into the endogenous MluI site upstream of APP exon 1 by two complementary oligos (AH0803 and AH0804). The right homologous region (4.9 kb) containing APP intron 1 was generated by PCR using C57BL/6 genomic DNA and primers (AH0805 and AH0806), and the NotI/KpnI (both sites endogenous in APP intron 1) digested PCR product was subcloned into the NotI (in intron 1) and KpnI (pBSK) sites of the modified pBSK containing the left arm and the loxP-EcoRI sequences. The FRT-loxP-PGK-NEO-FRT-loxP fragment was released by NotI digestion from the PGKneolox2DTA plasmid (gift of P. Soriano), and cloned into the NotI site (in intron 1) of the modified pBSK containing the left arm, the loxP-EcoRI sites, and the right arm. Thus, upon Cre-mediated recombination, the endogenous APP genomic sequences from MluI (upstream of APP exon 1) to NotI (intron 1) will be deleted. To enhance the ratio of ES cells carrying homologous recombination events instead of random insertion of the targeting vector (Yu et al., 2000), the negative selection PGK-DT cassette, which encodes diphtheria toxin, was introduced into the KpnI site following the right homologous sequences to complete the generation of the APP targeting vector.
The APP targeting vector was linearized by SalI digestion, and then electroporated into MKV6.5 embryonic stem (ES) cells (gift of R. Jaenisch), which were derived from B6/129 F1 mice. G418 was applied to the culture at 150 μg/ml 24 h later, and after 6 days of G418 selection the surviving ES clones should carry the PGK-NEO positive selection cassette either by homologous recombination or by random integration. 384 ES cell clones were picked and screened by Southern analysis using EcoRV digestion of genomic DNA followed by hybridization with the 3’ external probe. Nine of the ES cell clones were tested positive for proper homologous recombination at the 3’ arm region, giving rise to the 12.3 kb and the 6.9 kb bands, which represent the wild-type and the targeted alleles, respectively. We then expanded these 9 ES clones and verified further whether proper recombination occurred in the 5’ arm upstream of the loxP site by PCR and sequencing to confirm the presence of the loxP-EcoRI sequences. Six of the 9 ES clones were confirmed to carry the correct homologous recombination event in the 5’ arm.
To generate the APLP1 targeting vector, we used C57BL/6 genomic DNA and PCR primers (AH0821 and AH0822) to amplify the left homologous region (6.2 kb) containing the promoter region and exons 1 and 2. The PCR product following digestions with EcoRV (endogenous, upstream of APLP1 exon 1) and SpeI (from AH0822) was subcloned into the EcoRV and SpeI sites of pBSK(−). Subsequently, the loxP and SpeI sequences were introduced into the endogenous NsiI site upstream of APLP1 exon 1 by complementary oligos (AH0823 and AH0824). The right homologous region containing APLP1 intron 2 was generated from two cloning steps using two PCR generated fragments. The shorter PCR product (1.1 kb), amplified using AH0825 and AH0826 (introducing BstBI and SacII), was digested with SacII, and the SacII (endogenous, intron 2) - SacII (from AH0826) fragment was then subcloned into the SacII site (from pBSK) of the modified pBSK containing the left arm and the loxP-SpeI sites. The longer PCR product (3.5 kb), amplified using AH0827 and AH0828 (introducing BsiWI and BstBI), was digested with MluI and BstBI and then subcloned into the MluI (endogenous, APLP1 intron 2) and BstBI sites of the modified pBSK to extend the right arm (4.6 kb). The FRT-loxP-PGK-NEO-FRT-loxP fragment was released by NotI digestion from the PGKneolox2DTA plasmid, and cloned into the NotI site (from pBSK) of the modified pBSK containing the left arm, the loxP-SpeI sites, and the right arm. The negative selection PGK-DT cassette was introduced into the BsiWI site following the right homologous region of the modified pBSK to complete the generation of the APLP1 targeting vector.
The APLP1 targeting vector was linearized with SalI restriction digestion. After electroporation of the targeting vector into the ES cells and 6 days of G418 selection, we picked 384 ES cell clones, and then screened for those carrying the proper recombination events using Southern analysis. Genomic DNA was digested with SpeI and hybridized with the 5’ external probe. The resulting 14.7 kb and 5.6 kb bands represent the wild-type and the targeted alleles, respectively. Among the 14 ES clones that tested positive for the proper homologous recombination in the 5’ arm, only 7 were confirmed to carry the correct homologous recombination event in the 3’ arm region by Southern, followed by sequencing confirmation of the presence of the loxP-SpeI site. The lower confirmation rate (7/14) is likely due to homologous recombination occurring in the middle region between the loxP-SpeI site and the floxed PGK-NEO cassette (Yu et al., 2000).
To generate the APLP2 targeting vector, we used C57BL/6 genomic DNA and PCR primers (AH0811 and AH0812) to amplify the left homologous region (5.0 kb) containing the promoter region and exon 1. AH0811 introduced the BamHI and MluI sites to the PCR product, whereas AH0812 introduced the BstBI and SacI sites. The BamHI and SacI digested PCR product was subcloned into the BamHI and SacI sites of pBSK(−). The loxP and SphI sequences (40 bp) were introduced into the endogenous NcoI site upstream of APLP2 exon 1 by two complementary oligos (AH0813 and AH0814). The right homologous region (5.1 kb) containing APLP2 intron 1 was generated by PCR using C57BL/6 genomic DNA and PCR primers AH0815 and AH0816, which introduced BsiWI and SacI sites. The SacI (endogenous, in intron 1) - SacI (from AH0816) fragment was subcloned into the SacI site of the modified pBSK containing the left arm and the loxP-SphI sites. The FRT-loxP-PGK-NEO-FRT-loxP fragment was released by ClaI digestion from the PGKneolox2DTA plasmid, and cloned into the BstBI site of the modified pBSK containing the left arm, the loxP-SphI sites, and the right arm. The negative selection PGK-DT cassette was introduced into the BsiWI site on the right homologous region of the modified pBSK to complete the generation of the APLP2 targeting vector.
The APLP2 targeting vector was linearized by MluI digestion upstream of the 5’ homologous region. After electroporation of the APLP2 targeting vector into the ES cells followed by 6 days of G418 selection, we screened 384 ES cell clones for those carrying the proper recombination events using Southern analysis. Genomic DNA was digested with SphI and hybridized with the 5’ external probe, and the resulting 13.8kb and 5.1kb bands represent the wild-type and the targeted alleles. Among 25 ES cell clones that tested positive for proper homologous recombination in the 5’ arm region, only 8 were confirmed to carry the proper homologous recombination event at the 3’ arm. This low confirmation rate (8/25) is likely due to homologous recombination occurring in the middle homologous region containing exon 1 between the loxP-SphI site and the floxed PGK-NEO cassette.
The positive ES clones were expanded and further confirmed by PCR/sequencing and Southern blotting with the external probes and the NEO probe to ensure proper recombination events in 5’ and 3’ homologous regions. Two ES clones for each targeting vector were microinjected into C57BL/6 mouse blastocysts to generate chimera mice, which were bred with B6/129 F1 mice to produce heterozygous APP, APLP1, and APLP2 mice carrying the targeted allele. The germline transmission of the targeted fAPP, fAPLP1 or fAPLP2 allele was confirmed by Southern analysis using the 5’ and 3’ external probes. To remove the PGK-NEO selection cassette, we crossed heterozygous targeted APP, APLP1 and APLP2 mice with FLP deleter mice, ACTB::FLPe (Rodriguez et al., 2000) to generate heterozygous floxed APP (fAPP/+), APLP1 (fAPLP1/+) and APLP2 (fAPLP2/+) mice, respectively. Heterozygous fAPP/+, fAPLP1/+ and fAPLP2/+ mice were crossed with each other to obtain homozygous single floxed mice (fAPP/fAPP, fAPLP1/fAPLP1 and fAPLP2/fAPLP2) and triple floxed mice (fAPP/fAPP; fAPLP1/fAPLP1; fAPLP2/fAPLP2).
To generate postnatal forebrain-restricted, excitatory neuron-specific single APP, APLP1, APLP2 cKO, and APP/APLP1/APLP2 cTKO mice, we used Camk2a-Cre transgenic mice, which we previously used successfully to restrict inactivation of Presenilin-1, Nicastrin, CBP, Notch1 and Notch2 in excitatory neurons of the postnatal forebrain beginning at ~day 18 (Chen et al., 2010; Saura et al., 2004; Tabuchi et al., 2009; Yu et al., 2001; Zhang et al., 2009; Zheng et al., 2012). We crossed single or triple floxed mice to Camk2a-Cre (hereafter, Cre) mice to generate single APP cKO (fAPP/fAPP; Cre), APLP1 cKO (fAPLP1/fAPLP1; Cre) and APLP2 cKO (fAPLP2/fALP2P; Cre) mice as well as cTKO mice (fAPP/fAPP; fAPLP1/fAPLP1; fAPLP2/fAPLP2; Cre). APP/APLP1/APLP2 cTKO and littermate control mice used in phenotypic analysis were obtained by crossing fAPP/fAPP; fAPLP1/fAPLP1; fAPLP2/fAPLP2; Camk2a-Cre or fAPP/+; fAPLP1/fAPLP1; fAPLP2/fAPLP2; Camk2a-Cre with triple floxed mice (fAPP/fAPP; fAPLP1/fAPLP1; fAPLP2/fAPLP2). We used female mice carrying the Camk2a-Cre transgene for breeding to minimize the number of offspring bearing germline deletions, which may confound interpretation of observed phenotypes. Unfortunately, the fAPP, fAPLP1 and fAPLP2 alleles are particularly sensitive to Cre-mediated germline deletions. For example, from cTKO crossing with triple floxed mice, we obtained much fewer cTKO mice bearing all 6 floxed alleles (9.5% instead of the anticipated 50%). Heterozygous fAPP/+; fAPLP1/fAPLP1; fAPLP2/fAPLP2; Cre mice bred with triple floxed mice resulted in 7.5% cTKO mice bearing all 6 floxed alleles instead of the anticipated 25%. We only used cTKO and control mice that carry all floxed alleles for all phenotypic analysis.
Southern Analysis
ES cells:
For the identification of the APP target allele, genomic DNA from ES cells was digested with EcoRV followed by hybridization with the 3’ external probe. A genomic DNA fragment of 4.7 kb in APP intron 1, downstream of the 3’ homologous region, was generated by PCR using C57BL/6 genomic DNA and PCR primers AH0809 and AH0810, and was subcloned into the KpnI and NotI sites of pBSK(−). The 3’ external probe (859 bp), located ~550 bp downstream of the 3’ homologous region, was generated by restriction digestion of the plasmid using SacI and ClaI (both are endogenous sites in APP intron 1). For the identification of the APLP1 targeted allele, genomic DNA was digested with SpeI followed by hybridization with the 5’ external probe. We first PCR amplified a genomic DNA fragment of 2.5 kb, upstream of the 5’ homologous region of APLP1, using primers AH0829 and AH0830, and then subcloned it into the SpeI and EcoRV sites of pBSK(−). The 5’ external probe (409 bp), located ~250 bp upstream of the 5’ homologous region, was generated by restriction digestion of the plasmid using PstI and BamHI (both are endogenous sites upstream of the 5’ homologous region). For the identification of the APLP2 targeted allele, genomic DNA was digested with SphI followed by hybridization with the 5’ external probe. We first PCR amplified a genomic DNA fragment of 1.8 kb, upstream of the 5’ homologous region of APLP2, using primers AH0817 and AH0818, and then subcloned it into the KpnI and XbaI sites of pBSK(−). The 5’ external probe (452 bp), located ~900 bp upstream of the 5’ homologous region, was generated by restriction digestion of the plasmid using BglI (an endogenous site upstream of the 5’ homologous region).
Mice:
For floxed APP mice, genomic DNA was digested with EcoRI (5’ probe) or EcoRV (3’ probe). The 5’ external probe (493bp, ~60bp upstream of the 5’ homologous region) was PCR amplified using primers 5’-TAGTAGACATTAGCTCTGATAAC and 5’-TCACAAGCTAAGTCCCATAAATGG, whereas the external 3’ probe was the same as the one used for ES cells. Southern analysis of tail genomic DNA confirmed the presence of the wild-type allele (8.9 kb for the 5’ external probe, 12.3 kb for the 3’ external probe) and/or the floxed APP allele (5.5 kb for the 5’ external probe, 6.9 kb for the 3’ external probe).
For floxed APLP1 mice, genomic DNA was digested with SpeI. The 5’ external probe was the same as the one used for ES cells, whereas the 3’ probe (499bp, ~1.3kb downstream of the 3’ homologous region) was amplified using the primers, 5’-TCCAAGCCTTGAACCCCTCGTC and 5’-ACCAATCCAGACCAGACAGAGG. Southern analysis of tail genomic DNA confirmed the presence of the wild-type allele (14.7 kb for both the 5’ and 3’ external probes) and/or the floxed APLP1 allele (5.6 kb for the 5’ external probe, 6.2 kb for the 3’ external probe).
For floxed APLP2 mice, genomic DNA was digested with SphI. The 5’ external probe (428bp, ~1.2kb upstream of the 5’ homologous region) was amplified using the primers, 5’-TGTTCTGGCCGTGTTATCTCTG and 5’-TGACAGGATCACAGCCAATGAG, whereas the 3’ probe (397bp, ~20bp downstream of the 3’ homologous region) was amplified using the primers, 5’-CACAACCGTAACCTATTGTTTG and 5’-AATGCAATCCTTGATCACATGC. Southern analysis of cortical genomic DNA confirmed the presence of the wild-type allele (13.8 kb for both the 5’ and 3’ external probes) and/or the floxed APLP2 allele (5.1 kb for the 5’ external probe, 8.7 kb for the 3’ external probe).
PCR Genotyping
Genomic PCR was performed to determine the presence of the deleted, the floxed, and/or the wild-type alleles. For APP, the following primers were used: 5’-GGCCTTCTAGGTTGCTTTCTATTGC (RB1101, forward primer at ~1500nt upstream of exon 1), 5’-AAGCAGTTTCTGCCACTGCCCAGTT (RB1102, reverse primer at ~1300nt upstream of exon 1), and 5’-AAGAGTCCTGGACGTCCAGGTTGA (RB1105, reverse primer at ~800nt downstream of exon 1). The PCR products from RB1101 and RB1102 are 180 bp and 222 bp, which represent the wild-type and the floxed APP alleles, respectively, whereas the PCR products from RB1101 and RB1105 is 377 bp, which represents the deleted APP allele.
For APLP1, the following primers were used: 5’-GCCACATGAGTCATGGACCTTGAAT (RB1110, forward primer at ~1500nt upstream of exon 1), 5’-AGGACTTAGGACATCATCGCTACTG (RB1111, reverse primer at ~1300nt upstream of exon 1), and 5’-TCTCATTGGGCTCCATCACTTACTG (RB1112, reverse primer at ~400nt downstream of exon 2). The PCR products from RB1110 and RB1111 are 167 bp and 203 bp, which represent the wild-type and the floxed APLP1 alleles, respectively, whereas the PCR product from RB1110 and RB1112 is 461 bp, which represents the deleted APLP1 allele.
For APLP2, the following primers were used: 5’-ATTCTAGGGCCTCTGGATTGA (AH08166, forward primer at ~1500nt upstream of exon 1), 5’-TAGTGGGCAGAGTGGGACAGTAAG (AH08164, reverse primer at ~1100nt upstream of exon 1), and 5’-GGAGACGCAGATCGGGAGCT (AH09209, reverse primer at ~40nt downstream of exon 1). The PCR products from AH08166 and AH08164 are 385 bp and 425 bp, which represent the wild-type and the floxed APLP2 alleles, respectively, whereas the PCR from AH08166 and AH09209 is 188 bp, which represents the deleted APLP2 allele.
Northern Analysis
Total RNA was isolated from brains using TRI reagent (Millipore-Sigma) according to manufacturer’s instruction. ~5 μg of total RNA were separated in formaldehyde agarose gels, and transferred into nylon membrane (Amersham). Probes were synthesized using Prime-It II random labeling kit (Stratagene) and then used for membrane hybridization at 50 °C overnight. The PCR primer sequences used to amplify cDNA probes are as followed: 5’-TTTCCTCGGCGGCGGGAG and 5’-TAGGCAACGGTAAGGAATCACG for the probe specific for APP exons 1–3 (498 bp), 5’-GGCTCAAGTGGCTGGACTAT and 5’-GATGCCTCCTGGTTGAACTC for the probe specific for APLP1 exons 2–4 (356 365bp), 5’-CAGCTTGTGGAAACCCATCT and 5’-TTTCATCTGGGCGGCCTTTT for the probe specific APLP2 exons 10–11 (228 bp), and 5’-ACCACAGTCCATGCCATCAC and 5’-TCCACCACCCTGTTGCTGTA for the probe specific for GAPDH exons 5–7 (452 bp). Hybridization was performed using α−32P-dCTP-labeled probes specific for each gene. Specific signals were detected by autoradiography with Hyperfilm (Amersham). NIH Image J software was used to quantify the level of transcripts by comparing the intensities of the bands after subtracting the background.
Western Analysis
The neocortex, hippocampus and cerebellum were dissected from the brain. Fresh tissues were homogenized in an ice-cold stringent RIPA buffer (50 mM Tris-Cl (pH 7.6), 150 mM NaCl, 0.5 mM EDTA, 1% NP40, 0.5% sodium deoxycholate, 0.1% SDS, 1mM PMSF supplement with protease inhibitor cocktail and phosphatase inhibitor cocktail (Sigma)), followed by sonication. Homogenates were centrifuged at 14,000xg for 20 min at 4°C to separate supernatants (RIPA buffer-soluble fraction). Equal amount (10–40 μg per lane) of total proteins from each preparation were loaded and separated on NuPAGE gels (Invitrogen), and transferred to nitrocellulose membranes. The membranes were blocked in 5% skim milk/TBS for 1 hour, and incubated at 4°C overnight with specific primary antibodies. Primary antibodies used were rabbit anti-APP (Sigma-Aldrich, A8717, RRID: AB_258409), rabbit anti-APP-Y188 (Abcam, ab32136, RRID: AB_2289606), rabbit anti-APLP1 (Millipore, #171615, RRID: AB_565288), rabbit anti-APLP1 (CT11, gift of D. Walsh), rabbit anti-APLP2 (Millipore, #171616, RRID: AB_211446), rabbit anti-APLP2 (D2-II, gift of D. Walsh), rabbit anti-MAP2 (Cell Signaling, #4542, RRID: AB_776174), rabbit anti-SYP (Cell Signaling, #5431, RRID: AB_10698743), rabbit anti-SNAP25 (abcam, ab108990, RRID: AB_10888111), rabbit anti-PSD95 (Cell Signaling, #2507, RRID: AB_1264242), anti-GFAP (Sigma-Aldrich, G6171, RRID: AB_1840893), mouse anti-β-actin (Sigma-Aldrich, A1978, RRID: AB_476692), mouse anti-β-actin (Cell Signaling, #3700, RRID: AB_2242334), and rabbit anti-β-actin (Cell Signaling, #4967, RRID: AB_330288). Membranes were then incubated with dye-coupled secondary antibodies, goat anti-rabbit IRdye680 (LI-COR Biosciences, #926–69071, RRID: AB_10956166), goat anti-mouse IRdye680 (LI-COR Biosciences, #925–68070, RRID: AB_2651128), goat anti-rabbit IRdye800 (LI-COR Biosciences, #925–32211, RRID: AB_2651127), or goat anti-mouse IRdye800 from (LI-COR Biosciences, #925–32210, RRID: AB_2687825). Signals were quantified using the Odyssey Infrared Imaging System (LI-COR Biosciences).
Histological Analysis
The experimenter of all subsequent phenotypic analysis was blind to the genotype of the mice. Mice were anesthetized and then transcardially perfused with phosphate-buffered saline solution (PBS, pH7.4) containing 0.25 g/L heparin (Sigma) and 5 g/L procaine (Sigma). Brains were post-fixed in 4% formaldehyde in PBS (pH 7.4) (Electron Microscopy Sciences) at 4°C overnight and then processed for paraffin embedding following standard procedures. Serial sagittal sections (10 μm) were obtained using Leica RM2235. For Nissl staining, paraffin sagittal sections were deparaffinized, dehydrated, and stained with 0.5% cresyl violet (Sigma-Aldrich). Immunohistochemical analysis was performed as previously described (Yamaguchi and Shen, 2013). Briefly, paraffin sagittal sections were deparaffinized, alcohol-dehydrated, then subjected to permeabilization with a solution containing 0.1% Triton X-100, 0.1% sodium citrate in PBS, except those for cleaved-caspase3 immunostaining, which were performed antigen retrieval by microwaving for 10 min in 10 mM sodium citrate buffer, pH 6.0. Endogenous peroxidase activity was quenched by incubating in 0.3% H2O2 in methanol. Sections were then blocked with a solution containing 5% normal goat serum for 1 hour at room temperature (Vector Laboratories). After blocking, sections were incubated with primary antibodies overnight at 4°C. The primary antibodies used were rabbit mouse anti-NeuN (1:400, Millipore, MAB377, RRID: AB_2298772), mouse anti-GFAP (1:500, Sigma-Aldrich, G6171, RRID: AB_1840893), or rabbit anti-cleaved caspases-3 (1:150, Cell Signaling, #9661, RRID: AB_2341188) followed by 1h incubation with biotinylated secondary antibodies at room temperature and 1h incubation with Vectastain Elite ABC reagent and then developed using chromogenic DAB substrate (Vector Laboratories).
For the TUNEL assay, deparaffinized and rehydrated brain sections were subjected to permeabilization with a solution containing 0.1% Triton X-100, 0.1% sodium citrate in PBS for 8 min. Sections were then blocked with a solution containing 5% normal goat serum (Vector Laboratories) for 1hr at room temperature followed by the protocol of the manufacturer of the In Situ Cell Death Detection kit (Roche). The slides were then washed using PBS three times. Images were captured and analyzed using an Olympus IX51 fluorescent microscope.
For frozen sections, post-fixed brains were immersed on a sucrose series solution (15 and 30% sucrose in PBS) at 4°C overnight for cryoprotection. Serial frozen sagittal sections (10 μm) were obtained using Leica CM1860. Frozen brain sections were washed with PBS to rinse out OCT, and then blocked with a solution containing 5% normal goat serum for 1 hour at room temperature (Vector Laboratories). After blocking, sections were incubated with primary antibodies overnight at 4°C. The primary antibodies used were rabbit anti-APP-Y188 (1:250, Abcam, ab32136, RRID: AB_2289606), mouse anti-NeuN (1:400, Millipore, MAB377, RRID: AB_2298772), and mouse anti-GAD67 (1:500, Millipore, MAB5406, RRID: AB_2278725) followed by 1h incubation with fluorophore conjugated secondary antibodies, Alexa Fluor 488 goat anti-rabbit IgG (1:250, A-11034, Thermo Fisher Scientific) and Alexa Fluor 555 goat anti-mouse IgG (1:250, A-11034, Thermo Fisher Scientific) at room temperature. Fluorescence images were taken and analyzed by FV1000 confocal microscope system (Olympus).
Stereological Quantification
The Nissl or NeuN-stained sections were analyzed using an unbiased fractionator and optical dissector method, and the images were analyzed using the BioQuant image analysis software that was connected to the Olympus BX51 microscope with a CCD camera. Approximately forty optical dissectors of the 100 × 100 μm sampling box were used for the quantification in the neocortical area, and twenty optical dissectors of the 50 × 50 μm sampling box were used for CA1 hippocampal area. The volume of the neocortex and the hippocampus was quantified using Nissl-stained series sections (every 40th sagittal sections, spaced 0.4 mm apart; total 6 sections per hemisphere) and the BioQuant image analysis software, and the volume was calculated to reflect both hemispheres. The number of neurons can be counted with an indicator of NeuN positive cells through the 40X objective lens from all the picked slides. Finally, average number of neurons was calculated per genotype (n≥7 mice per genotype per age group). The coefficient of error from the counting technique was <0.10.
The number of active caspase-3 immunoreactivity cells or TUNEL+ cells in the neocortical area was determined from using series sections (every 30th sagittal sections, spaced 0.3 mm apart; total 8 sections per hemisphere), and the number of positive cells from each section was counted. The total number of active caspase-3- or TUNEL-positive cells in the neocortex of the hemisphere was calculated by multiplying 30 with the total number of positive cells in the neocortex of one hemisphere in all 8 sections. GFAP-stained sections (every 40th sagittal sections, spaced 0.4 mm apart; 6 sections per hemisphere) were analyzed using Olympus BX51 microscope with a CCD camera. The GFAP-immunoreactive area and the total area of the neocortex and hippocampus were measured under 4X objective lens using the BioQuant image analysis software. The GFAP-immunoreactive area was calculated as GFAP+ area/total area. Statistical outliers were identified using the ROUT test with Q=1%. The experimenter was blind to the genotype of the mice. Values are reported as mean ± SEM.
Behavior Analysis
APP/APLP1/APLP2 cTKO mice (n=15, 5 male and 10 female) and littermate controls (n=15, 8 male and 7 female) at 3 months of age were used for the analysis, and they were individually handled daily for 5 days before testing.
Rotarod test:
For the rotarod test, 4 mice were placed at a time on an Economex accelerating rotarod (Columbus Instruments) equipped with individual timers for each mouse. Mice were initially trained to stay on the rod at a constant rotation speed of 5 rpm. After a 2-min rest, mice that would fall were repeatedly placed back on the rotarod until they were able to stay on the rotating rod for at least 2 min. Following training, mice were subsequently tested by placing them on the rod at a rotation speed of 5 rpm, as the rod accelerated by 0.2 rpm/sec, the latency to fall was measured. Mice were tested for a total of 3 trials. After each trial, animals were returned to their home cage.
Open field test:
For the open field test, individual mice were placed in 42 × 42 cm acrylic animal cages for 60 min during which their horizontal and vertical movements were monitored by three arrays of 16 infrared light beam sensors (AccuScan Instruments) connected to a computer that recorded their position every millisecond. AccuScan VersaMax software was then used to calculate, in both the horizontal plane and along the vertical axis, the total number of movements, the distance traveled, the time spent moving, and the total number of infrared beam breaks for each mouse.
Hidden platform water maze task:
The Morris water maze is a circular pool 160 cm in diameter. The release point for each training trail was varied among all four quadrants in a pseudorandom manner. Four distal visual cues were placed on the walls during training and full-cue probe tests, whereas three of the cures were removed for the partial-cue probe test. The escape platform (10 cm in diameter) was submerged ~1cm beneath the water surface and maintained in a constant position. Mice received four training trails daily with a maximum duration of 90 sec. and an inter-trial interval of 15 min. Mice that did not located the platform during a training trial were guided to the platform and allowed to remain on it for 15 sec. Location of mice in the pool was continuously monitored using an automated tracking system (HSV Image).
After 6 days and 12 days training, probe tests were performed in the morning of day 7 and day 13 prior to administering new training trails. Probe tests were conducted by removing the hidden platform, releasing mice form the opposite quadrant, and allowing them to search for the platform location for 90 sec. Upon completion of the probe tests, the platform was re-installed in the same position and four new training trails were administered. After completion of the hidden platform water maze task, the visible-cue version of the task was performed to verify visual and swimming ability by administering four trails with the platform position marked by a yellow object.
Electrophysiological Analysis
Both male and female APP/APLP1/APLP2 cTKO mice and littermate controls at 3 months of age were used for the analysis. Mice were decapitated after being anesthetized with ketamine (100 mg/kg) + xylazine (10 mg/kg) + acepromazine (3 mg/kg). The brain was removed and placed in ice-cold (4°C) oxygenated (95% O2/5% CO2) high sucrose and magnesium solution containing (in mM) the following: 200 Sucrose, 25 NaHCO3, 10 Glucose, 3 KCl, 1.25 NaH2PO4, 1.2 Na-pyruvate and 0.4 Na-ascorbate, 7 MgCl2, and 0.5 CaCl2. Horizontal hippocampal slices (400 μm thick) were prepared using a vibratome (VT1200S, Leica, Germany), and transferred to an incubation chamber having oxygenated artificial cerebrospinal fluid (ACSF) containing (in mM) the following: 125 NaCl, 3 KCl, 1.25 NaH2PO4, 1 MgCl2, 2 CaCl2, 25 NaHCO3, 10 Glucose, 1.2 Na-pyruvate and 0.4 Na-ascorbate, adjusted to 310 ± 5 mOsm (pH 7.4). The slices were allowed to recover at 34°C for 60 min and then placed in a recording chamber constantly perfused with heated ACSF (32 ± 1 °C) and gassed continuously with 95% O2 and 5% CO2. The flow rate of bathing solution and the volume of the recording chamber for slices were 2.2 ml/min and 1.2 ml, respectively. Hippocampal slices were visualized using an upright microscope equipped with differential interference contrast (DIC) optics (BX51WI, Olympus, Japan). The DIC optics was used for visualization of neurons in the course of whole-cell recordings.
For extracellular field recordings, stimulation pulses were delivered with a stimulus isolation unit (World Precision Instruments, A365) using unipolar metal microelectrodes. Field excitatory postsynaptic potentials (fEPSPs) were recorded in current-clamp mode with ACSF-filled patch pipettes (1.5–2 MΩ). All fEPSPs were recorded with a stimulation strength that yielded 50% of the maximal response. Data were collected with a MultiClamp 700B amplifier (Molecular Devices) and digitized at 10 kHz using the A/D converter DIGIDATA 1322A (Molecular Devices). In a subset of experiments, the following drugs were used at the following concentrations via bath application or adding intracellular recording solutions: Picrotoxin (100 μM, Tocris #1128), APV (50 μM, Tocris #0106), Tetrodotoxin (TTX: 1 μM, Tocris #1069), NBQX (10 μM, Tocris #1044) and XE991 dihydrochloride (3 μM, Tocris #2000).
For AMPA receptor-mediated input/output (I/O) measurements, I/O relationships obtained by plotting the amplitude of fiber volley (FV) versus the fEPSP slope in the presence of blockers of NMDA (50 μM APV) and GABAA receptors (100 μM Picrotoxin). 10 traces were averaged for each stimulation intensity, and the amplitude of the FV was measured relative to the slope of the fEPSP. The stimulation rate was 0.2 Hz. The average linear fit slope was calculated as the slope of the linear I/O relationship for each slice. In LTP recordings, after baseline responses were collected every 15 sec for 15 min, LTP was induced by five episodes of TBS delivered at 0.1 Hz. Each episode contained ten stimulus trains (5 pulses at 100 Hz) delivered at 5 Hz. To generate summary graphs (mean ± SEM), individual experiments were normalized to the baseline, and four consecutive responses were averaged to generate 1 min bins. These were then averaged together to generate the final summary graphs. Paired-pulse facilitation (PPF) was measured as the ratio of the second fEPSP slope relative to the first fEPSP slope, evoked by two identical presynaptic stimuli. Synaptic facilitation was measured as the percentage of the fEPSP slope versus the first fEPSP slope at a given stimulus train in individual slices.
For whole-cell patch clamp experiments, recording pipettes (3–5 MΩ) were filled with a solution containing (in mM) the following: 120 K-gluconate, 10 KCl, 20 HEPES, 4 MgATP, 0.3 NaGTP, 10 phosphocreatine, and 0.1 EGTA with the pH adjusted to 7.30 with KOH (295–300 mOsm). Spontaneous or miniature excitatory postsynaptic currents (sEPSCs or mEPSCs) were recorded from CA1 pyramidal neurons in voltage-clamp mode at a holding potential of −70 mV in the presence of 100 μM picrotoxin for the blockade of GABAA receptor without or with 1 μM TTX, respectively. The F-I curve, AP frequency (F) against the magnitude of injected currents (I), was induced by depolarizing current injections (ranging from −100 pA to 400 pA, 300 ms-long, with 50 pA increment), in CA1 neurons in current clamp mode. Spontaneous inhibitory postsynaptic currents (sIPSCs) were recorded from CA1 pyramidal neurons in voltage-clamp mode at a holding potential of −70 mV in the presence of blockers of AMPA (10 μM NBQX) and NMDA (50 μM APV) receptors. Input/output relations for evoked GABAAR IPSCs and paired-pulse depressions (PPD) at inter-pulse intervals ranging from 20 to 1000 ms were elicited by the stimulation electrode placed ~300 μm away from the recording electrode in the CA1 stratum pyramidale and recorded at a holding potential of −70 mV in the presence of blockers of AMPA (10 μM NBQX) and NMDA (50 μM APV) receptors. The recording pipettes (3–5 MΩ) were filled with a solution containing (in mM) the following: 130 KCl, 10 phosphocreatine, 20 HEPES, 4 MgATP, and 0.3 NaGTP, , and 0.1 EGTA with the pH adjusted to 7.30 with KOH (295–300 mOsm). The series resistance (Rs) after establishing whole-cell configuration was between 15 and 25 MΩ. EPSC recordings with >20% series resistance changes were excluded from data analysis.
QUANTIFICATION AND STATISTICAL ANALYSIS
Data acquisition and quantification was performed in a genotype blind manner with the exception of the molecular analysis (Southern, Northern, and Western). All statistical analyses were performed using Prism 8 (GraphPad Software), Excel (Microsoft), Igor Pro (Version 6.37; Wave-Metrics) or Clampfit (Version 10.3; Molecular device). All data are presented as the mean ± SEM. The exact sample size (e.g. the number of mice, brains, slices, or neurons) of each experiment is indicated in the figure.
Statistical analysis were conducted using Student’s t test (Figures 1C, 2D, 2E, 2F, 3D, 4B, 4D, 4E, 5B, 5C, 5D, 5G, 6B, 6C, 6E, 7C, 7D, 7E, 7G, S2A, S2B, S3A, S4A, S4B, S4C, S4D, S5B, S6A, S6B), one-way ANOVA followed up by Tukey’s multiple comparisons tests (Figures 1D, 4E), one-way ANOVA followed up by Dunnett’s multiple comparisons test (Figure S1), two-way ANOVA followed up by Bonferroni multiple comparisons test (Figures 2C, 2D, 3, 4A, 4C, 5E, 5F, 6D, 7B, S3B, S3C, S6C) and linear regression fit (Figure 5A). All statistical comparisons were performed on data from ≥ 3 biologically independent samples. Significance is shown as *p < 0.05, **p < 0.01, ***p < 0.001, ****p < 0.0001, or NS (not significant).
Supplementary Material
KEY RESOURCES TABLE
| REAGENT or RESOURCE | SOURCE | IDENTIFIER |
|---|---|---|
| Antibodies | ||
| Rabbit anti-APP [Y188] | abcam | AB_2289606 |
| Rabbit anti-APP-CTF | Sigma-Aldrich | AB_258409 |
| Rabbit anti-APLP1 | D. Walsh's Lab | N/A |
| Rabbit anti-APLP1-C-term [643–653] | Millipore | AB_565288 |
| Rabbit anti-APLP2 | D. Walsh's Lab | N/A |
| Rabbit anti-APLP2-C-term [752–763] | Millipore | AB_211446 |
| Mouse anti-NeuN | Millipore | AB_2298772 |
| Mouse anti-GAD67 | Millipore | AB_2278725 |
| Rabbit anti-Cleaved Caspase3 (Asp175) | Cell signaling | AB_2341188 |
| Mouse anti-MAP2 | abcam | AB_776174 |
| Rabbit anti-PSD95 | Cell signaling | AB_1264242 |
| Rabbit anti-Synaptophysin | Cell signaling | AB_10698743 |
| Rabbit anti-SNAP25 | abcam | AB_10888111 |
| Mouse anti-GFAP | Sigma-Aldrich | AB_1840893 |
| Mouse anti-β-actin | Sigma-Aldrich | AB_476692 |
| Mouse anti-β-actin | Cell signaling | AB_2242334 |
| Rabbit anti-β-actin | Cell signaling | AB_330288 |
| Goat Biotynylated anti-Rabbit IgG (H&L) | Vector Laboratories | AB_2313606 |
| Goat Biotynylated anti-Mouse IgG (H&L) | Vector Laboratories | AB_2336171 |
| Goat anti-Rabbit IRdye680 Secondary Antibody | LI-COR Biosciences | AB_10956166 |
| Goat anti-Mouse IRdye680 Secondary Antibody | LI-COR Biosciences | AB_2651128 |
| Goat anti-Rabbit IRdye800 Secondary Antibody | LI-COR Biosciences | AB_2651127 |
| Goat anti-Mouse IRdye800 Secondary Antibody | LI-COR Biosciences | AB_2687825 |
| Alexa Fluor® 488 Goat Anti-Rabbit IgG (H+L) | Thermo Fisher Scientific | AB_2576217 |
| Alexa Fluor® 555 Goat Anti-Mouse IgG (H+L) | Thermo Fisher Scientific | AB_141780 |
| Bacterial and Virus Strains | ||
| Biological Samples | ||
| Chemicals, Peptides, and Recombinant Proteins | ||
| TRIzol | Sigma-Aldrich | Cat # T9424 |
| Vectastain Elite ABC reagent | Vector laboratories | AB_2336827 |
| RIPA buffer | Thermo Fisher Scientific | Cat # 89900 |
| Protease Inhibitor Cocktail | Sigma-Aldrich | Cat # P8340 |
| Phosphatase Inhibitor Cocktail | Sigma-Aldrich | Cat # P2850 |
| Procaine hydrochlorid | Sigma-Aldrich | Cat # P9879 |
| Heparin | Sigma-Aldrich | Cat # H4784 |
| Normal Goat Serum Blocking Solution | Vector laboratories | Cat # S-1000 |
| Formaldehyde/Glutaraldehyde | Electron Microscopy Science | Cat # 15949 |
| Nitrocellulose Membrane | Thermo Fisher Scientific | Cat # 88018 |
| DAB Peroxidase Substrate Kit | Vector laboratories | AB_2336827 |
| VECTASHIELD Mounting Medium | Vector laboratories | Cat # H-1000 |
| In Situ Cell Death Detection Kit | Roche | Cat # 11684795910 |
| Cresyl violate (acetate) | Sigma-Aldrich | Cat # C5042 |
| Sodium chloride | Sigma-Aldrich | Cat # S5886 |
| Potassium chloride | Sigma-Aldrich | Cat # P9541 |
| Sucrose | Sigma-Aldrich | Cat # S7903 |
| D-(+)-Glucose | Sigma-Aldrich | Cat # G5767 |
| Sodium phosphate monobasic | Sigma-Aldrich | Cat # S5011 |
| Sodium bicarbonate | Sigma-Aldrich | Cat # S5761 |
| Sodium pyruvate | Sigma-Aldrich | Cat # P5280 |
| (+)-Sodium L-ascorbate | Sigma-Aldrich | Cat # A4034 |
| Calcium chloride dihydrate | Sigma-Aldrich | Cat # 223506 |
| Magnesium chloride hexahydrate | Sigma-Aldrich | Cat # M9272 |
| HEPES | Sigma-Aldrich | Cat # H3375 |
| EGTA | Boston Bio Products | Cat # BM-151 |
| Adenosine 5′-triphosphate magnesium salt | Sigma-Aldrich | Cat # A9187 |
| Guanosine-13C10 5′-triphosphate sodium salt | Sigma-Aldrich | Cat # G8877 |
| Potassium D-gluconate | Sigma-Aldrich | Cat # G4500 |
| Phosphocreatine disodium salt hydrate | Sigma-Aldrich | Cat # P7936 |
| Picrotoxin | Tocris | Cat # 1128 |
| APV | Tocris | Cat # 0106 |
| NBQX disodium salt | Tocris | Cat # 1044 |
| Tetrodotoxin | Tocris | Cat # 1069 |
| XE991 dihydrochloride | Tocris | Cat # 2000 |
| Critical Commercial Assays | ||
| Deposited Data | ||
| Raw and analyzed data | This paper; and Mendeley Data | http://dx.doi.org/10.17632/vs48zct2xp.1 |
| Experimental Models: Cell Lines | ||
| Mouse: MKV6.5 ES cell | R. Jaenisch's Lab | N/A |
| Experimental Models: Organisms/Strains | ||
| Mouse: B6129SF1/J | The Jackson Laboratory | IMSR_JAX:101043 |
| Mouse: Camk2a-Cre transgenic | Yu et al., 2001 | N/A |
| Mouse: B6.Cg-Tg(ACTFLPe)9205Dym/J | Rodriguez et al., 2000 | IMSR_JAX:005703 |
| Mouse: fAPP/fAPP | This paper | N/A |
| Mouse: fAPLP1/fAPLP1 | This paper | N/A |
| Mouse: fAPLP2/fAPLP2 | This paper | N/A |
| Oligonucleotides | ||
| See Table S1 for The List of Oligonucleotides | ||
| Recombinant DNA | ||
| Software and Algorithms | ||
| Image-Studio | Li-Cor | SCR_013715 |
| Fiji (ImageJ) | NIH | SCR_002285 |
| PRISM 8 | GraphPad | SCR_005375 |
| Bioquant Life Science | Bioquant Life Science | SCR_016423 |
| Accuscan Versamax | AccuScan Instruments | v.1.05 |
| HVS Image 2020 Plus tracking system | HVS Image | v.5/2003 |
| FV10-ASW | Olympus | SCR_014215 |
| Clampfit | Molecular device | v.10.3 |
| Igor Pro | Wave-Metrics | SCR_000325 |
| Other | ||
Highlights.
APP family is not required for survival of cortical neurons during aging
APP family is important for hippocampal learning and memory
APP family regulates hippocampal synaptic plasticity
APP family controls neuronal excitability through Kv7 channels
Acknowledgments
We thank Huailong Zhao for breeding and genotyping the mice, Morgan Fraser for technical assistance and the Shen lab members for discussion. We also thank Dominic Walsh for the APLP1 and APLP2 antibodies. This work was supported by grants from the NIH (R01NS042818 and R01NS041783) and a Zenith award from the Alzheimer’s Association (to J.S.).
Footnotes
Publisher's Disclaimer: This is a PDF file of an unedited manuscript that has been accepted for publication. As a service to our customers we are providing this early version of the manuscript. The manuscript will undergo copyediting, typesetting, and review of the resulting proof before it is published in its final form. Please note that during the production process errors may be discovered which could affect the content, and all legal disclaimers that apply to the journal pertain.
Declaration of Interests
J.S. is a member of the Board of Directors and has a financial interest in iNeuro Therapeutics, and J.S. also has a financial interest in Apres Therapeutics. Both companies develop therapies for Alzheimer’s disease. J.S.’s interests were reviewed and are managed by BWH and Partners HealthCare in accordance with their conflict of interest policies.
Reference
- Biervert C, Schroeder BC, Kubisch C, Berkovic SF, Propping P, Jentsch TJ, and Steinlein OK (1998). A potassium channel mutation in neonatal human epilepsy. Science 279, 403–406. [DOI] [PubMed] [Google Scholar]
- Bliss TVP, and Collingridge GL (1993). A synaptic model of memory: long-term potentiation in the hippocampus. Nature 361, 31–39. [DOI] [PubMed] [Google Scholar]
- Brown DA, and Adams PR (1980). Muscarinic suppression of a novel voltage-sensitive K+ current in a vertebrate neurone. Nature 283, 673–676. [DOI] [PubMed] [Google Scholar]
- Charlier C, Singh NA, Ryan SG, Lewis TB, Reus BE, Leach RJ, and Leppert M (1998). A pore mutation in a novel KQT-like potassium channel gene in an idiopathic epilepsy family. Nat Genet 18, 53–55. [DOI] [PubMed] [Google Scholar]
- Chen G, Zou X, Watanabe H, van Deursen JM, and Shen J (2010). CREB binding protein is required for both short-term and long-term memory formation. J Neurosci 30, 13066–13077. [DOI] [PMC free article] [PubMed] [Google Scholar]
- Dawson GR, Seabrook GR, Zheng H, Smith DW, Graham S, O’Dowd G, Bowery BJ, Boyce S, Trumbauer ME, Chen HY, et al. (1999). Age-related cognitive deficits, impaired long-term potentiation and reduction in synaptic marker density in mice lacking the β-amyloid precursor protein. Neuroscience 90, 1–13. [DOI] [PubMed] [Google Scholar]
- Delmas P, and Brown DA (2005). Pathways modulating neural KCNQ/M (Kv7) potassium channels. Nat Rev Neurosci 6, 850–862. [DOI] [PubMed] [Google Scholar]
- Fanutza T, Del Prete D, Ford MJ, Castillo PE, and D’Adamio L (2015). APP and APLP2 interact with the synaptic release machinery and facilitate transmitter release at hippocampal synapses. eLife 4, e09743. [DOI] [PMC free article] [PubMed] [Google Scholar]
- Glenner GG, and Wong CW (1984). Alzheimer’s disease: Initial report of the purification and characterization of a novel cerebrovascular amyloid protein. Biochemical and Biophysical Research Communications 120, 885–890. [DOI] [PubMed] [Google Scholar]
- Goate A, Chartier-Harlin M-C, Mullan M, Brown J, Crawford F, Fidani L, Giuffra L, Haynes A, Irving N, James L, et al. (1991). Segregation of a missense mutation in the amyloid precursor protein gene with familial Alzheimer’s disease. Nature 349, 704–706. [DOI] [PubMed] [Google Scholar]
- Goebbels S, Bormuth I, Bode U, Hermanson O, Schwab MH, and Nave KA (2006). Genetic targeting of principal neurons in neocortex and hippocampus of NEX-Cre mice. Genesis 44, 611–621. [DOI] [PubMed] [Google Scholar]
- Heber S, Herms J, Gajic V, Hainfellner J, Aguzzi A, Rülicke T, Kretzschmar H, von Koch C, Sisodia S, Tremml P, et al. (2000). Mice with Combined Gene Knock-Outs Reveal Essential and Partially Redundant Functions of Amyloid Precursor Protein Family Members. The Journal of Neuroscience 20, 7951–7963. [DOI] [PMC free article] [PubMed] [Google Scholar]
- Herms J, Anliker B, Heber S, Ring S, Fuhrmann M, Kretzschmar H, Sisodia S, and Müller U (2004). Cortical dysplasia resembling human type 2 lissencephaly in mice lacking all three APP family members. The EMBO Journal 23, 4106–4115. [DOI] [PMC free article] [PubMed] [Google Scholar]
- Hick M, Herrmann U, Weyer SW, Mallm JP, Tschape JA, Borgers M, Mercken M, Roth FC, Draguhn A, Slomianka L, et al. (2015). Acute function of secreted amyloid precursor protein fragment APPsalpha in synaptic plasticity. Acta Neuropathol 129, 21–37. [DOI] [PubMed] [Google Scholar]
- Jentsch TJ (2000). Neuronal KCNQ potassium channels: physiology and role in disease. Nat Rev Neurosci 1, 21–30. [DOI] [PubMed] [Google Scholar]
- Kang J, Shin S, Perrimon N, and Shen J (2017). An Evolutionarily Conserved Role of Presenilin in Neuronal Protection in the Aging Drosophila Brain. Genetics 206, 1479–1493. [DOI] [PMC free article] [PubMed] [Google Scholar]
- Lee KJ, Moussa CEH, Lee Y, Sung Y, Howell BW, Turner RS, Pak DTS, and Hoe HS (2010). Beta amyloid-independent role of amyloid precursor protein in generation and maintenance of dendritic spines. Neuroscience 169, 344–356. [DOI] [PMC free article] [PubMed] [Google Scholar]
- Levy-Lahad E, Wasco W, Poorkaj P, Romano DM, Oshima J, Pettingell WH, Yu CE, Jondro PD, Schmidt SD, Wang K, et al. (1995). Candidate gene for the chromosome 1 familial Alzheimer's disease locus. Science 269, 973. [DOI] [PubMed] [Google Scholar]
- Levy E, Carman MD, Fernandez-Madrid IJ, Power MD, Lieberburg I, van Duinen SG, Bots GT, Luyendijk W, and Frangione B (1990). Mutation of the Alzheimer’s disease amyloid gene in hereditary cerebral hemorrhage, Dutch type. Science 248, 1124–1126. [DOI] [PubMed] [Google Scholar]
- Lorent K, Overbergh L, Moechars D, de Strooper B, van Leuven F, and van den Berghe H (1995). Expression in mouse embryos and in adult mouse brain of three members of the amyloid precursor protein family, of the alpha-2-macroglobulin receptor/low density lipoprotein receptor-related protein and of its ligands apolipoprotein E, lipoprotein lipase, alpha-2-macroglobulin and the 40,000 molecular weight receptor-associated protein. Neuroscience 65, 1009–1025. [DOI] [PubMed] [Google Scholar]
- Madison DV, and Nicoll RA (1984). Control of the repetitive discharge of rat CA 1 pyramidal neurones in vitro. J Physiol 354, 319–331. [DOI] [PMC free article] [PubMed] [Google Scholar]
- Main MJ, Cryan JE, Dupere JR, Cox B, Clare JJ, and Burbidge SA (2000). Modulation of KCNQ2/3 potassium channels by the novel anticonvulsant retigabine. Mol Pharmacol 58, 253–262. [DOI] [PubMed] [Google Scholar]
- Muller U, Cristina N, Li ZW, Wolfer DP, Lipp HP, Rulicke T, Brandner S, Aguzzi A, and Weissmann C (1994). Behavioral and anatomical deficits in mice homozygous for a modified beta-amyloid precursor protein gene. Cell 79, 755–765. [DOI] [PubMed] [Google Scholar]
- Müller UC, Deller T, and Korte M (2017). Not just amyloid: physiological functions of the amyloid precursor protein family. Nature Reviews Neuroscience 18, 281. [DOI] [PubMed] [Google Scholar]
- Otto JF, Yang Y, Frankel WN, White HS, and Wilcox KS (2006). A spontaneous mutation involving Kcnq2 (Kv7.2) reduces M-current density and spike frequency adaptation in mouse CA1 neurons. J Neurosci 26, 2053–2059. [DOI] [PMC free article] [PubMed] [Google Scholar]
- Palop JJ, Chin J, Roberson ED, Wang J, Thwin MT, Bien-Ly N, Yoo J, Ho KO, Yu GQ, Kreitzer A, et al. (2007). Aberrant excitatory neuronal activity and compensatory remodeling of inhibitory hippocampal circuits in mouse models of Alzheimer’s disease. Neuron 55, 697–711. [DOI] [PMC free article] [PubMed] [Google Scholar]
- Pan Z, Kao T, Horvath Z, Lemos J, Sul JY, Cranstoun SD, Bennett V, Scherer SS, and Cooper EC (2006). A common ankyrin-G-based mechanism retains KCNQ and NaV channels at electrically active domains of the axon. J Neurosci 26, 2599–2613. [DOI] [PMC free article] [PubMed] [Google Scholar]
- Peters HC, Hu H, Pongs O, Storm JF, and Isbrandt D (2005). Conditional transgenic suppression of M channels in mouse brain reveals functions in neuronal excitability, resonance and behavior. Nat Neurosci 8, 51–60. [DOI] [PubMed] [Google Scholar]
- Phinney AL, Calhoun ME, Wolfer DP, Lipp HP, Zheng H, and Jucker M (1999). No hippocampal neuron or synaptic bouton loss in learning-impaired aged β-Amyloid precursor protein-null mice. Neuroscience 90, 1207–1216. [DOI] [PubMed] [Google Scholar]
- Puzzo D, Piacentini R, Fa M, Gulisano W, Li Puma DD, Staniszewski A, Zhang H, Tropea MR, Cocco S, Palmeri A, et al. (2017). LTP and memory impairment caused by extracellular Abeta and Tau oligomers is APP-dependent. Elife 6. [DOI] [PMC free article] [PubMed] [Google Scholar]
- Rasmussen HB, Frokjaer-Jensen C, Jensen CS, Jensen HS, Jorgensen NK, Misonou H, Trimmer JS, Olesen SP, and Schmitt N (2007). Requirement of subunit co-assembly and ankyrin-G for M-channel localization at the axon initial segment. J Cell Sci 120, 953–963. [DOI] [PubMed] [Google Scholar]
- Ring S, Weyer SW, Kilian SB, Waldron E, Pietrzik CU, Filippov MA, Herms J, Buchholz C, Eckman CB, Korte M, et al. (2007). The Secreted β-Amyloid Precursor Protein Ectodomain APPsα Is Sufficient to Rescue the Anatomical, Behavioral, and Electrophysiological Abnormalities of APP-Deficient Mice. The Journal of Neuroscience 27, 7817. [DOI] [PMC free article] [PubMed] [Google Scholar]
- Rodriguez CI, Buchholz F, Galloway J, Sequerra R, Kasper J, Ayala R, Stewart AF, and Dymecki SM (2000). High-efficiency deleter mice show that FLPe is an alternative to Cre-loxP. Nat Genet 25, 139–140. [DOI] [PubMed] [Google Scholar]
- Rogaev EI, Sherrington R, Rogaeva EA, Levesque G, Ikeda M, Liang Y, Chi H, Lin C, Holman K, Tsuda T, et al. (1995). Familial Alzheimer’s disease in kindreds with missense mutations in a gene on chromosome 1 related to the Alzheimer’s disease type 3 gene. Nature 376, 775–778. [DOI] [PubMed] [Google Scholar]
- Rovelet-Lecrux A, Hannequin D, Raux G, Meur NL, Laquerrière A, Vital A, Dumanchin C, Feuillette S, Brice A, Vercelletto M, et al. (2006). APP locus duplication causes autosomal dominant early-onset Alzheimer disease with cerebral amyloid angiopathy. Nature Genetics 38, 24–26. [DOI] [PubMed] [Google Scholar]
- Saura CA, Chen G, Malkani S, Choi SY, Takahashi RH, Zhang D, Gouras GK, Kirkwood A, Morris RG, and Shen J (2005). Conditional inactivation of presenilin 1 prevents amyloid accumulation and temporarily rescues contextual and spatial working memory impairments in amyloid precursor protein transgenic mice. J Neurosci 25, 6755–6764. [DOI] [PMC free article] [PubMed] [Google Scholar]
- Saura CA, Choi SY, Beglopoulos V, Malkani S, Zhang D, Shankaranarayana Rao BS, Chattarji S, Kelleher RJ 3rd, Kandel ER, Duff K, et al. (2004). Loss of presenilin function causes impairments of memory and synaptic plasticity followed by age-dependent neurodegeneration. Neuron 42, 23–36. [DOI] [PubMed] [Google Scholar]
- Seabrook GR, Smith DW, Bowery BJ, Easter A, Reynolds T, Fitzjohn SM, Morton RA, Zheng H, Dawson GR, Sirinathsinghji DJS, et al. (1999). Mechanisms contributing to the deficits in hippocampal synaptic plasticity in mice lacking amyloid precursor protein. Neuropharmacology 38, 349–359. [DOI] [PubMed] [Google Scholar]
- Selyanko AA, Hadley JK, Wood IC, Abogadie FC, Jentsch TJ, and Brown DA (2000). Inhibition of KCNQ1–4 potassium channels expressed in mammalian cells via M1 muscarinic acetylcholine receptors. J Physiol 522 Pt 3, 349–355. [DOI] [PMC free article] [PubMed] [Google Scholar]
- Shah MM, Migliore M, Valencia I, Cooper EC, and Brown DA (2008). Functional significance of axonal Kv7 channels in hippocampal pyramidal neurons. Proc Natl Acad Sci U S A 105, 7869–7874. [DOI] [PMC free article] [PubMed] [Google Scholar]
- Shapiro MS, Roche JP, Kaftan EJ, Cruzblanca H, Mackie K, and Hille B (2000). Reconstitution of muscarinic modulation of the KCNQ2/KCNQ3 K(+) channels that underlie the neuronal M current. J Neurosci 20, 1710–1721. [DOI] [PMC free article] [PubMed] [Google Scholar]
- Sherrington R, Rogaev EI, Liang Y, Rogaeva EA, Levesque G, Ikeda M, Chi H, Lin C, Li G, Holman K, et al. (1995). Cloning of a gene bearing missense mutations in early-onset familial Alzheimer’s disease. Nature 375, 754–760. [DOI] [PubMed] [Google Scholar]
- Singh NA, Charlier C, Stauffer D, DuPont BR, Leach RJ, Melis R, Ronen GM, Bjerre I, Quattlebaum T, Murphy JV, et al. (1998). A novel potassium channel gene, KCNQ2, is mutated in an inherited epilepsy of newborns. Nat Genet 18, 25–29. [DOI] [PubMed] [Google Scholar]
- Sleegers K, Brouwers N, Gijselinck I, Theuns J, Goossens D, Wauters J, Del-Favero J, Cruts M, Duijn C.M.v., and Broeckhoven CV (2006). APP duplication is sufficient to cause early onset Alzheimer’s dementia with cerebral amyloid angiopathy. Brain 129, 2977–2983. [DOI] [PubMed] [Google Scholar]
- Steinbach JP, Muller U, Leist M, Li ZW, Nicotera P, and Aguzzi A (1998). Hypersensitivity to seizures in beta-amyloid precursor protein deficient mice. Cell Death Differ 5, 858–866. [DOI] [PubMed] [Google Scholar]
- Tabuchi K, Chen G, Sudhof TC, and Shen J (2009). Conditional forebrain inactivation of nicastrin causes progressive memory impairment and age-related neurodegeneration. J Neurosci 29, 7290–7301. [DOI] [PMC free article] [PubMed] [Google Scholar]
- Tatulian L, Delmas P, Abogadie FC, and Brown DA (2001). Activation of expressed KCNQ potassium currents and native neuronal M-type potassium currents by the anti-convulsant drug retigabine. J Neurosci 21, 5535–5545. [DOI] [PMC free article] [PubMed] [Google Scholar]
- Tyan S-H, Shih AY-J, Walsh JJ, Maruyama H, Sarsoza F, Ku L, Eggert S, Hof PR, Koo EH, and Dickstein DL (2012). Amyloid precursor protein (APP) regulates synaptic structure and function. Mol Cell Neurosci 51, 43–52. [DOI] [PMC free article] [PubMed] [Google Scholar]
- Van Broeckhoven C, Haan J, Bakker E, Hardy JA, Van Hul W, Wehnert A, Vegter-Van der Vlis M, and Roos RA (1990). Amyloid beta protein precursor gene and hereditary cerebral hemorrhage with amyloidosis (Dutch). Science 248, 1120–1122. [DOI] [PubMed] [Google Scholar]
- Verret L, Mann EO, Hang GB, Barth AM, Cobos I, Ho K, Devidze N, Masliah E, Kreitzer AC, Mody I, et al. (2012). Inhibitory interneuron deficit links altered network activity and cognitive dysfunction in Alzheimer model. Cell 149, 708–721. [DOI] [PMC free article] [PubMed] [Google Scholar]
- von Koch CS, Zheng H, Chen H, Trumbauer M, Thinakaran G, van der Ploeg LH, Price DL, and Sisodia SS (1997). Generation of APLP2 KO mice and early postnatal lethality in APLP2/APP double KO mice. Neurobiol Aging 18, 661–669. [DOI] [PubMed] [Google Scholar]
- Wang HS, Pan Z, Shi W, Brown BS, Wymore RS, Cohen IS, Dixon JE, and McKinnon D (1998). KCNQ2 and KCNQ3 potassium channel subunits: molecular correlates of the M-channel. Science 282, 1890–1893. [DOI] [PubMed] [Google Scholar]
- Wasco W, Bupp K, Magendantz M, Gusella JF, Tanzi RE, and Solomon F (1992). Identification of a mouse brain cDNA that encodes a protein related to the Alzheimer disease-associated amyloid beta protein precursor. Proceedings of the National Academy of Sciences 89, 10758. [DOI] [PMC free article] [PubMed] [Google Scholar]
- Wasco W, Gurubhagavatula S, Paradis M.d., Romano DM, Sisodia SS, Hyman BT, Neve RL, and Tanzi RE (1993). Isolation and characterization of APLP2 encoding a homologue of the Alzheimer’s associated amyloid β protein precursor. Nature Genetics 5, 95–100. [DOI] [PubMed] [Google Scholar]
- Watanabe H, Iqbal M, Zheng J, Wines-Samuelson M, and Shen J (2014). Partial loss of presenilin impairs age-dependent neuronal survival in the cerebral cortex. J Neurosci 34, 15912–15922. [DOI] [PMC free article] [PubMed] [Google Scholar]
- Watanabe H, Nagata E, Kosakai A, Nakamura M, Yokoyama M, Tanaka K, and Sasai H (2000). Disruption of the epilepsy KCNQ2 gene results in neural hyperexcitability. J Neurochem 75, 28–33. [DOI] [PubMed] [Google Scholar]
- Wickenden AD, Yu W, Zou A, Jegla T, and Wagoner PK (2000). Retigabine, a novel anti-convulsant, enhances activation of KCNQ2/Q3 potassium channels. Mol Pharmacol 58, 591–600. [DOI] [PubMed] [Google Scholar]
- Wines-Samuelson M, Schulte EC, Smith MJ, Aoki C, Liu X, Kelleher RJ 3rd, and Shen J (2010). Characterization of age-dependent and progressive cortical neuronal degeneration in presenilin conditional mutant mice. PLoS One 5, e10195. [DOI] [PMC free article] [PubMed] [Google Scholar]
- Yamaguchi H, and Shen J (2013). Histological analysis of neurodegeneration in the mouse brain. Methods Mol Biol 1004, 91–113. [DOI] [PubMed] [Google Scholar]
- Yu H, Kessler J, and Shen J (2000). Heterogeneous populations of ES cells in the generation of a floxed Presenilin-1 allele. Genesis 26, 5–8. [PubMed] [Google Scholar]
- Yu H, Saura CA, Choi SY, Sun LD, Yang X, Handler M, Kawarabayashi T, Younkin L, Fedeles B, Wilson MA, et al. (2001). APP processing and synaptic plasticity in presenilin-1 conditional knockout mice. Neuron 31, 713–726. [DOI] [PubMed] [Google Scholar]
- Zaczek R, Chorvat RJ, Saye JA, Pierdomenico ME, Maciag CM, Logue AR, Fisher BN, Rominger DH, and Earl RA (1998). Two new potent neurotransmitter release enhancers, 10,10-bis(4-pyridinylmethyl)-9(10H)-anthracenone and 10,10-bis(2-fluoro-4-pyridinylmethyl)-9(10H)-anthracenone: comparison to linopirdine. J Pharmacol Exp Ther 285, 724–730. [PubMed] [Google Scholar]
- Zhang C, Wu B, Beglopoulos V, Wines-Samuelson M, Zhang D, Dragatsis I, Sudhof TC, and Shen J (2009). Presenilins are essential for regulating neurotransmitter release. Nature 460, 632–636. [DOI] [PMC free article] [PubMed] [Google Scholar]
- Zheng H, Jiang M, Trumbauer ME, Sirinathsinghji DJ, Hopkins R, Smith DW, Heavens RP, Dawson GR, Boyce S, Conner MW, et al. (1995). beta-Amyloid precursor protein-deficient mice show reactive gliosis and decreased locomotor activity. Cell 81, 525–531. [DOI] [PubMed] [Google Scholar]
- Zheng H, and Koo EH (2006). The amyloid precursor protein: beyond amyloid. Molecular Neurodegeneration 1, 5. [DOI] [PMC free article] [PubMed] [Google Scholar]
- Zheng H, and Koo EH (2011). Biology and pathophysiology of the amyloid precursor protein. Molecular Neurodegeneration 6, 27. [DOI] [PMC free article] [PubMed] [Google Scholar]
- Zheng J, Watanabe H, Wines-Samuelson M, Zhao H, Gridley T, Kopan R, and Shen J (2012). Conditional Deletion of Notch1 and Notch2 Genes in Excitatory Neurons of Postnatal Forebrain Does Not Cause Neurodegeneration or Reduction of Notch mRNAs and Proteins. J Biol Chem 287, 20356–20368. [DOI] [PMC free article] [PubMed] [Google Scholar]
Associated Data
This section collects any data citations, data availability statements, or supplementary materials included in this article.
Supplementary Materials
Data Availability Statement
This study did not generate/analyze datasets/code.
Original data for the figures in the paper are available in Mendeley Data [http://dx.doi.org/10.17632/vs48zct2xp.1]