

Abstract
Probing epigenetic features on DNA has tremendous potential to advance our understanding of the phased epigenome. In this study, we use nanopore sequencing to evaluate CpG methylation and chromatin accessibility simultaneously on long strands of DNA by applying GpC methyltransferase to exogenously label open chromatin. We performed nanopore sequencing of Nucleosome Occupancy and Methylome (nanoNOMe) on four human cell lines (GM12878, MCF-10A, MCF-7, MDA-MB-231). The single-molecule resolution allows footprinting of protein and nucleosome binding and determining the combinatorial promoter epigenetic signature on individual molecules. Long-read sequencing makes it possible to robustly assign reads to haplotypes, allowing us to generate the first fully phased human epigenome, consisting of chromosome-level allele-specific profiles of CpG methylation and chromatin accessibility. We further apply this to a breast cancer model to evaluate differential methylation and accessibility between cancerous and non-cancerous cells.
INTRODUCTION
With the proliferation of DNA sequencing technologies, methods have been developed for examining nuclear organization, protein binding site occupancy, chromatin accessibility, and methylation state. Many of these methods rely on the vulnerability of accessible chromatin to enzymatic treatment e.g. DNAse-seq1, ATAC-seq2. One such method, NOMe-seq3, labels accessible genomic regions using an exogenous M. CviPI GpC methyltransferase. Combined with bisulfite conversion, NOME-seq permits simultaneous evaluation of endogenous cytosine methylation and nucleosome occupancy. This has been adapted to single-cell approaches which have shown the potential of nucleosome footprinting for exploring epigenetic heterogeneity4–6.
Nanopore sequencing is a single molecule long read sequencing strategy, which allows collection of data on long reads of unamplified DNA, providing deeper insight into long-range patterns on individual molecules. We and others have previously shown that endogenous CpG methylation can be accurately called with nanopore data7,8. More recently, this technology was applied to exogenous labeling of chromatin accessibility in S. Cerevisiae, a unicellular eukaryotic model organism without endogenous methylation9,10. Others have demonstrated this application on the PacBio platform even in human cells, though they did not capture endogenous methylation11,12.
To complement bulk and single-cell epigenetic methods, here we present nanopore sequencing of Nucleosome Occupancy and Methylome (nanoNOMe), where we label mammalian cells that have endogenous CpG methylation with exogenous GpC modifications at accessible sites. We are able to take advantage of the long reads (>10kb) generated by nanopore sequencing to measure methylation and accessibility across stretches of genomic regions at the single molecule level. This allowed us to evaluate allele-specific epigenetic states across the genome, including regions that are hard to characterize such as repetitive elements and structural variations. Using this approach we simultaneously determine phased patterns of native CpG methylation and chromatin accessibility in four different human cell lines. The complement of our long read sequencing methods to burgeoning single cell methods provides additional insight into the complexity of the epigenome.
RESULTS
Nanopore CpG and GpC methylation calling
We previously demonstrated CpG methylation calling from nanopore sequencing with our software tool nanopolish7. The methylation caller outputs log-likelihood ratios (LLRs) for the probability of methylation at a given k-mer, and a threshold cutoff for LLR is used to call CpGs within a k-mer as methylated or unmethylated. Extending the methylation caller to call GpC methylation simultaneously required new training sets, which we generated using combinations of M.SssI (CpG methyltransferase) and M. CviPI (GpC methyltransferase) on unmethylated (PCR amplified) Escherichia coli (E. coli) genomic DNA (see Methods). This resulted in samples with methylation at CpG, GpC, both CpG/GpC, or completely unmethylated, which we confirmed with Illumina bisulfite sequencing (Supplementary Table 1, 2). We then sequenced these samples to generate training data with an average of 1,300X coverage. We plotted the difference in mean current for all 6-mers containing a methylated motif (Extended Data 1a) and found that the deviation is the highest when the methylation occurs on the fifth position along a 6-mer.
To benchmark the dual methylation detection, we tested the model on genomic DNA (gDNA) from the GM12878 human lymphoblast cell line, generating control samples with the same PCR and methyltransferase treatment as the E. Coli samples(Supplementary Table 1). After nanopore sequencing, we first confirmed that full methylation does not decrease mappability of the reads in nanopore sequencing (Supplementary Table 2). We tested the performance of nanopolish with our trained four state model on these test samples and found high areas under the curve (AUC) for both CpG and GpC calls across a range of LLR thresholds (0.91 for CpG and 0.98 for GpC) (Figure 1a). We selected LLR cutoffs of −1.5/1.5 for CpG and −1/1 for GpC methylation, resulting in correct identification of 91% of CpG calls at the 72% of CpGs that pass the threshold and 96% of GpCs calls correctly identified at the 93% that pass the threshold (Extended Data 1b, Supplementary Table 3). This is a conservative estimate of our accuracy because these metrics were calculated with the assumption that the methylated input was 100% methylated, whereas the bisulfite sequencing data indicated incomplete (~96–98%) enzymatic methylation in this testing set. Ambiguously called k-mers were not enriched for any specific sequence (Supplementary Figure 1b,c) beyond the GCG motif, which is excluded from our analysis. Genome context analysis confirmed that neither the fraction of sites called nor the fraction of accurate calls was dependent on the genomic context (Supplementary Table 4).
Figure 1. Overview and assessment of nanoNOMe.
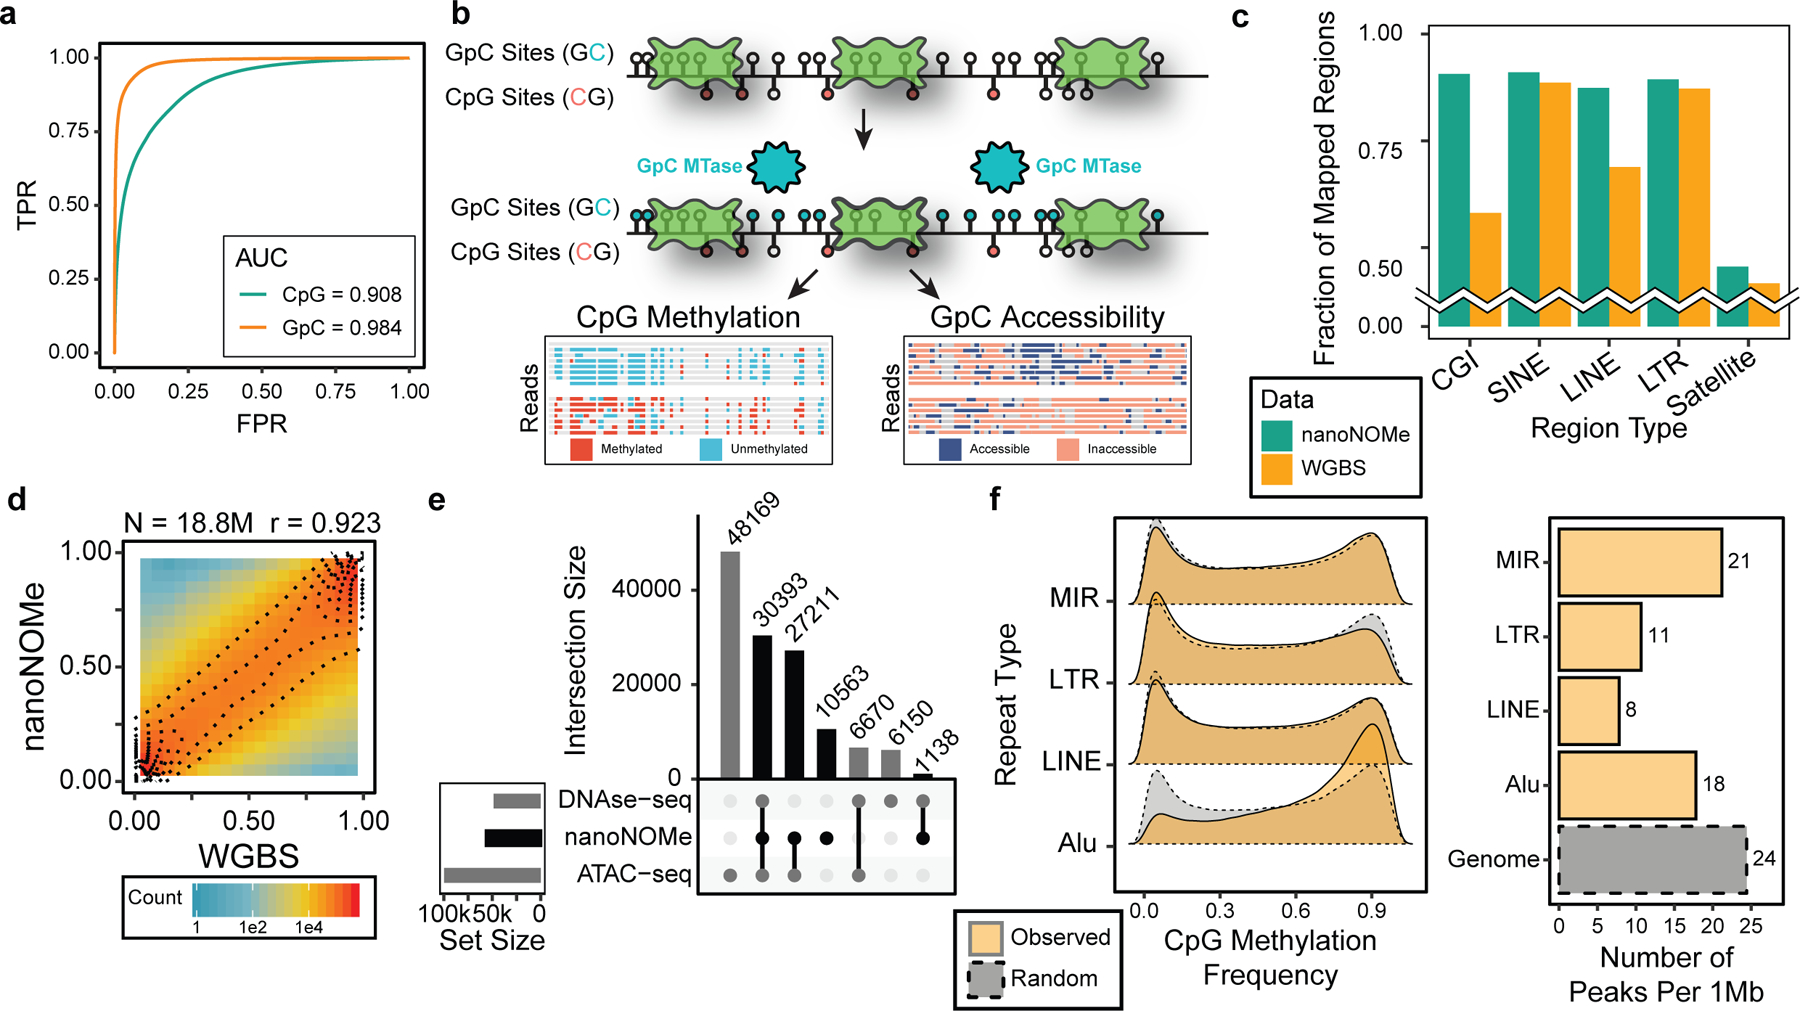
(a) ROC curve of methylation calling for a range of LLR thresholds on control samples (GM12878 genomic DNA modified with CpG and GpC methylation). (b) A schematic of exogenous labeling: intact nuclei are methylated at GpC motifs to serve as the mark for accessibility, and CpG methylation and GpC accessibility can be simultaneously measured. (c) Comparison of fraction of low sequence complexity regions between WGBS and nanoNOMe that had robust read coverage (coverage between 5th and 95th percentile of genome coverage). (d,e) Validation of NanoNOMe profiles by (d) pair-wise comparison of per-CpG average methylation from nanoNOMe with WGBS in across the genome, and (e) intersections of accessibility peaks from nanoNOMe, DNAse-seq, and ATAC-seq. (f) (Left) Distribution of observed per-CpG site methylation frequency in repetitive elements in comparison to random regions across the genome of the same lengths and (right) number of accessibility peaks per 1Mb of repetitive regions in comparison to the entire genome
Chromatin and DNA methylation profiling with NanoNOMe
With the 4-state model in hand, we then adapted NOMe-seq3 to nanopore sequencing, exogenously labeling open chromatin with GpC methylation(Figure 1b). Methylation at cytosines in GCH and HCG contexts were used as measures of chromatin accessibility and endogenous methylation, respectively. We excluded both CpG and GpC methylation data from GCG contexts, representing 5.6% of GpCs and 24.2% of CpGs,because of the ambiguity of native methylation or chromatin state informing these locations.3. In describing GpCs state, a methylated GpC was interpreted as an accessible mark, and unmethylated as inaccessible.
First, we performed nanoNOMe on GM12878 generating 250 Gb (103X coverage) of mapped sequencing data from 15 flowcells (12 minION and 3 PromethION), with an N50 read length of 14,000 bp. (Table 1, Supplementary Table 5). We compared genomic coverage of the resulting nanoNOMe data to WGBS from a previous study (100X coverage, ENCODE accession ENCSR890UQO)13 and whole-genome nanopore sequencing of GM12878 (36X coverage, ENA accession code PRJEB23027)14. We found that the ENCODE WGBS had a GC bias, while nanoNOMe and nanopore WGS coverage were not biased by GC content (Supplementary Figure 2)15,16.
Table 1. Sequencing statistics of nanoNOMe sequencing data.
NanoNOMe was performed on four cell lines using multiple runs of MinION, GridION, or PromethION sequencing and pooled to generate one data set per cell line.
| Cell | Number of flowcells | Number of raw reads (M) | Total raw bases (Gb) | Aligned reads (M) | Aligned bases (Gb) | Average Coverage | N50 length |
|---|---|---|---|---|---|---|---|
| GM12878 | 12 + 3 Plon* | 32.0 | 298.3 | 26.4 | 256.9 | 103 | 14,020 |
| MCF-10A | 9 | 9.4 | 81.6 | 7.7 | 72.4 | 27 | 11,501 |
| MCF-7 | 11 | 9.0 | 76.8 | 7.5 | 69.1 | 26 | 13,025 |
| MDA-MB-231 | 9 | 8.0 | 82.4 | 7.0 | 74.9 | 28 | 13,507 |
PromethION flowcell (all other were MinION)
We then examined regions that are poorly mappable via short reads. We focused on regions of low mappability in WGBS, determined as loci that had 10 or more reads with mapping quality (MAPQ) less than 5. These regions covered 132 Mb of the human genome (~4.5%), consisting of 57,982 distinct regions with an average size of 2.3 kb. The coverage of high quality reads (MAPQ > 20) for nanoNOMe was between the 5th and 95th percentile of genome coverage (67X-116X) for 44% of these regions with a median coverage of 114X. In contrast, only 7% of these regions are between the 5th and 95th percentile of coverage in WGBS (23X-168X), with an abnormally high median coverage of 582X compared to the overall median coverage of 100X. We also examined repetitive elements, which are known to be difficult to map with short-read sequencing, and CpG islands, which are often affected by dropouts due to their high GC content (Supplementary Figure 2). We observed that nanoNOMe maps to higher fractions of robustly mapped regions than WGBS, especially LINE and CGI(Figure 1c). Long read sequencing, and specifically nanoNOMe, does not suffer from mismapping of reads to poorly mappable regions, enhancing our ability to interrogate these sites.
We next assessed the performance of nanoNOMe in simultaneously resolving endogenous cytosine methylation and chromatin accessibility. First, we confirmed that CpG methylation measured from nanoNOMe correlates well with WGBS methylation signal (Pearson correlation of 0.92) (Figure 1d). We called accessibility peaks based on the frequency of GpC methylation (see Methods), and found that out of the 69,305 peaks, 58,742 overlapped with peaks called by ATAC-seq and/or DNAse-seq (Figure 1e, Supplementary Data 1). We then used nanoNOMe to footprint nucleosome positioning by generating metaplots at various genomic contexts. As in Kelly et al.3, we used computationally predicted CTCF binding motifs (from CTCFBSDB 2.0)17 that were >2kb away from transcription start sites (TSS) and supported by CTCF ChIP-seq in GM12878, resulting in 6,793 sites (Supplementary Data 2)13. The methylation and DNA accessibility agreed with gold standard methods (WGBS and MNase-seq, respectively) from previous studies (Extended Data 2, ENCODE accession ENCSR890UQO and ENCSR000CXP)13.
To correlate these observations with other epigenetic modifications we generated metaplots at TSSs with euchromatic (H3K4me3) and heterochromatic (H3K27me3) histone modifications using existing ChIP-seq data on GM12878 (Supplementary Figure 3, ENCODE accessions ENCSR057BWO and ENCSR000AKD)13. As expected, CpG methylation decreased and GpC accessibility increased at the TSS in promoters with active H3K4me3 marks, in contrast to the high CpG methylation and low accessibility at promoters with repressive H3K27me3 marks. To correlate these epigenetic changes with the transcriptome, we separated the genes by expression quartiles and measured the promoter epigenetic signature, observing this same concordant decrease in CpG methylation and an increase in GpC accessibility at promoters with increasing expression level (Supplementary Figure 4, Extended Data 3 ENCODE accession ENCSR843RJV)13.
We then characterized epigenetics of annotated repetitive elements in GM12878 using the CpG methylation and accessibility profiles, specifically in LINE, LTR, Alu, and MIR, which are the four most abundantly annotated repetitive elements (Figure 1f). On comparing average methylation distributions of these repetitive regions to randomly shuffled regions, excluding those that overlap with the repetitive elements, we observed that only Alu elements exhibit an increase in methylation. Accessibility peaks were depleted in all repetitive elements, especially in LINE and LTR regions, indicating that repetitive elements have decreased accessibility across the genome in GM12878.
NanoNOMe reveals epigenetic patterns with single-read resolution
Previous studies have demonstrated that nucleosome positioning and DNA accessibility are heterogeneous even within a homogeneous cell population5,18,19, highlighting the importance of probing these features on individual copies of the DNA. However, single-read analysis of nanoNOMe’s GpC accessibility is difficult because of the variation in enzymatic efficiency of the M. CviPI GpC methyltransferase, and noise associated with single molecule measurements. In the control test set, we examined the patterns of incorrect accessibility calls and found that 75% of incorrect calls were singular events, surrounded by correct calls. To remove the isolated noise, we estimated the accessibility of a given site using information from nearby GpC motifs on the same molecule, dampening the isolated erroneous signal (See Methods). Briefly, we applied a Gaussian kernel regression on the LLRs of accessibility calls using fixed genomic coordinate bandwidths and estimated accessibility across individual reads. We smoothed the GM12878 nanoNOMe data at CTCF binding sites and verified that it reduces the frequency of artifactual spikes in accessibility, while retaining the ability to footprint nucleosome positioning (Extended Data 4).
We proceeded to characterize patterns of accessibility and methylation at CTCF binding sites on individual reads. First, we selected reads that span 2kb regions centered on the 6,793 CTCF-binding sites17 with a ChIP-seq peak13 and the 4,247 binding sites without a ChIP-seq peak and examined runs of accessible and inaccessible calls using run-length encoding methods (Figure 2a, Extended Data 5a). We found the length of inaccessible runs correspond to the units of nucleosomes, shown by hotspots of inaccessible runs at 128 bp (mononucleosomes) and 310bp (dinucleosomes). Examining the length of the inaccessible runs at the center of CTCF binding sites, we found a higher occurrence of shorter runs (<80bp), subsequently termed sub-nucleosomal footprints, suggesting CTCF binding (Extended Data 5b,c). This short length of inaccessibility by regulatory protein binding is consistent with previous findings of protein-DNA interactions via DNAse hypersensitivity and X-ray crystallography20–22. We investigated if the number of GpC sites available proximal to the CTCF binding site affected our ability to observe this pattern, and found that as few as 3 GCH reproduce the expected pattern (Supplementary Figure 5). For subsequent analyses, we only considered regions with four or more GpC motifs to predict sub-nucleosomal footprints.
Figure 2. DNA accessibility assessment on transcription start sites and CTCF binding sites using individual reads.
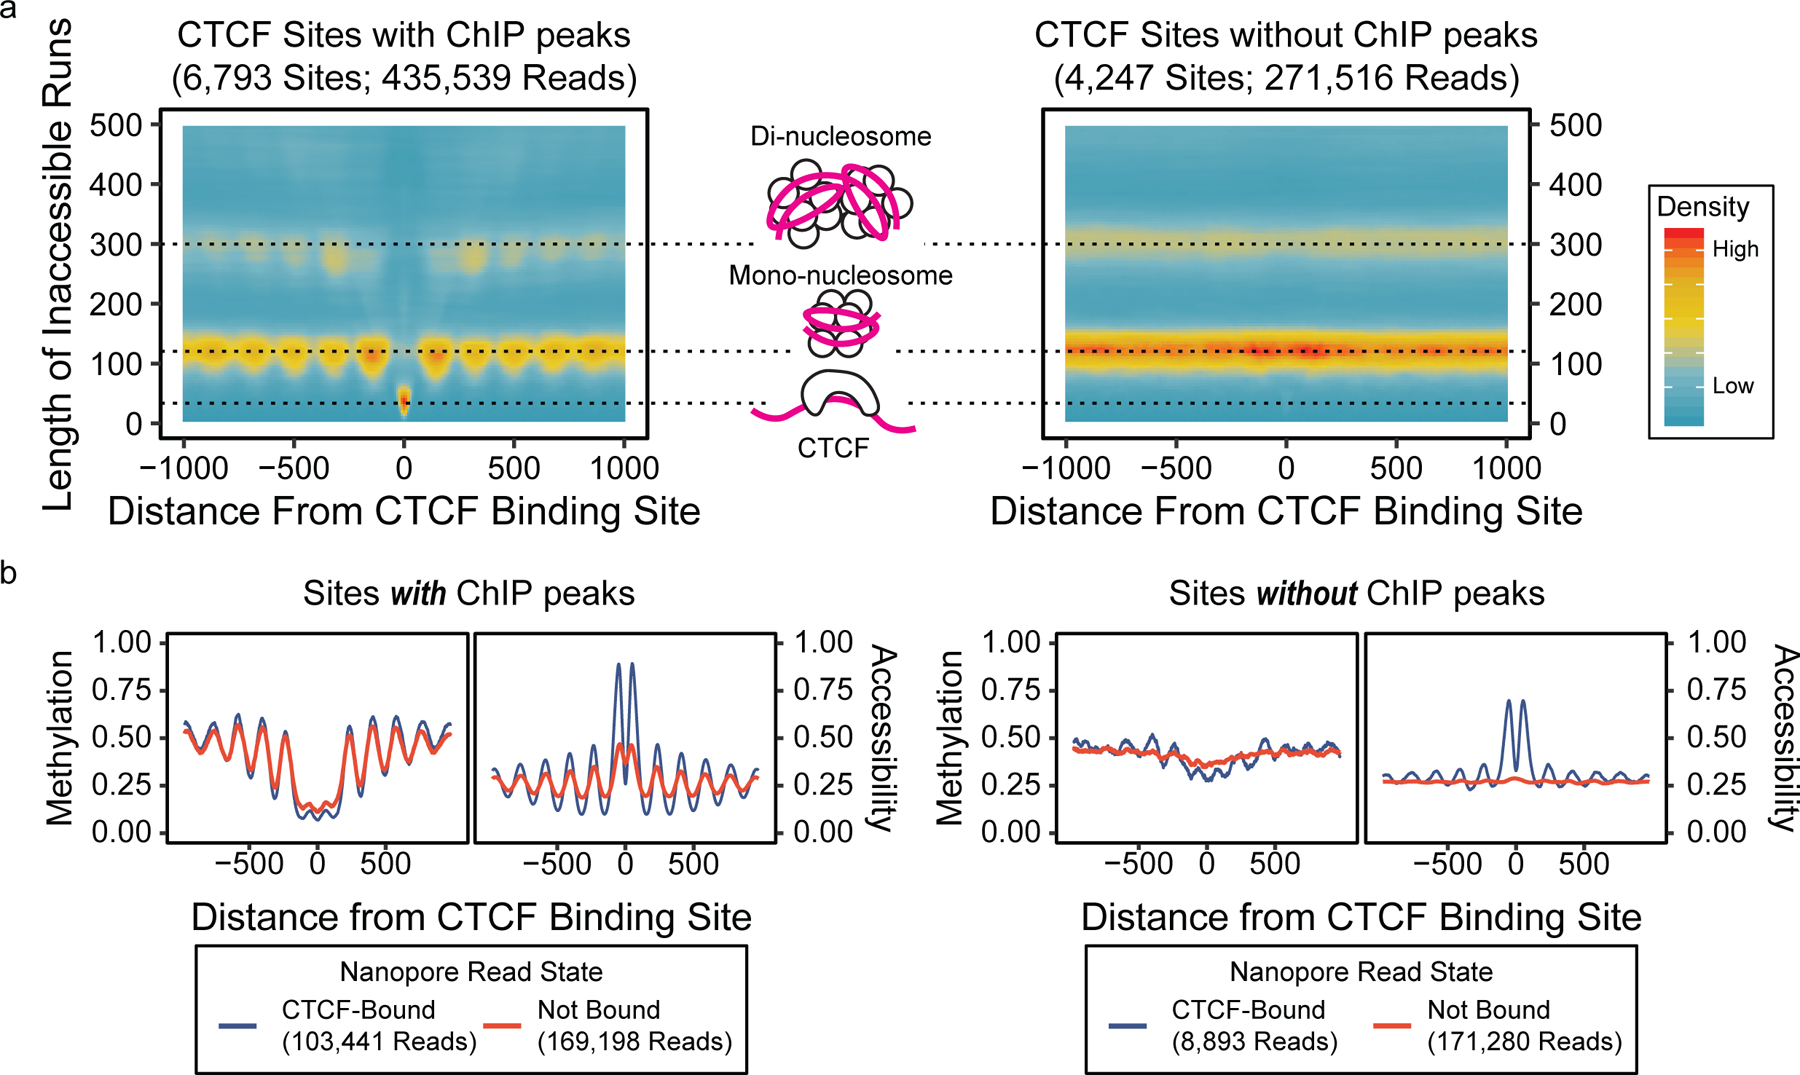
(a) Heatmaps of lengths of inaccessible runs on individual reads versus distance from CTCF binding sites, showing the relationship between inaccessible run lengths and protein or nucleosome footprints. (b) Metaplots at CTCF binding sites, separated by the presence of CTCF ChIP-seq peaks by panel and read-level CTCF binding by color.
We classified CTCF bound reads as inferred by the presence of a sub-nucleosomal footprint at a CTCF binding site (Extended Data 6). Because nanoNOMe does not rely on enrichment or PCR to detect accessibility, the fraction of CTCF-bound reads represents a quantitative estimate of CTCF binding. We found a moderate correlation (r=0.50) between nanoNOMe CTCF binding fraction and CTCF ChIP-seq signal (Extended Data 7a). The median bound fraction of nanoNOMe reads at ChIP-seq peaks (0.25) was much higher than the median fraction at locations with no ChIP-seq peak (0.03) (Extended Data 7b). We stratified the reads based on their nanoNOMe-inferred CTCF-binding states and the presence of ChIP-seq peaks at the motif(Figure 2b). We found that reads at sites with ChIP-seq peaks have consistently lower methylation and well positioned nucleosomes even on molecules that were not classified as bound by nanoNOMe. At locations without a ChIP-seq peak that are not bound according to nanoNOMe, we do not see regular nucleosome positioning, agreeing with the literature23. Our data does find a small number of reads (2%; 8,893/452,812 reads) indicating bound CTCF and organized nucleosomes by nanoNOMe at sites without ChIP-seq peaks. We attribute the lack of a clear peak at these sites to the low CTCF occupancy, as most sites without peaks have low fractions of bound reads (Extended Data 7b).
On the TSS of highly transcribed genes, we observed the expected pattern of well-organized nucleosome positioning and longer accessible runs representing nucleosome depleted regions (NDRs, Figure 3a)5. With decreasing expression, CpG methylation increased and accessibility decreased around TSS (1kb for CpG and 200 bp for GpC) on a single-read level(Supplementary Figure 6a). As in sub-nucleosomal footprint detection, we examined the effect of the number of GpC sites in the TSS window on the ability to distinguish reads with open vs closed promoters. As observed with previous studies24, accessibility signal at TSSs is confounded by GC content because promoter GC content affects the gene’s activity (Supplementary Figure 7). Therefore, we used genes that have > 13 GpC sites (20th percentile) within 200 bps of TSS. We used the methylation and accessibility around the TSS to categorize reads into two groups (high and low frequency) for each feature (Supplementary Figure 6c, see Methods). Mean CpG methylation for the two groups was 3% (unmethylated) and 62% (methylated), and GpC groups had mean accessibilities of 20% (inaccessible) and 90% (accessible). Combining the two features resulted in four possible combinatorial epigenetic signatures for each read (Figure 3b). We observed that with increasing expression, fractions of concordantly active reads (low CpG methylation and high accessibility) increase and concordantly inactive (high CpG methylation and low accessibility) reads decrease (Supplementary Figure 8a, Supplementary Table 6). We also found that genes with euchromatic H3K4me3 histone modification within 1kb of the TSS have low CpG methylation, and genes with heterochromatic H3K27me3 modification mostly have inaccessible reads (Supplementary Figure 8b, Supplementary Table 7). Further, the majority of reads on promoter regions with bivalent histone modifications (both H3K4me3 and H3K27me3) have both low CpG methylation and low accessibility, combining the pattern of CpG methylation with H3K4me3 and that of accessibility with H3K27me3.
Figure 3. Single-read epigenetic analysis on gene promoters.
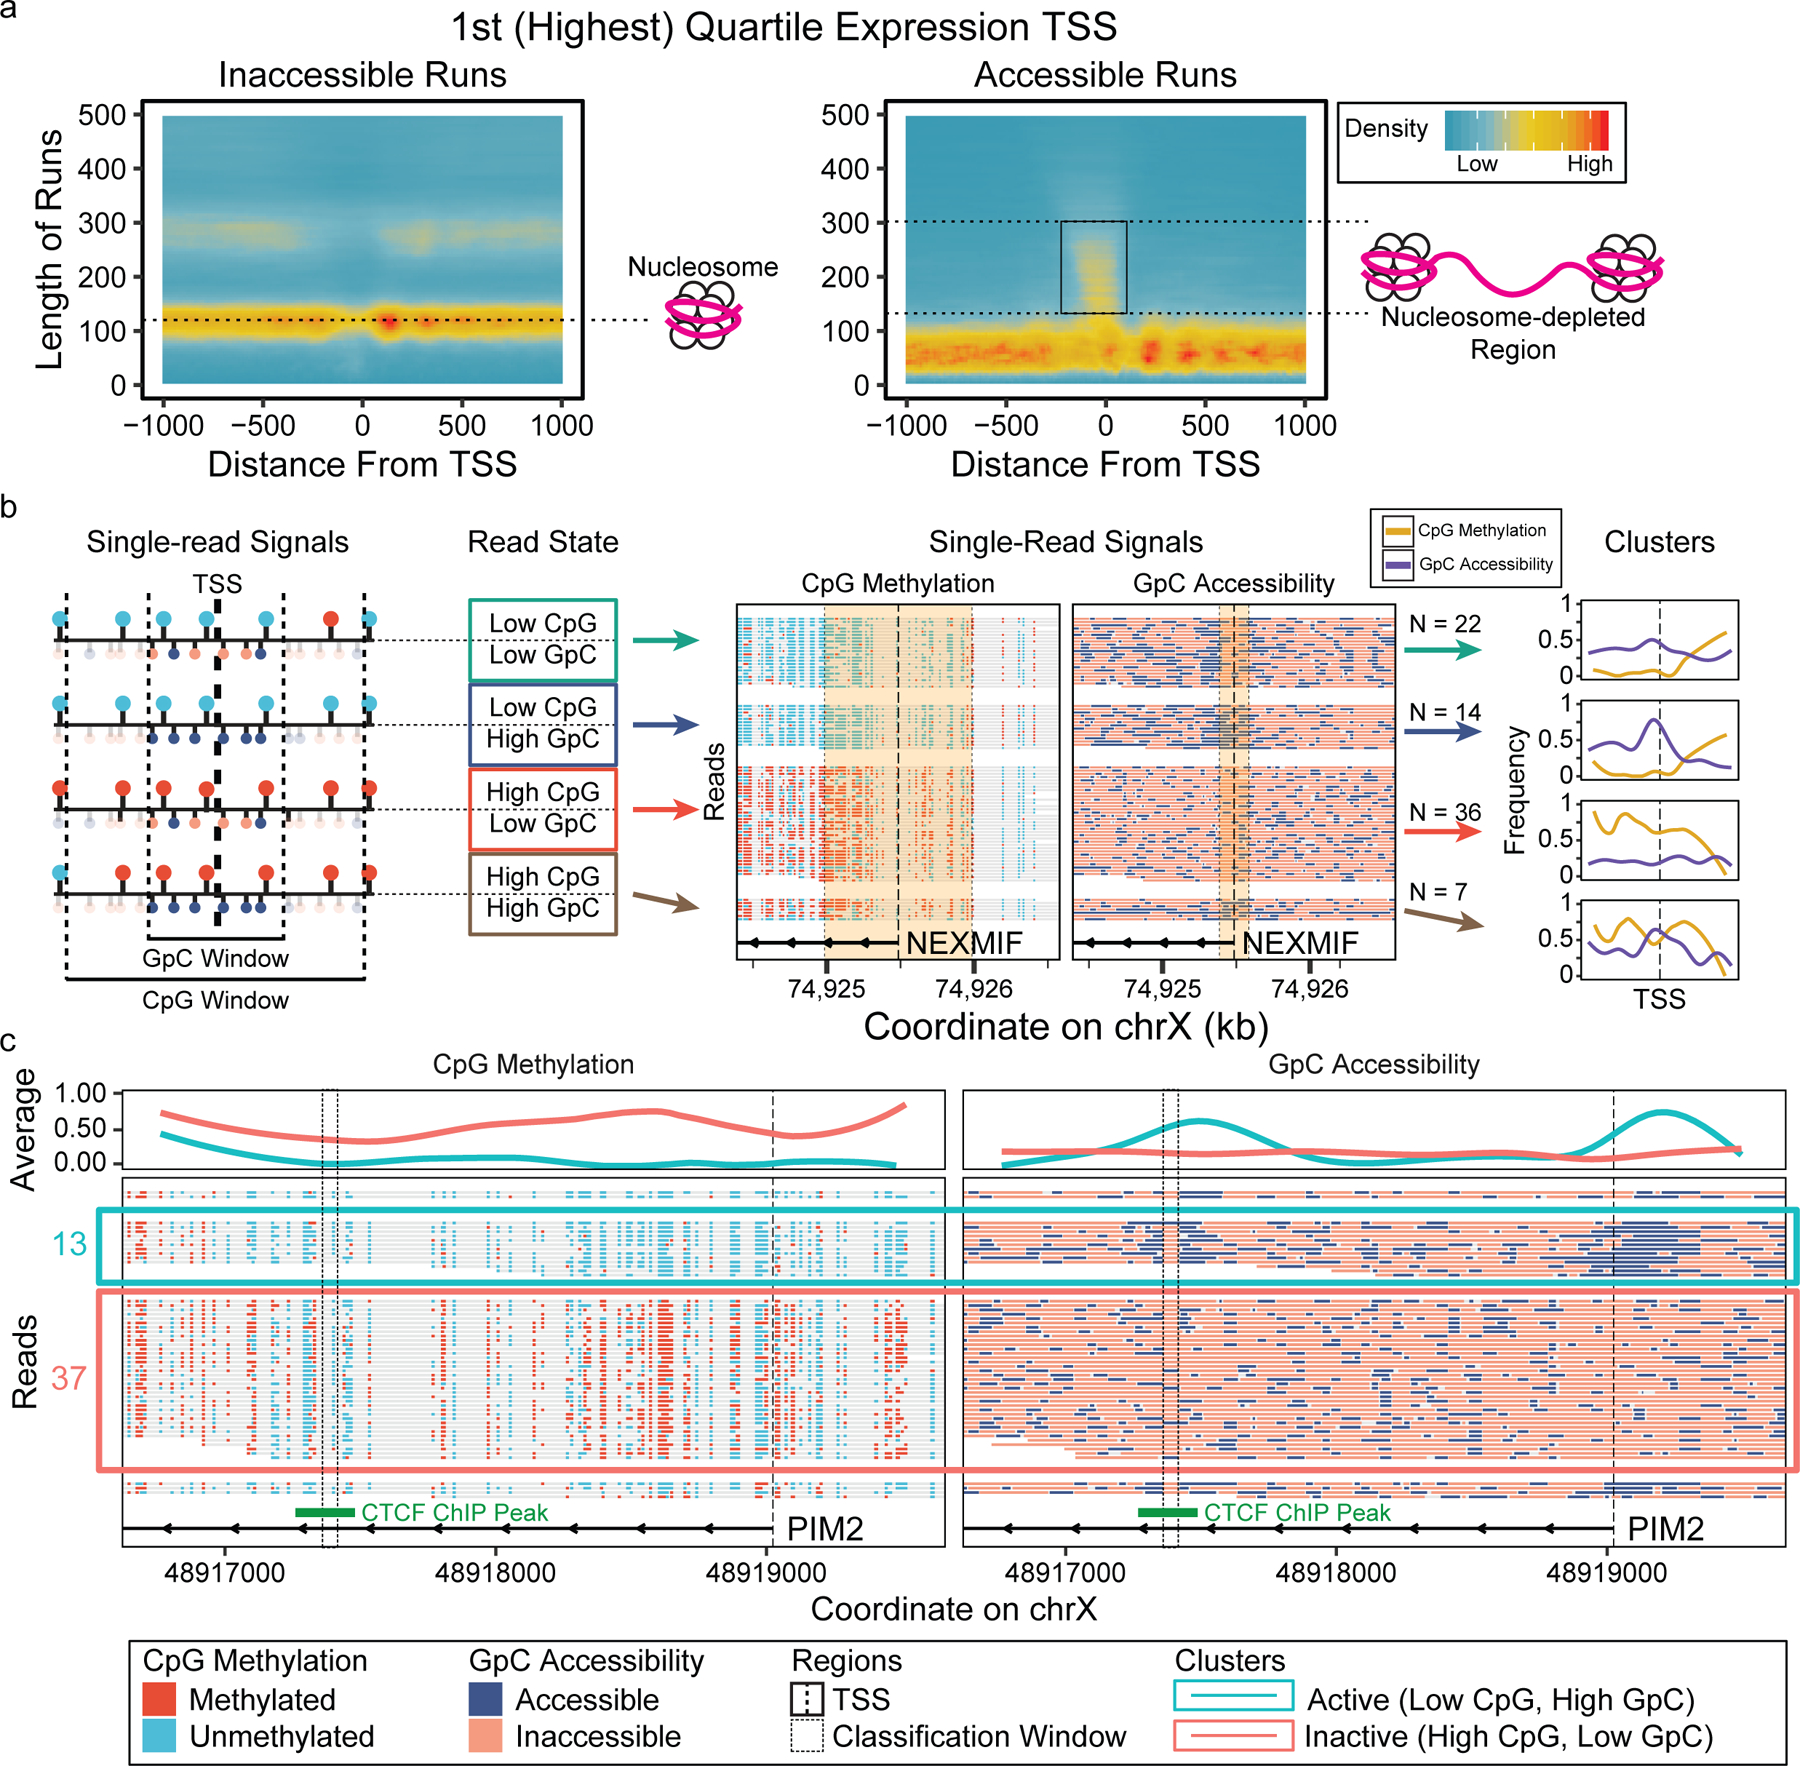
(a) Heatmaps of lengths of inaccessible and accessible runs on individual reads versus distance from transcription start sites of highly expressed genes, showing nucleosome positioning and nucleosome depleted regions. (b) Reads on TSS can be classified based on the combinatorial epigenetic signatures near TSS and clustered based on these classifications. (c) Read-level plots of methylation and accessibility on TSS of PIM2, showing TF(CTCF) binding 1.5kb downstream of the gene only in concordantly active reads.
Using the same subset of genes from the single-read promoter analysis, we examined sub-nucleosomal footprints within 10kb of the TSS. We selected regions that have multiple sub-nucleosomal footprints as candidate protein binding sites (>= 10 overlapping and <80bp inaccessible runs) (Supplementary Data 3) and performed motif enrichment analysis25,26. Several TFs were enriched in the candidate regions, including CTCF, NRF1, and ZF proteins, with the strongest enrichment in CTCF binding sites having a 4x observed/expected ratio. We stratified these reads based on promoter epigenetic signature and calculated the fraction of reads with a sub-nucleosomal footprint (Supplementary Data 4). In general, reads which had an accessible promoter had a higher fraction of sub-nucleosomal footprint reads than inaccessible reads, showing that our analysis captures protein binding events that are associated with active promoter state (Supplementary Figure 9). For a specific example, we examined PIM2, a gene that facilitates cell survival and proliferation and is highly expressed in GM12878. PIM2 has a sub-nucleosomal footprint 1.5kb downstream of the TSS present only in the reads with an epigenetically active promoter (Figure 3c). We identified a CTCF binding motif in this region with a peak in existing CTCF ChIP-seq data. This directly links CTCF binding on the same molecule as an accessible promoter 1.5kb away.
NanoNOMe identifies allele-specific epigenetic states across the genome
Because nanopore sequencing generates long reads, each read has a greater chance of encountering one or more heterozygous SNPs which can be used to phase the reads into maternal or paternal origin27. Using existing variant data on GM12878 and both parents28, we selected heterozygous SNPs and assigned haplotype origin to individual nanoNOMe reads. We were able to confidently determine haplotype assignments on 65% of our sequencing reads; the phased reads covered 86% of the genome to at least 10x coverage on both alleles(Extended Data 8). For the first time, we have generated genome-wide allele-specific profiles of DNA methylation and accessibility on a human genome, using a single assay. We compared methylation and accessibility near TSSs of autosomal genes, X-chromosome inactivated (XCI) genes, and X-chromosome genes that are known to escape XCI (hereafter referred to as escape genes)29 using metaplots (Figure 4a). Genes on the active X chromosome (Xa; maternal allele) were concordantly active with demethylated and accessible promoters and those of inactive X chromosome (Xi; paternal allele) were concordantly inactive with methylated and inaccessible promoters, whereas in autosomal genes and escape genes the two alleles had no significant difference in aggregate (Extended Data 9).
Figure 4. Allele-specific methylation and accessibility in GM12878.
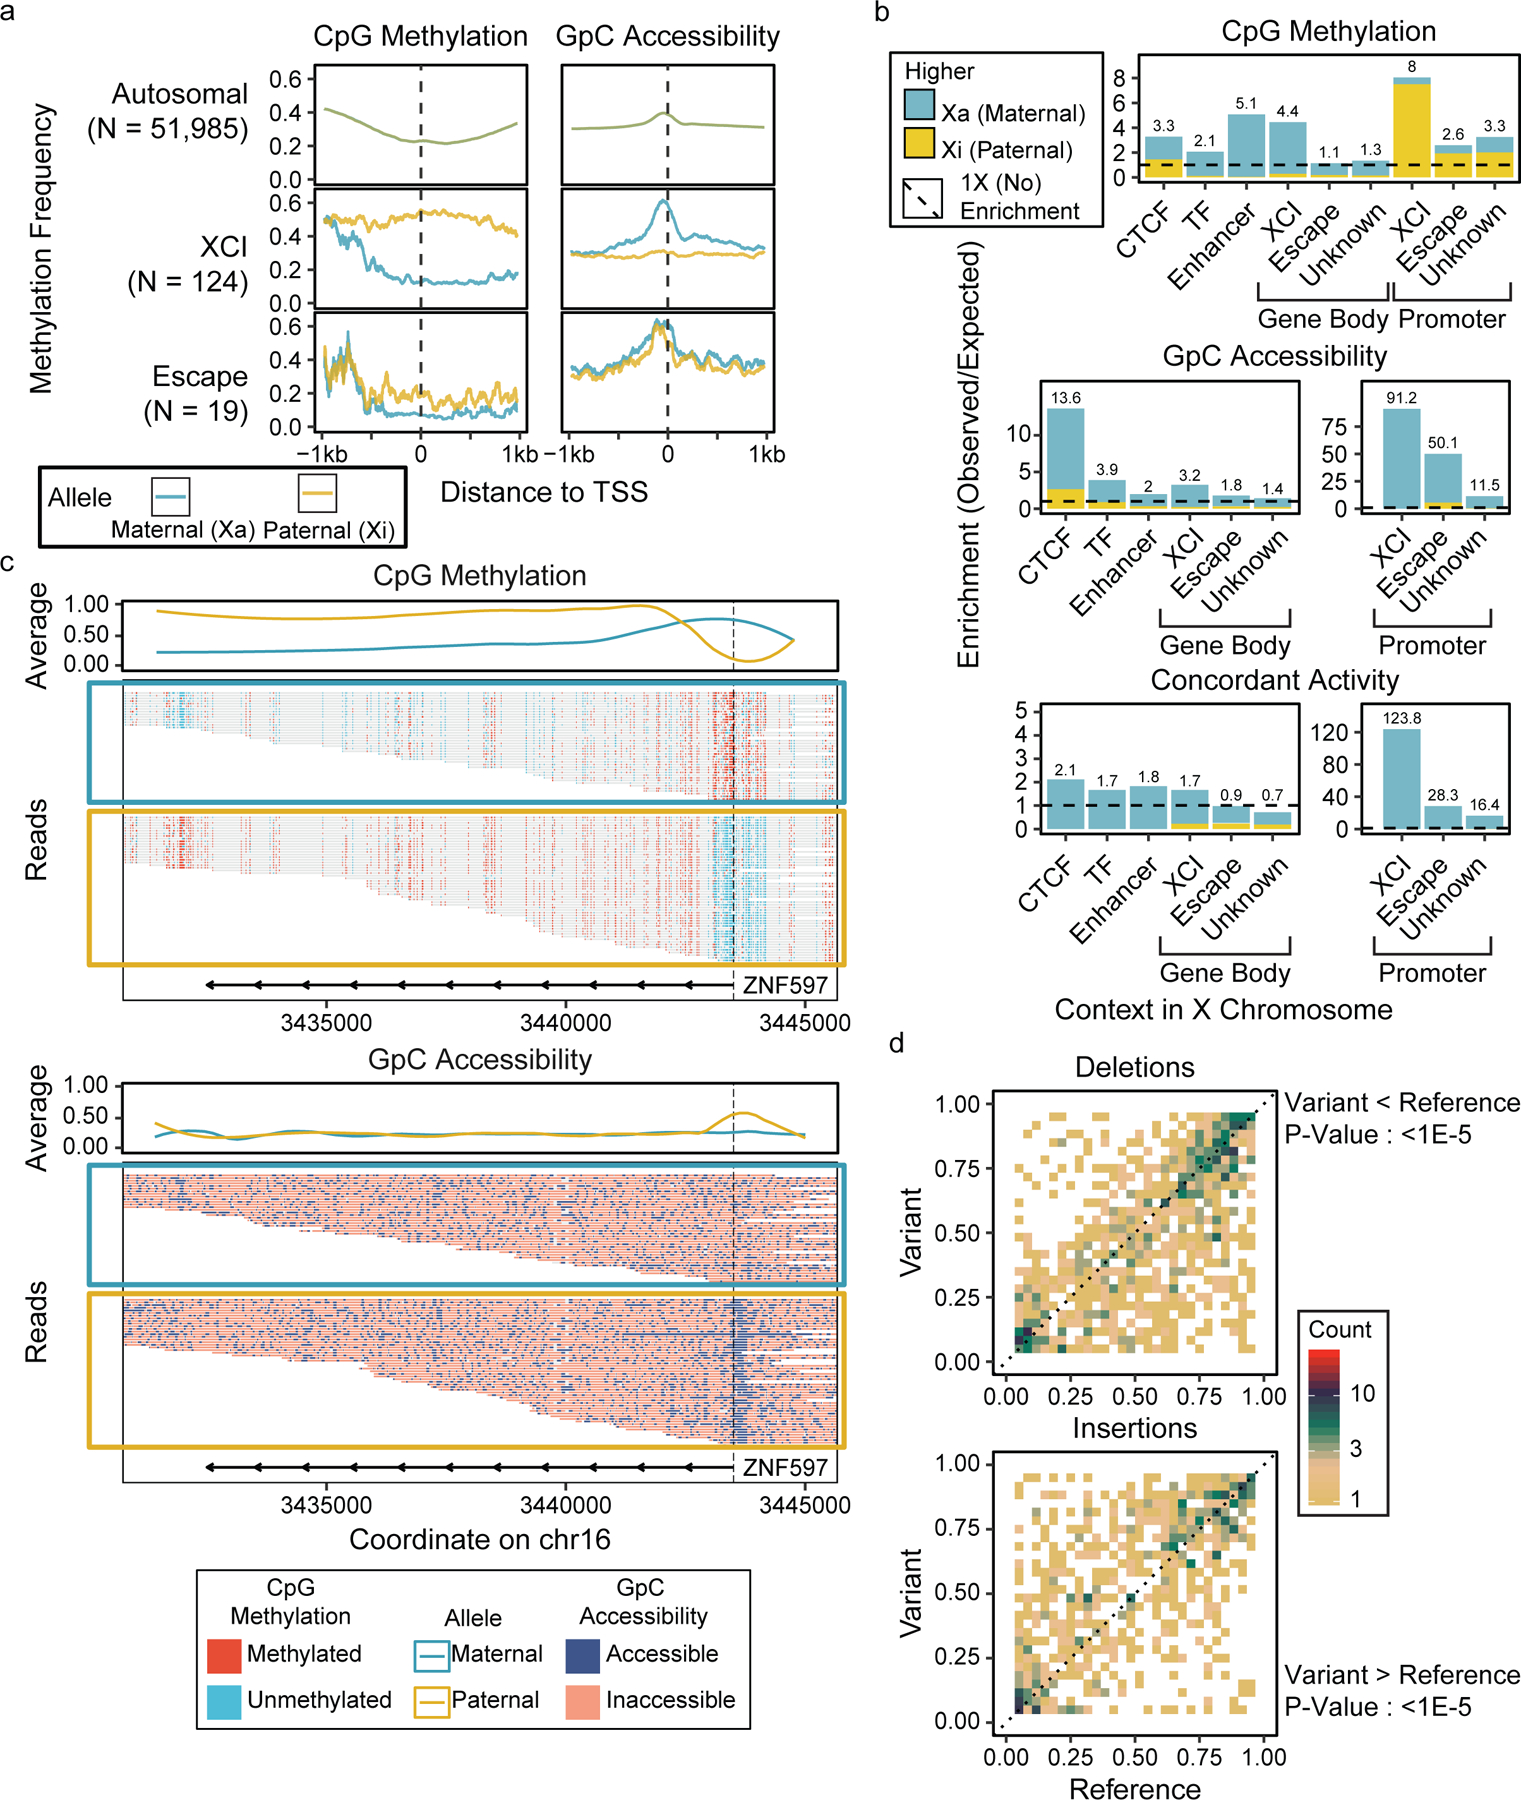
Methylation and accessibility were separated by parent of origin, and (a) metaplots of TSS methylation and accessibility were generated for each allele (b) Enrichments of DMRs and DARs were calculated at various genomic contexts, showing the enrichment of allele-specific epigenetic patterns in promoters and regulatory elements (Supplementary Table 8). (c) Read-level methylation and accessibility plots of ZNF597, an imprinted gene with allele-specific epigenetic patterns. (d) Pair-wise comparison of CpG methylation in 1kb regions around heterozygous SV breakpoints between alleles with the SV and alleles without the SV, with significance testing by one-direction Wilcoxon rank-sum tests (Del : 1.3e-6, Ins : 2.0e-5).
We then found regions that have a significant difference in methylation or accessibility between paternal and maternal alleles, resulting in 9,997 differentially methylated regions (DMRs) and 10,414 differentially accessible regions (DARs) across the genome (Extended Data 10a, Supplementary Data 5). ATAC-seq is only able to measure allele-specific accessibility at a few of these regions (N = 321, 3 % of all DARs), but these did correlate strongly with the nanoNOMe accessibility differences (r=0.76) (Extended Data 10b). While overlaps between DMRs and DARs were not common (629 overlaps, 6%), they were highly concordant(606/629), i.e. increase in methylation with decrease in accessibility and vice versa (Supplementary Figure 10). In the X chromosome, we observed a disproportionate number of hypermethylated Xa DMRs (4564 hyper- vs 401 hypo-), agreeing with previous findings of Xa hypermethylation (Supplementary Figure 10c)30. Further, the majority (N=1050; 80%) of DARs had higher accessibility in Xa. We then calculated enrichment of DMRs, DARs and concordant differential regions in different genomic contexts (Figure 4b, Supplementary Table 8). The enrichment of DMRs with higher Xi methylation near TSS (+/− 500 bps) and the high number of DMRs in gene bodies with hypermethylated Xa agreed with previous findings (Supplementary Figure 11a, Supplementary Table 8)30,31. However, we found that the high number of DMRs in gene bodies was due to their larger size, and hypermethylated Xa DMRs were enriched in enhancers. DARs mostly had higher accessibility in Xa, and this pattern was consistent in all assessed genomic contexts. DARs were enriched in CTCF binding sites in addition to promoters, suggesting that the higher accessibility, and consequently increased affinity for CTCF binding, work in concert to prevent XCI in Xa. Concordant regions with both a DAR and DMR were heavily enriched near TSSs and 90% of them indicated higher activity in Xa(307 out of 339). In autosomes, DMRs, DAR, and concordant differential regions all occurred mostly in gene bodies and around TSS, with the highest enrichments around TSSs (Supplementary Figure 11b,c, Supplementary Table 9).
We then identified genes that had a DMR or a DAR within 500 bp of the TSS (Supplementary Data 6). 76% (187) of the concordantly differential TSS were in the X chromosome and all of these indicated activity in Xa except XIST associated TSSs, a gene known to be specifically active in Xi to promote inactivation of Xi. Out of the 56 autosomal genes, 8 were previously identified imprinted genes32,33. We plotted ZNF597, one of the 8 known imprinted genes, as an example; it had a hypermethylated and less accessible promoter in the maternal copy, indicating that it is active in the paternal allele (Figure 4c). The ZNF597 gene body exhibited the opposite pattern of methylation, with the active paternal copy fully methylated.
Our long nanopore reads also allow detection of structural variants, large insertions, deletions, or transpositions hard to detect with conventional short-read sequencing. We characterized epigenetic consequences of these SVs by comparing epigenetic signals in heterozygous SVs, focusing on large deletions and insertions, the most commonly occurring SV types (Supplementary Data 7). After filtering for heterozygous SVs (Methods), we identified 1,195 deletions and 1,167 insertions, and compared methylation and accessibility near SV breakpoints between the variant and reference alleles (Figure 4d, Supplementary Figure 12). Though the majority of these SVs (80% of deletions and 82% of insertions) do not have a difference in methylation between the alleles, in those that do the variant allele tends to be hypomethylated in deletions (173 hypo vs. 65 hyper-) and hypermethylated in insertions (84 hypo vs. 131 hyper).
Comparative epigenomic analysis of breast cancer model
Finally, we applied nanoNOMe to measure epigenetic differences between three well-characterized breast cell lines: MCF-7 (luminal breast carcinoma, ER+/PR+/HER2-) and MDA-MB-231 (basal breast carcinoma, ER-/PR-/HER2-) as two subtypes of breast cancer, and MCF-10A (fibrocystic disease, ER-/PR-/HER2-) as the normal baseline34,35. We generated >20x whole genome coverage of nanoNOMe data per cell line (Table 1), and detected DMRs and DARs between normal and cancer cells (Supplementary Data 8). Both of the cancer subtypes had higher numbers of hypomethylated DMRs than hypermethylated DMRs (1.8-fold for MCF-7 and 7.6-fold for MDA-MB-231) suggesting global hypomethylation in the cancer subtypes (Supplementary Figure 13a,d). While more DARs were accessible in MCF-10A than in the cancer subtypes, the directions were not as skewed as in DMRs (Supplementary Figure 13b,d). Only a subset of DMRs and DARs coincided at the same genomic loci (8191 overlapping regions, 11% of DMRs and 6% of DARs), but coinciding DMRs and DARs were highly concordant (r = −0.96, −0.97, and −0.96)(Supplementary Figure 13c). Interestingly, more concordant regions indicated decreases of accessibility and increase in methylation in the cancer subtypes, especially in MCF-7 (2.6-fold, Supplementary Figure 13d). Differential epigenetic regions were enriched in regulatory regions such as transcription factor binding sites and gene promoter regions (1 kb +/− TSS), especially on CTCF binding sites (Supplementary Figure 14, Supplementary Data 9). We specifically inspected the epigenome at the TSS of ER, PR, and HER2 as upregulation of these receptors is correlated with cancer aggressiveness (Supplementary Figure 15–17). We observe a clear change in MCF-7 cells in methylation and accessibility at the PR TSS region and a more subtle change in the ER TSS region, as expected from the upregulation of these genes in that cell line36.
We also used our long reads to detect SVs and examine the epigenetic features flanking the SV breakpoints calling a total of 18,955 SVs across all three breast lines(Supplementary Table 10, Supplementary Data 10)37,38. The majority of the SVs were singletons (65.9%), with 1,805 SVs occurring in both of the cancer subtypes and not in MCF10A. While DMRs and DARs were not enriched in regions surrounding SVs (Supplementary Data 9), we did examine the epigenetic state of SVs that occurred only on one cell line(Supplementary Figure 18,19). Within cell lines, we investigated the epigenetic state at heterozygous SVs and found that it was largely the same between the reference allele and the mutated allele (Supplementary Figure 20,21). For example, we found an insertion on chr6:169,976,000 that occurred on both MCF-7 and MDA-MB-231 but not in MCF-10A, which also showed a region 1kb downstream of the insertion that was hypermethylated and less accessible. These changes in the SV-containing cancer subtypes show a regional correlation between the presence of an insertion and epigenetic alterations (Figure 5a).
Figure 5. Comparative epigenomic analysis of breast cancer model.
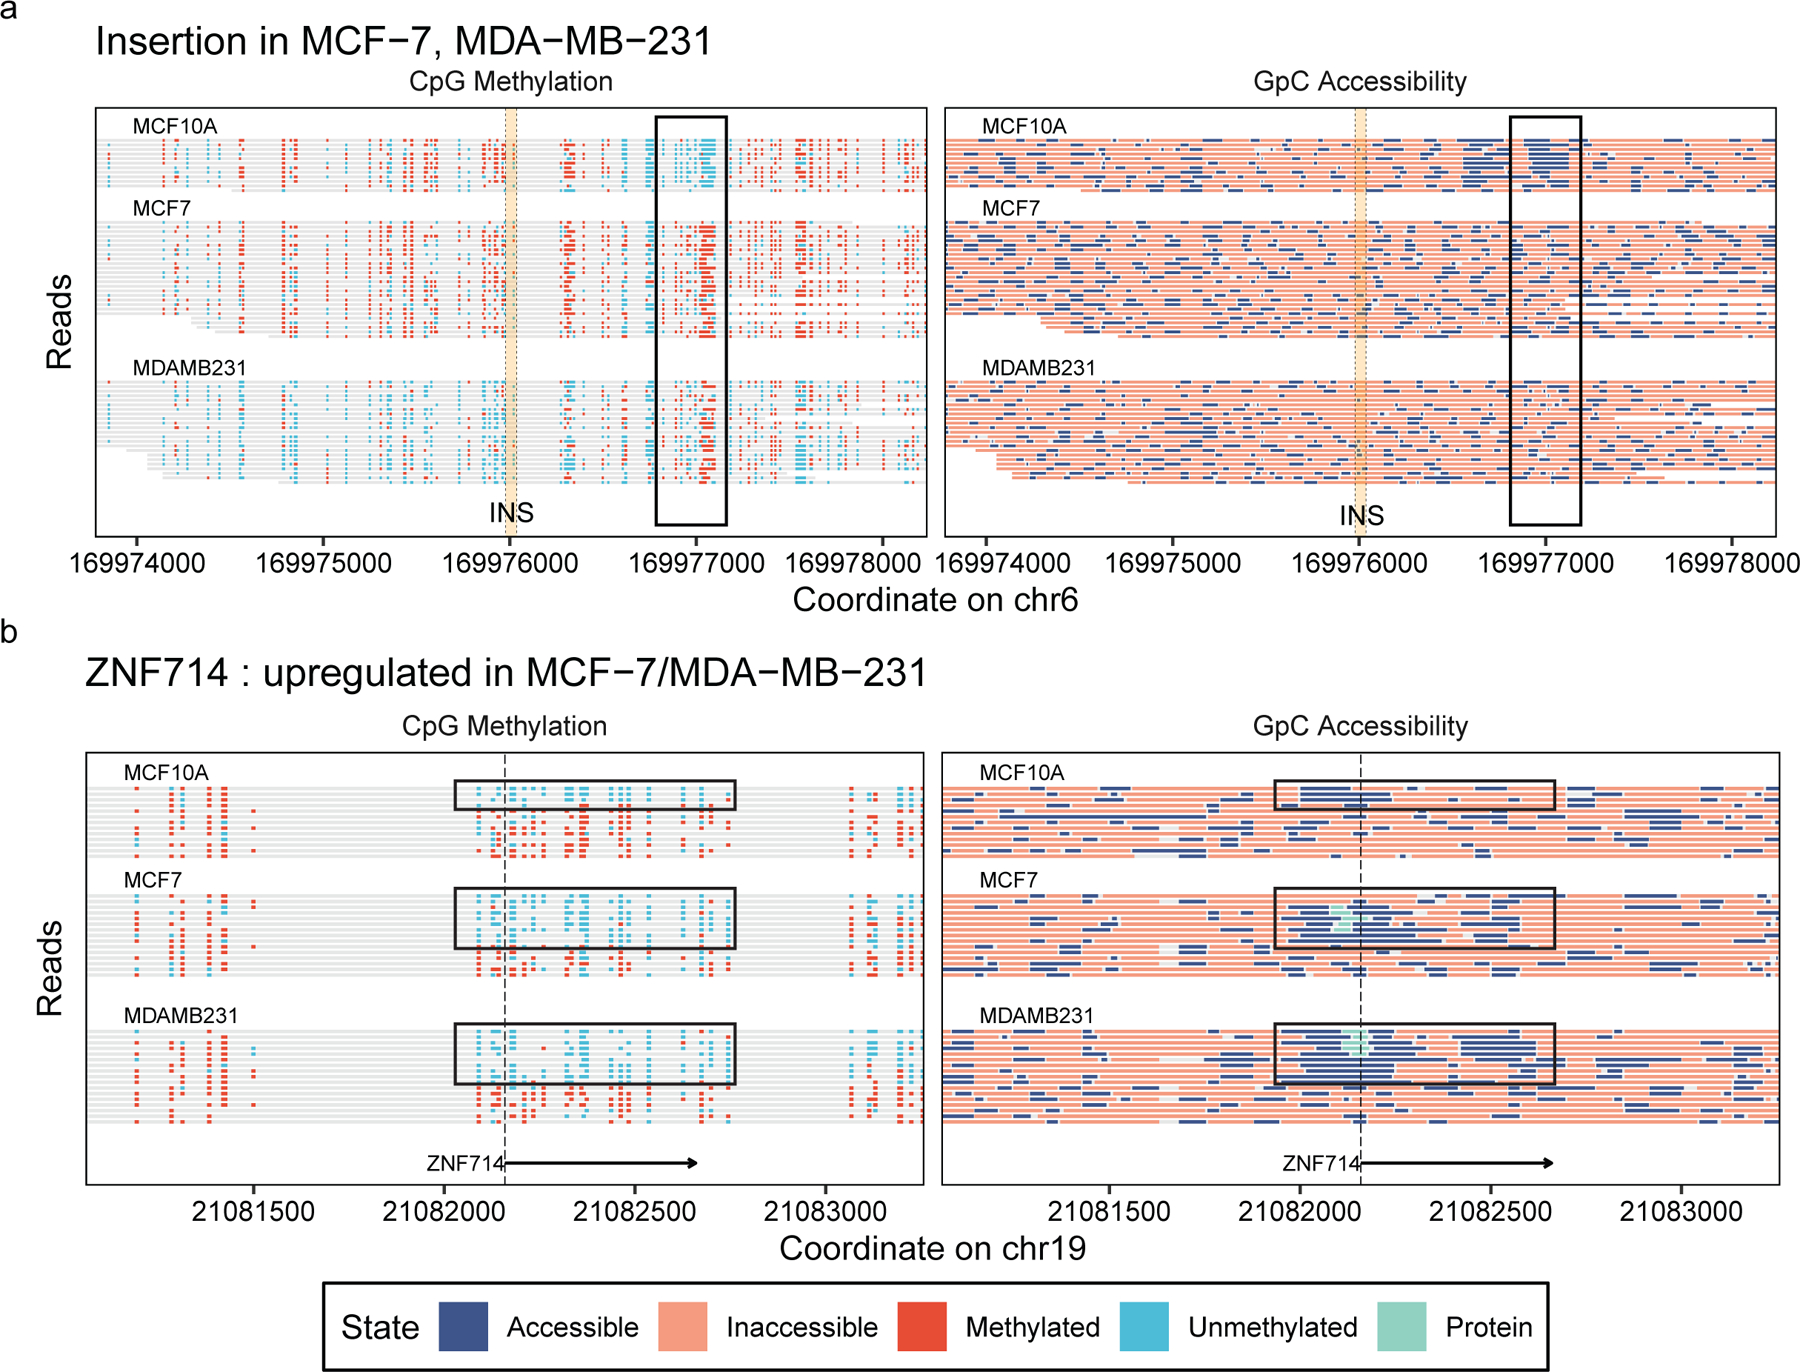
Read-level methylation and accessibility plots (a) near an insertion that is present in MCF-7 and MDA-MB-231 but not in MCF-10A, showing changes in methylation and accessibility downstream of the insertion, and (b) on the TSS of ZNF714 gene, which is upregulated in MCF-7 and MDA-MB-231 in comparison to MCF-10A, showing the differences in the estimated protein binding and combinatorial epigenetic signatures.
We then utilized our ability to estimate combinatorial epigenetic states and sub-nucleosomal footprints on individual reads proximal to genes which were differentially expressed between MCF-10A and MCF-7/MDA-MB-231 (Methods, Supplementary Data 11,12). One upregulated gene, ZNF714, has two groups of reads in its TSS for all three cell lines: active (unmethylated and accessible) and inactive (methylated and inaccessible) (Figure 5b). The two cancer subtypes have more of the reads in the active state, and have sub-nucleosomal footprints in the promoter, suggesting protein binding. We performed ChIP-qPCR for RNA Pol II Ser5P to see if this represented a transcriptional complex binding and found dramatic enrichment in MCF-7 and MDA-MB-231 as compared to MCF-10A (Supplementary Figure 22). These observations collectively suggest that the upregulation of ZNF714 occurs in conjunction with increased epigenetic activity and sub-nucleosomal footprints near the TSS.
DISCUSSION
We have leveraged single molecule nanopore sequencing to directly examine endogenous CpG methylation and chromatin accessibility on long fragments of DNA. Leveraging long reads, we measured epigenetic states at difficult to characterize genomic elements, e.g. repetitive elements. In fact, our method is currently limited by the incompleteness of the human genome reference, with large gaps persisting in highly repetitive areas. Long-read technologies have begun to resolve these gaps39, enabling nanoNOMe’s interrogation of repetitive regions e.g., centromeres. We can also detect structural variations (SVs) with long reads, difficult to detect with short-read sequencing, and examine the epigenome in and around these SVs.
Accessibility signals from long reads span multiple protein binding sites, generating footprints with lengths that allow us to infer the type of protein occupying the region. Using this approach coupled to known CTCF binding motifs, we have examined the relationship between CTCF binding and epigenetic patterns of nearby regions. Further, we have combined the ability to predict protein binding with combinatorial promoter epigenetic signatures. We can use these tools to identify differential epigenetic signatures and protein binding events between different breast cancer cell lines, providing a new window on cancer gene regulation.
Because of the greater chance for long reads to encounter a heterozygous SNV, we can phase our nanopore reads, generating fully phased methylation and accessibility profiles of a human genome. We explored the phased X chromosome to understand new features of the epigenetic profile of X-inactivation. With allele-specific data we can observe parent-of-origin epigenetic features, such as X chromosome inactivation and escape from inactivation, allele-specific activity of imprinted genes, and epigenetic differences near heterozygous structural variations. We can also explore how imprinting is initiated and controlled, by examining the phased epigenome in different tissues and different developmental stages. We can even phase heterozygous mutations with our long reads, and compare the epigenome of alleles with and without mutations.
By adding this exogenous layer of information to the DNA itself, we can store information about the epigenetic state of the cell, then read it out along long single molecules using nanopore sequencing. Through the incorporation of additional methyltransferases, (e.g. EcoGII which methylates adenine to N6-methyladenine), we can take this technique still further, providing a “multi-color” measurement. Paired to longer reads, we can observe further cis interactions of protein binding and epigenetic states and understand the association of epigenetic features at long genomic distances.
ONLINE METHODS
GpC methylation model generation for nanopolish
Along with the GpC methylation model, the CpG methylation model was also regenerated to ensure the validity of the method for model generation. Genomic DNA from E. coli K12 MG1655 (ATCC 700926DQ) and genomic DNA from GM12878 lymphoblast cell line (Coriell Institute) were first sheared to an average fragment size of 8 kb using g-tubes (Covaris Cat. 520079). The fragmented DNA was PCR amplified to generate unmethylated DNA using the first steps of low input ligation kit SQK-LWP001 (ONT). Samples were end-repaired, deoxyadenosine(dA)-tailed, and ligated to amplification adaptors, followed by 11 cycles of PCR amplification. The resulting unmethylated, sheared DNA was methylated with M. SssI (NEB Cat. M0226) for CpG methylation or M. CviPI (NEB Cat. M0227) for GpC methylation, or both enzymes for CpG+GpC methylation. Two cycles of 4-hour methylation were performed for each sample, and for each cycle of treatment the enzyme and methyl donor (S-adenosylmethionine) were replenished at the 2 hour mark.
Validation of DNA methylation by bisulfite sequencing
Near-complete methylation in the training samples (E. coli) and testing samples (GM12878) were validated by performing whole genome bisulfite sequencing on the Illumina MiSeq platform. NEBNext Ultra library preparation kit (NEB Cat. E7370) and Zymo EZ DNA methylation-lightning kit (Zymo Cat. D5030) were used to generate the bisulfite sequencing libraries. DNA from each sample was shared to 300 bp fragments using Bioruptor Pico (Diagenode), followed by end-repair and dA-tailing. Methylated universal adaptor (NEB Cat. E7535) was ligated using the Blunt/TA ligase from the kit. The adaptor-ligated samples were bisulfite-converted, quenched, and cleaned-up before PCR amplification with multiplexing primers and uracil-tolerant Taq polymerase (KAPA HiFi Uracil+ (Roche Cat. KK2801)). The resulting DNA sequencing library was sequenced on an Illumina MiSeq device using V2 300-cycle chemistry.
The resulting fastq files were preprocessed by removing adaptor sequences and trimming low quality 3’ ends using Trim Galore version 0.6.3 (https://github.com/FelixKrueger/TrimGalore) with default parameters. Then, data was analyzed using Bismark version 0.19.040. After alignment, PCR duplicates were removed using Picard tools MarkDuplicates module version 2.20.2 (http://broadinstitute.github.io/picard/). Reads were truncated at the 3’ end by 2 bases at the 5’ end and 1 base at 3’ end to minimize methylation bias at the ends of reads introduced during the library preparation. The total number of methylated cytosine residues and unmethylated cytosine residues were counted to calculate methylation percentages of the samples.
Cell culture
GM12878 lymphoblast cells were obtained from Coriell Institute and MCF-10A, MCF-7, and MDA-MB-231 breast cells were obtained from ATCC. GM12878 were grown in RPMI 1640 medium (Gibco Cat. 11875119) supplemented with 15% fetal bovine serum (FBS, Gibco Cat. 26140079) and 1% penicillin-streptomycin (P/S, Gibco Cat. 15140122). MCF-10A were grown in DMEM F-12 medium (Gibco Cat. 11320033) supplemented with 5% horse serum (Gibco Cat. 16050122), 10 µg/mL human insulin (Sigma Aldrich Cat. 19278), 20 ng/mL hEGF (Gibco Cat. PHG0311L), 100 ng/mL Cholera toxin (Sigma Aldrich Cat. C8052), 0.5 µg/mL Hydrocortisone (Sigma Aldrich Cat. H0135), and 1% P/S. MCF-7 and MDA-MB-231 were grown in DMEM (Gibco Cat. 11965118) supplemented with 10% FBS and 1% P/S.
Nucleosome footprinting via GpC methyltransferase
NOMe-seq was performed on the cells with adjustments for nanopore sequencing. Cells were collected by trypsinization, then nuclei were extracted by incubating in resuspension buffer (100 mM Tris-Cl, pH 7.4, 100 mM NaCl, 30 mM MgCl2) with 0.25 % NP-40 for 5 minutes on ice. Intact nuclei were collected by centrifugation for 5 minutes at 500xg at 4°C. Nuclei were subjected to a methylation labeling reaction using a solution of 1x M. CviPI Reaction Buffer (NEB), 300 mM sucrose, 96 µM S-adenosylmethionine (SAM; New England Biolabs, NEB), and 200 U M. CviPI (NEB) in 500 µL volume per 500,000 nuclei. The reaction mixture was incubated at 37 °C with shaking on a thermomixer at 1,000 rpm for 15 minutes. SAM was replenished at 96 µM at 7.5 minutes into the reaction. The reaction was stopped by the addition of an equal volume of stop solution (20 mM Tris-Cl, pH 7.9, 600 mM NaCl, 1% SDS, 10 mM disodium EDTA). Samples were treated with proteinase K (NEB) at 55 °C for > 2 hours, and DNA was extracted via phenol:chloroform extraction and ethanol precipitation. After proteinase K treatment, and in all following steps, samples were handled with care using large orifice pipette tips to avoid excessive fragmentation of DNA.
Nanopore sequencing
Purified gDNA was prepared for nanopore sequencing following the protocol in the genomic sequencing by ligation kit LSK-SQK108 (ONT). Samples were first sheared to ~10 kb using G-tubes (Covaris): by centrifuging 2–3 µg of unfragmented gDNA at 5,000xg for 1 minute, then inverting the tube and centrifuging again. We sheared the DNA to 10 kb because it produces long fragments of DNA while maximizing the yield of nanopore sequencing. Shearing to larger sizes or unsheared DNA may be used to maximize the length of sequenced reads, with the caveat that sequencing yield will drop. In two samples (GM12878 samples 8 and 9), we targeted 20kb fragments, with an additional step of removing short fragments using the Short Read Eliminator module by Circulomics, following the manufacturer’s specifications. The sheared samples were end-repaired and dA-tailed using NEBnext Ultra II end-repair module (NEB), followed by clean-up using 1x v/v AMPure XP beads (Beckman Coulter). Sequencing adaptors, comprised of leader adaptor DNA and motor proteins, were ligated to the end-prepared DNA fragments using Blunt/TA Ligase Master Mix (NEB), followed by clean-up using 0.4x v/v AMPure XP beads and sequencing kit reagents. >400 ng of adaptor ligated samples per flow cell were loaded onto FLO-MIN106 or PRO-002 flowcells and run on MinION Mk1b, GridION, or PromethION sequencers for up to 72 hours. Data were collected by MinKNOW version 1.14.
Data preprocessing (basecalling, alignment, methylation calling, and structural variant calling)
Raw current signals were converted to DNA sequences using Guppy version 3.0.3 (ONT), using the “high-accuracy” basecalling model14. DNA sequences were aligned to hg38 human reference genome without alternative contigs using NGMLR version 0.2.8 with default settings for aligning Oxford nanopore reads (-x ont)37 CpG and GpC methylation were called using nanopolish version 0.11.1. We used Sniffles version 1.0.1137 with default parameters to detect SVs across each sample and SURVIVOR version 1.0.738 to obtain a multi-sample VCF file.
Nanopolish methylation training for dual CpG/GpC methylation
To train the methylation calling models we generated nanopore sequencing data for E. coli gDNA treated with M.SssI (to methylate CpGs), M.CviPI (to methylate GpCs), and both M.SssI and M.CviPI (to methylate in both contexts) (described above). The three datasets were basecalled with Guppy (version 3.0.3) and aligned to the E. coli genome using NGMLR version 0.2.8. The reference genomes for each dataset were then modified by converting Cs to Ms in the appropriate context. We then merged the three reference genomes and three BAM files together and downsampled the alignments to 10% coverage to reduce model training time in the subsequent step. At the end of this preprocessing, we had a dataset with a mixture of reads that have CpG methylation, GpC methylation, or both, and matching reference sequences to align each read to indicate the pattern of methylation in each read.
The k-mer states for the CpG/GpC model were trained using “nanopolish train”, a new model training method that implements the forward/backward algorithm on a simplified HMM to calculate the posterior probability of an observed event originating from a k-mer of the reference sequence. The Gaussian distributions were fit as previously described7 except each observation was weighted by the posterior probability, and we fit a single Gaussian in all cases rather than Gaussian mixtures. The complete training code is provided in the cpggpc_new_train branch (commit c409580) of the nanopolish github repository. Model training was run for 10 iterations and the final model was used for the subsequent methylation calling.
Nanopolish methylation calling for dual CpG/GpC methylation
We modified the methylation calling module of nanopolish to be able to call methylation in multiple motifs simultaneously (github branch cpggpc_new_train, commit c409580). As in our previous work, we start by grouping nearby CpG and GpC sites together (minimum distance of 5 to separate sites). We then calculate a likelihood for combinations of the grouped sites being methylated or unmethylated (either no sites methylated, all CpGs methylated, all GpCs methylated, or all sites both contexts methylated), using the k-mer states trained in the previous section, with the hidden Markov model we previously described. We then calculate a log-likelihood ratio for each motif (CpG, GpC), by summing the likelihoods across all sequences where the motif is methylated, or unmethylated.
Validation of nanopolish calling for dual CpG/GpC methylation
We used the GM12878 methylation controls as the testing set to validate the methylation calling model and choose an appropriate threshold for calling methylation. Receiver operating characteristic (ROC) curves were generated by applying a range of LLR thresholds to bin the continuous LLR into the binary state of methylated/unmethylated calls and comparing to the true state for each singularly methylated and the unmethylated data. To choose the LLR for calling CpG methylation, we separated the LLRs of both the E. Coli and GM12878 methylation controls based on the true states, into distributions of methylated CpG calls and unmethylated CpG calls. We then chose the LLR that would allow 5% false calls (i.e. Top 5th percentile of LLRs for unmethylated calls and bottom 5th percentile of LLRs for methylated). Then, to make the thresholds symmetric between methylated and unmethylated calls, we averaged the absolute value of the two thresholds and applied a ceiling function to the nearest half. As a result, we chose a threshold of 1.5 for calling CpG methylation (LLR < −1.5 is unmethylated, and > 1.5 is methylated, and values between are uncalled). We set a threshold of 1 for GpC methylation in a similar way.
Accessibility peak finding, one-sample comparison of methylation and accessibility, and enrichment analysis of differential epigenetic regions on genomic contexts
For comparison and visualization of bulk methylation and accessibility, estimated profiles of measurements were calculated by fitting locally weighted generalized linear models across the genome for each sample as implemented by Bioconductor packages bsseq version 1.20.041. For each CpG methylation site, data in a window of at least 1,000 bps and 50 nearby sites with a maximum gap of 100kb with tricube kernel weights was used to estimate the smoothed methylation frequency. For GpC methylation, the minimum window and number of sites were arbitrarily reduced to 100 bp and 10 nearby sites to account for more rapid fluctuations in the accessibility profile due to nucleosome positioning.
To find regions of high accessibility, continuous regions having smoothed accessibility greater than 99th percentile of the data were first selected. The significance of each accessible region was determined by performing a binomial test of the raw frequency of accessibility, with overall accessibility frequency as the null probability. The probabilities were corrected for multiple testing using Benjamini-Hochberg correction, and accessible regions with adjusted p-values less than 0.01 and widths greater than 50 bps were determined to be accessibility peaks. To determine differentially accessible regions (DARs) between two samples without replicates, we identified accessibility peaks that were present exclusively in one of the samples. For each candidate DAR, we performed a one-sided Fisher’s Exact test on raw counts of accessible and inaccessible calls. P-values were corrected using Benjamini-Hochberg correction, and regions with adjusted p-values less than 0.01 were determined to be significant DARs.
To find differentially methylated regions (DMRs) between two samples without replicates, the difference of methylation between the two samples was calculated for each CpG site. Then, continuous regions with differences greater than 99th percentile of the differences were selected as candidates for hypermethylation, and regions with differences less than the 1st percentile were selected as candidates for hypomethylation. Similarly, for DARs, we performed a one-sided Fisher’s Exact test on raw counts of methylated and unmethylated calls on each candidate DAR. P-values were corrected using Benjamini-Hochberg correction, and regions with adjusted p-values less than 0.01 and widths greater than 100 bps were determined to be significant DMRs.
To calculate the enrichment of DMRs, DARs, and concordantly differential regions in various genomic contexts, we first calculated the total width of the genome and the total width of the genomic contexts of interest that contain CpG and GpC data. Then the total number of differential regions was divided by the total width of the genome, which is the expected abundance of differential regions. This was used as the baseline against the total numbers of differential regions in genomic contexts of interest divided by the total widths of the genomic contexts to generate the final values of enrichments. For TSS and small TF binding sites, we used 1000 bp regions centered on the genomic elements.
Comparison of nanoNOMe with conventional methodologies
Bulk NGS methodologies comparable to nanoNOMe on GM12878 were used to compare and validate nanoNOMe. Whole genome bisulfite sequencing methylation frequencies were obtained from Encode accession ENCFF835NTC, normalized MNase-seq signals were obtained from Encode accession ENCSR000CXP, and normalized DNAse-seq signals were obtained from Encode accession ENCSR000EJD13. ATAC-seq data was obtained from GEO accession GSE477532 and processed using the standard ENCODE pipeline version 7813. Nanopore whole genome sequencing data was obtained from ENA accession PRJEB2302714, and processed the same way as nanoNOMe.
For comparing mappability between WGBS, nanopore WGS, and nanoNOMe, the numbers of reads aligning to 200 bp bins of the genome were calculated. GC-bias of the coverages were determined by calculating the percentages of C/G for each of the 200 bp bins and plotting the per-bin coverage against the CG percentage. To compare mappability in specific genomic contexts, a region was considered to be robustly mapped in a dataset if its coverage was between the 5th and 95th percentile of the genome-wide binned coverage. The upper threshold takes into account aberrantly highly mapped regions, while the lower threshold removes low mappability regions.
For comparison of nanoNOMe signals with conventional bulk methods, average methylation was calculated for each CpG and GpC site. To compare nanoNOMe CpG methylation to WGBS methylation, methylation frequencies for each CpG locus across the genome were compared pairwise between the two methods. To compare nanoNOMe GpC accessibility signal to normalized ATAC-seq and DNAse-seq signals, the intersections were determined from accessibility peaks of nanoNOMe, ATAC-seq, and DNAse-seq.
Methylation frequencies from WGBS and normalized MNase-seq signals at regions surrounding genomic features of interest (CTCF, TSS with respect to expression and histone modifications) were extracted for the generation of the metaplots. For each genomic feature, average methylation frequency and accessibility were aggregated with respect to distance from the feature, followed by taking the rolling average with a window of 50 bp. Known TSS and CGI were obtained from Gencode (release v29). TSSs were grouped by expression quartile based on RNA-seq of GM12878 (ENCODE accession ENCSR843RJV), and by the presence of ChIP-seq peaks of histone modifications H3K4me3 (ENCODE accession ENCSR057BWO) and H3K27me3 (ENCODE accession ENCSR000AKD) within 1kb of the TSS. CTCF binding sites were determined by overlapping computationally predicted CTCF binding sites17 with conservative IDR peaks in ChIP-seq of CTCF on GM12878 (ENCODE accession ENCSR000AKB) and removing peaks that fell within 2kb of known TSS.
Read-level analysis of nanoNOMe
To remove isolated erroneous calls of accessibility on individual reads, we applied a fixed-bandwidth Gaussian kernel smoothing on the log-likelihood ratios (LLRs). First, LLR were capped at the calling thresholds (−1,1), forcing all LLRs with absolute value greater than 1 to be −1 or 1, to prevent bias from LLRs with large magnitudes. The adjusted LLRs were smoothed using a gaussian kernel with fixed bandwidths. Smoothed LLRs were called as accessible (methylated) if the LLR > 0.4 and inaccessible (unmethylated) if the LLR < 0.4.
To discriminate CTCF binding events from nucleosome binding events on individual reads, we used lengths of inaccessible runs on centers of CTCF binding motifs. The lengths were clustered on Gaussian finite mixture models using Expectation-Maximization algorithm implemented by R package Mclust version 5.4.542. The optimal clustering parameters were determined based on maximum integrated complete-data likelihood (ICL), and the cluster that had the smallest mean length ( 54 bps) was chosen as CTCF-binding signal and the other clusters as units of nucleosome-binding signals. This model was applied to classify all inaccessible runs within 25 bps of CTCF binding sites as CTCF-bound or nucleosome-bound and reads that contained CTCF-bound inaccessible runs were considered to be CTCF-bound reads. To predict protein binding events outside of CTCF binding sites, we used the model on all inaccessible runs to categorize them to one of the clusters, using the runs that were assigned into the smallest mean length cluster (sub-nucleosomal footprints) as candidates for protein binding. We selected regions that contained at least ten candidates as the predicted regions of protein binding events.
To predict combinatorial epigenetic signatures of individual reads on TSS, we used methylation and accessibility in a window around the TSS. On each read that spans a TSS, we calculated average CpG methylation over the 1kb region around the TSS and GpC accessibility over 200 bps around the TSS. For promoter accessibility, we converted sub-nucleosomal footprints into accessible runs before calculating the average accessibility. The two epigenetic signals were separately clustered into two clusters of high and low average signals using the Expectation-Maximization algorithm on Gaussian finite mixture models as used above to generate probabilistic models of the epigenetic signatures. On individual reads, CpG methylation and GpC accessibility were separately clustered using the resulting models, and the combinatorial epigenetic signature of reads was determined based on the combination of the cluster assignments.
Read-level sub-nucleosomal footprint measurement and promoter epigenetic signature estimation were coupled by first estimating regions of protein binding within 10kb of TSSs of a subset of genes. Sites that have 10 or more reads with short inaccessible runs in a window less than 80 bp were selected as sub-nucleosomal footprint regions. We then separated the reads based on the epigenetic signature of nearby gene promoter(s), and separately assessed the reads that suggest a protein-binding event at the sub-nucleosomal footprint region in each group, resulting in protein-bound reads specific to each promoter epigenetic signature. Transcripfion factor enrichment of sub-nucleosomal footprints was performed using Haystack against the JASPAR TF database25,26.
Haplotype Assignment and Allele-Specific Methylation Analysis
We obtained genotype information for GM12878 from existing phased Illumina platinum genome data generated by deep sequencing of the cell donors’ familial trio28. The bcftools package was used to filter for only variants that are heterozygous in GM12878. The heterozygous GM12878 SNVs were used to identify reads with allele-informative variants and assign the parent of origin for each read using WhatsHap version 0.1843. Methylation and accessibility calls on each read were separated based on the haplotype assignments to generate allele-specific profiles of methylation and accessibility.
To identify accurate heterozygous SVs, we called SVs on the two alleles separately using Sniffles version 1.0.11 and SURVIVOR version 1.0.7 as described above. From the resulting merged vcf, we selected heterozygous SVs by selecting the SVs that have less than 2 non-variant and more than 20 variant reads on only one of the alleles. To remove SVs that are short in length or affected by incorrect alignments, we removed SVs that are shorter than 200 bps and have more than 100 read alignments in one allele.
After detecting DMRs and DARs as described above between the two alleles, the DARs were compared with allelic imbalance in GM12878 ATAC-seq (GSE47753). ATAC-seq reads in and around the allele-specific DARs were phased using WhatsHap version 0.18 and the annotated GM12878 SNVs. The log of ratio of coverages between alleles in ATAC-seq were compared to the difference in accessibility frequency between alleles, and their correlation was verified by a Pearson correlation coefficient.
Breast cancer cell line analysis
RNA-seq counts of the three cell lines were downloaded from GEO accession GSE7516835 and analyzed using the bioconductor packager DESeq2 version 1.24.044. Using default parameters, differential expression analysis was performed based on the negative binomial distribution, comparing MCF-7 and MDA-MB-231 to MCF-10A. Genes were considered to be significantly differentially expressed when the Bonferroni-Hochberg corrected p-values were less than 0.01.
Of this differentially expressed set, we filtered for genes with 5 or more differences between normal and cancer lines in the number of reads indicating epigenetically concordant active promoters. Then sub-nucleosomal footprints were compared on predicted protein-binding regions within 10kb of the TSS of these genes, and the fraction of reads that have a footprint were calculated for each sample. Those regions that had a difference of footprint fraction >= 0.4 were selected as genes with differences in the promoter epigenetic signatures and protein binding.
Chromatin Immunoprecipitation Analysis
Cell lines (MCF-10A, MCF-7 and MDA-MB-231) were fixed for 8 minutes in 1% formaldehyde (Thermo, 28906), and the reaction stopped by quenching the reaction with 2.5M glycine (ThermoFisher). Protease inhibitor (Roche 11836170001) was added to lysis buffers and sonication buffer. Fixed nuclei were prepared by lysis in Buffer 1 (50mM HEPES pH7.5, 140mM NaCl, 1mM EDTA, 10% glycerol, 0.5% NP-40, 0.25% IGEPAL) for 10min at 4°C, then Buffer 2 (200mM NaCl, 1mM EDTA, 10mM Tris pH8) for 10min at room temperature. Fixed nuclei were resuspended in sonication buffer (1mM EDTA, 10mM Tris pH 8, 100mM NaCl, 0.1% sodium deoxycholate, 0.5% N-lauroyl sarcosine). DNA was sheared using a Biorupter Pico (Diagenode) at 4°C, for 5 cycles of 5x (15s on/30s off) to ~1 kilobase fragments. Sheared DNA was clarified for debris by addition of IGEPAL detergent (final conc 1%), and centrifugation at 15000xg for 10min at 4°C. 100uL of ProteinG Dynabeads (ThermoFisher, 10003D) were washed in 0.5% BSA/PBS solution, then incubated overnight with 10ng of antibody (anti-RNAPser5P; abcam 5131). Sheared chromatin was incubated with the antibody-bound Dynabeads overnight at 4°C. Background DNA was removed by four rinses with wash buffer (50mM HEPES pH 7.5, 1mM EDTA, 0.7% sodium deoxycholate, 1% IGEPAL, 0.5M LiCl) and one rinse with hi-salt buffer (10mM Tris pH 8, 1mM EDTA, 50mM NaCl). DNA was eluted from beads by 10min incubation at 65°C in elution buffer (50mM Tris pH 8, 10mM EDTA, 1% SDS), and cross-links reversed by overnight incubation at 65°C. Protein was digested by a 2 hour proteinase K treatment (final conc. 0.2ug/uL) at 55°C. DNA was isolated using a MinElute kit (Qiagen, 28004). Samples were analyzed using real-time quantitative PCR (Stratagene MX2005P, Agilent) with Fast SYBR Green master mix (Applied Biosystems, 4385612), and normalized against 5% input. The primers used for qPCR amplification were as follows (all 5’ to 3’): GAPDH-(fwd:TACTAGCGGTTTTACGGGCG, rev:TCGAACAGGAGGAGCAGAGAGCGA); IL-12a-( fwd:GGCACTCCTCTCTCTACGTC, rev:AGCTCGGCCCAAAATGAAAG) ZNF714-(fwd:TCCCCTTCAGCCATAAGATG, rev:CACGGACCCATTCATAAACC).
Extended Data
Extended Data Fig. 1. Assessment of CpG and GpC dual methylation calling.
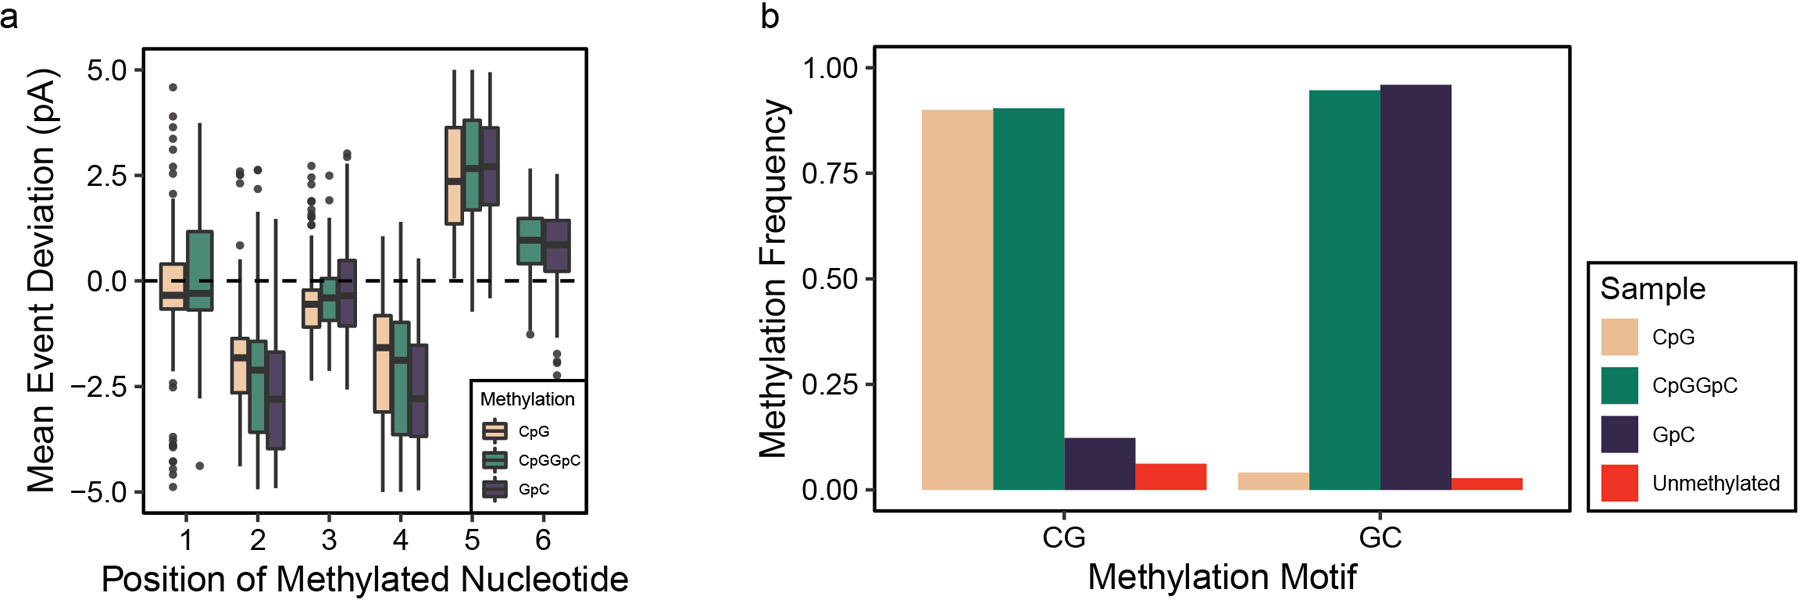
The ability of nanopore sequencing to distinguish cytosine methylation at CpG and GpC contexts is shown by (a) examining current level shifts depending on the placement of the methylation on a 6-mer (n = 256 unique 6mers for each group). Data are presented as median values, interquartile range (IQR), and 1.5X IQR. The performance of the methylation caller was validated by (b) measuring methylation frequencies for calling methylation in samples treated by methyltransferases.
Extended Data Fig. 2. Bulk NanoNOMe profiles at CTCF binding sites.
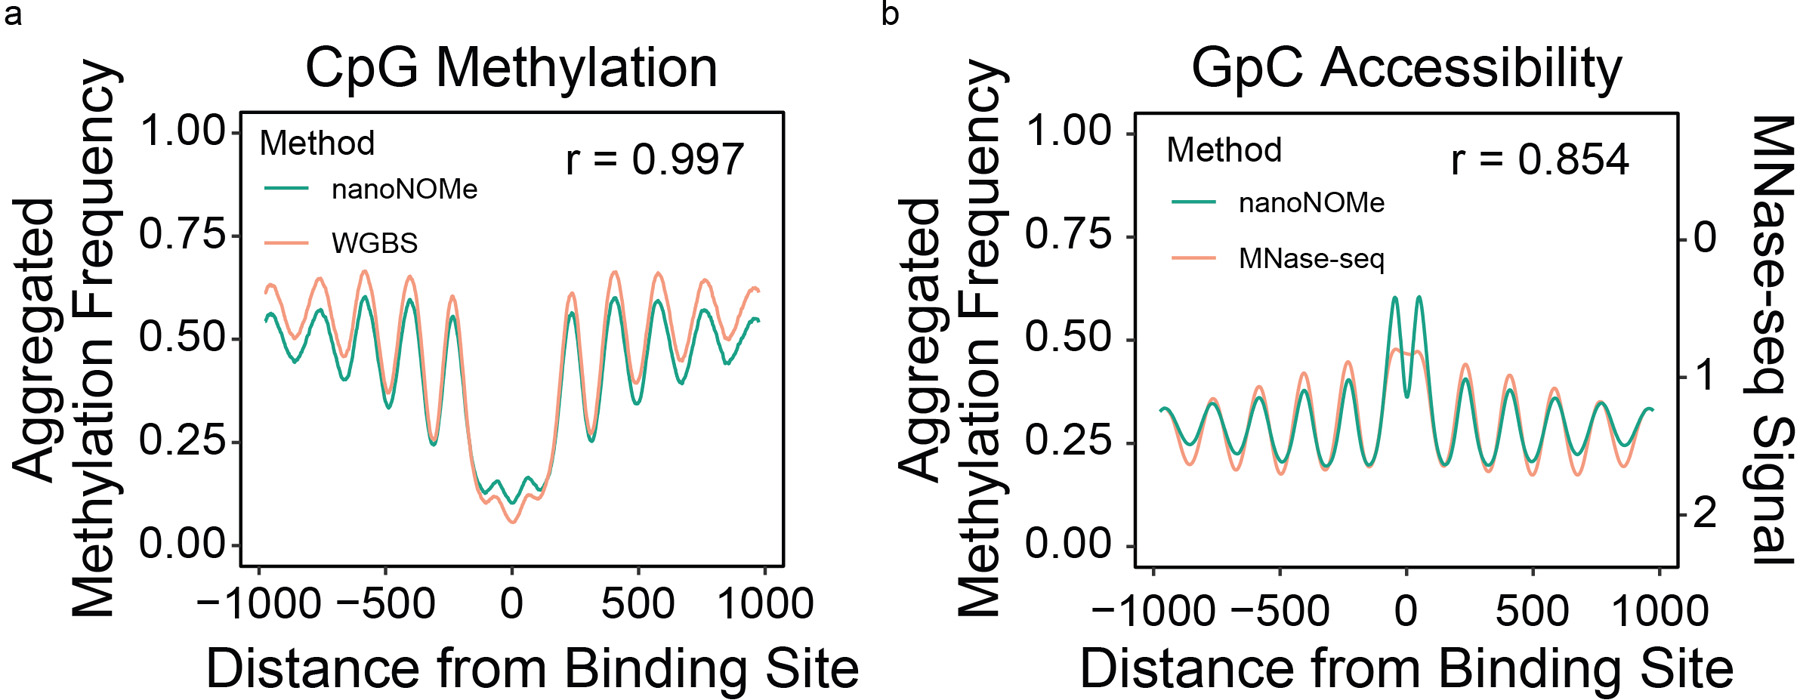
Metaplots of (a) methylation and (b) accessibility as a function of distance to CTCF binding motifs in nanoNOMe, WGBS, and MNAse-seq agree very closely
Extended Data Fig. 3. Pairwise Comparison of Methylation and Accessibility at Gene Promoters.
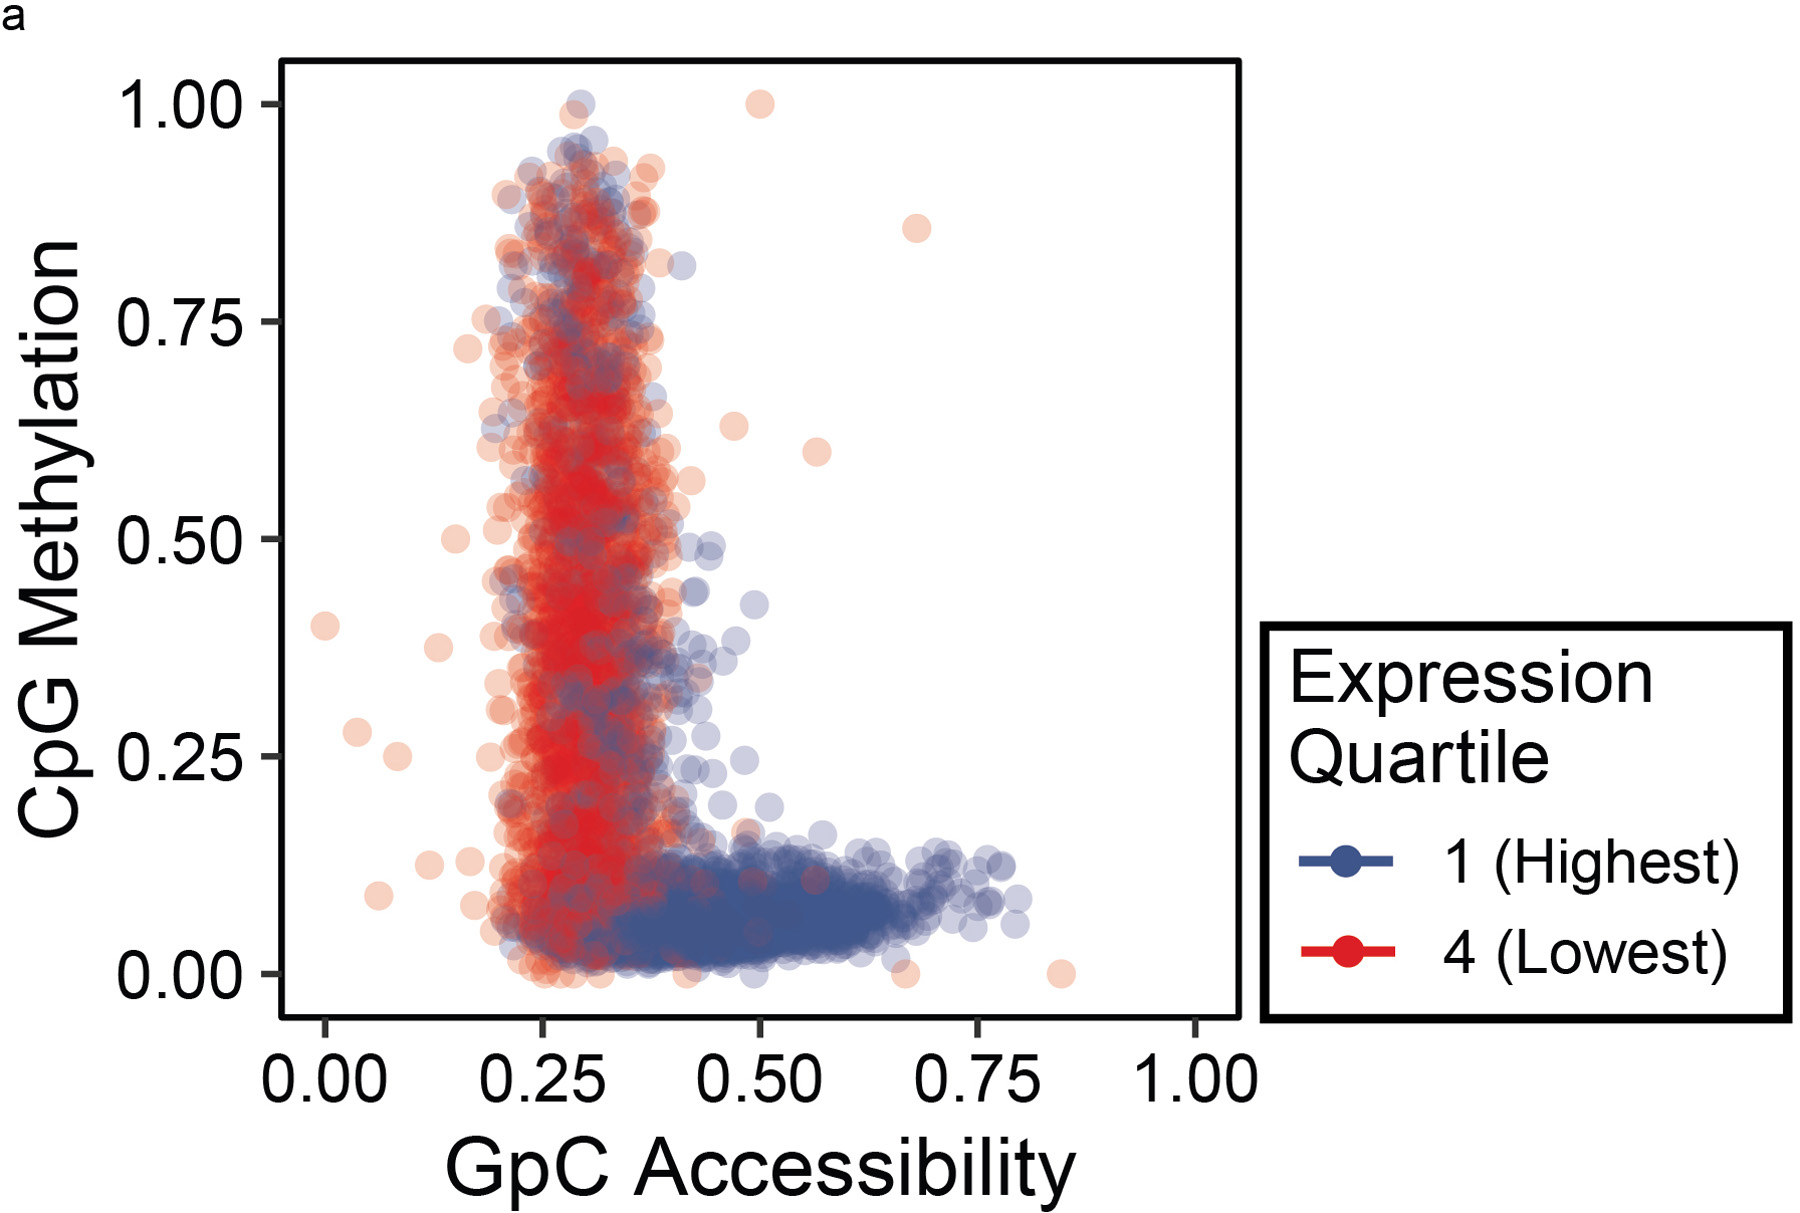
Pairwise scatter plot of average CpG methylation to GpC accessibility for 400 bp regions centered at each gene TSS, colored by its gene expression quartile.
Extended Data Fig. 4. GpC accessibility kernel estimation on single reads.
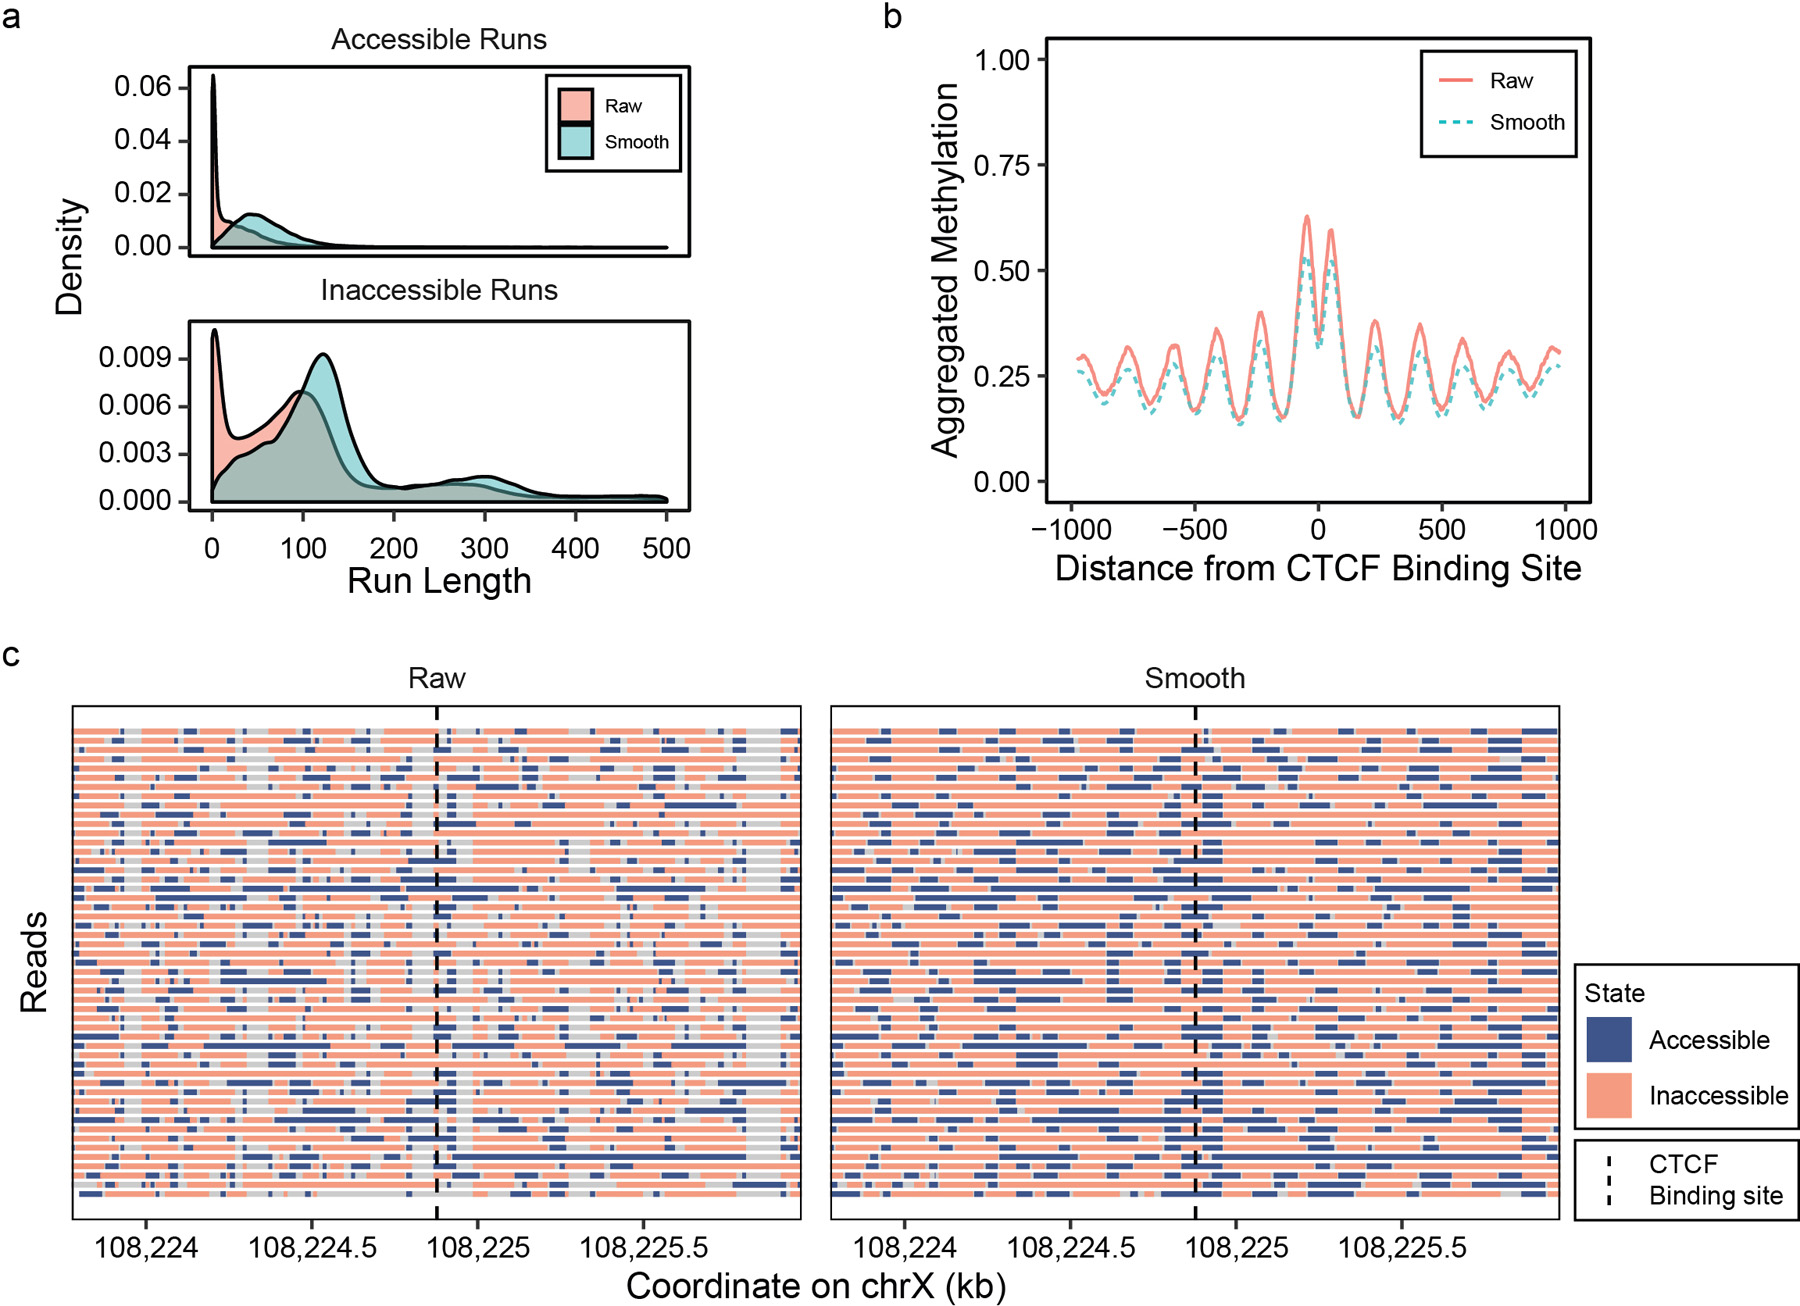
GpC methylation calls were smoothed using a Gaussian kernel estimator. (a) Distributions of length of accessible and inaccessible runs and (b) metaplot of accessibility near CTCF binding sites before and after the smoothing, along with (c) example of read-level plot of accessibility from a 2kb region around a CTCF binding site.
Extended Data Fig. 5. Single-read epigenetic assessment on CTCF binding sites.
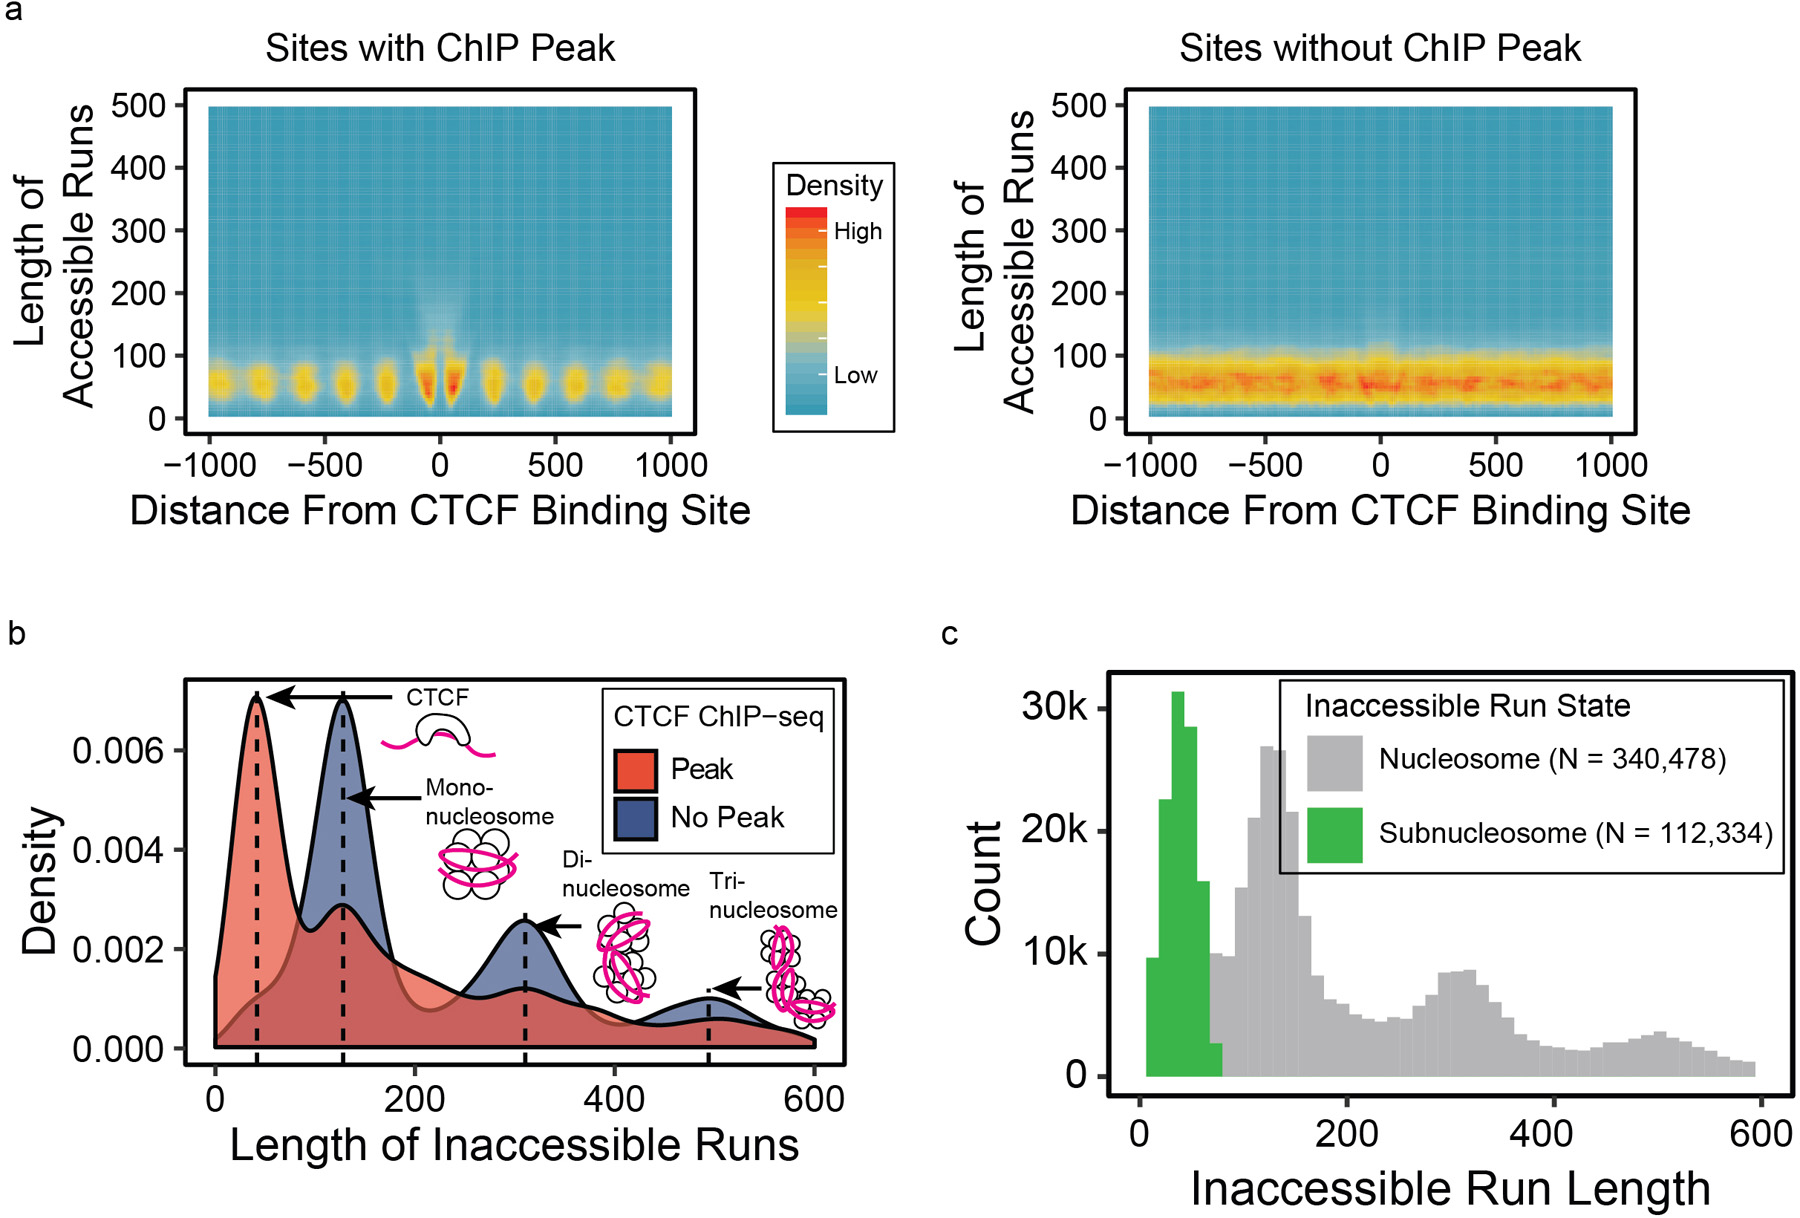
(a) Heatmaps of lengths of runs of accessible chromatin calls on individual reads with respect to distance from CTCF binding sites, separated based on presence of ChIP-seq peaks. (b) Density distributions of inaccessible runs at the CTCF binding sites, showing that sites without CTCF binding have long inaccessible runs suggesting nucleosome binding while those with CTCF binding have short inaccessible runs (sub-nucleosomal footprints) suggesting CTCF binding. (c) Inaccessible runs were classified as either sub-nucleosomal or nucleosome binding depending on their lengths based on mixed Gaussian models
Extended Data Fig. 6. CTCF binding classification.
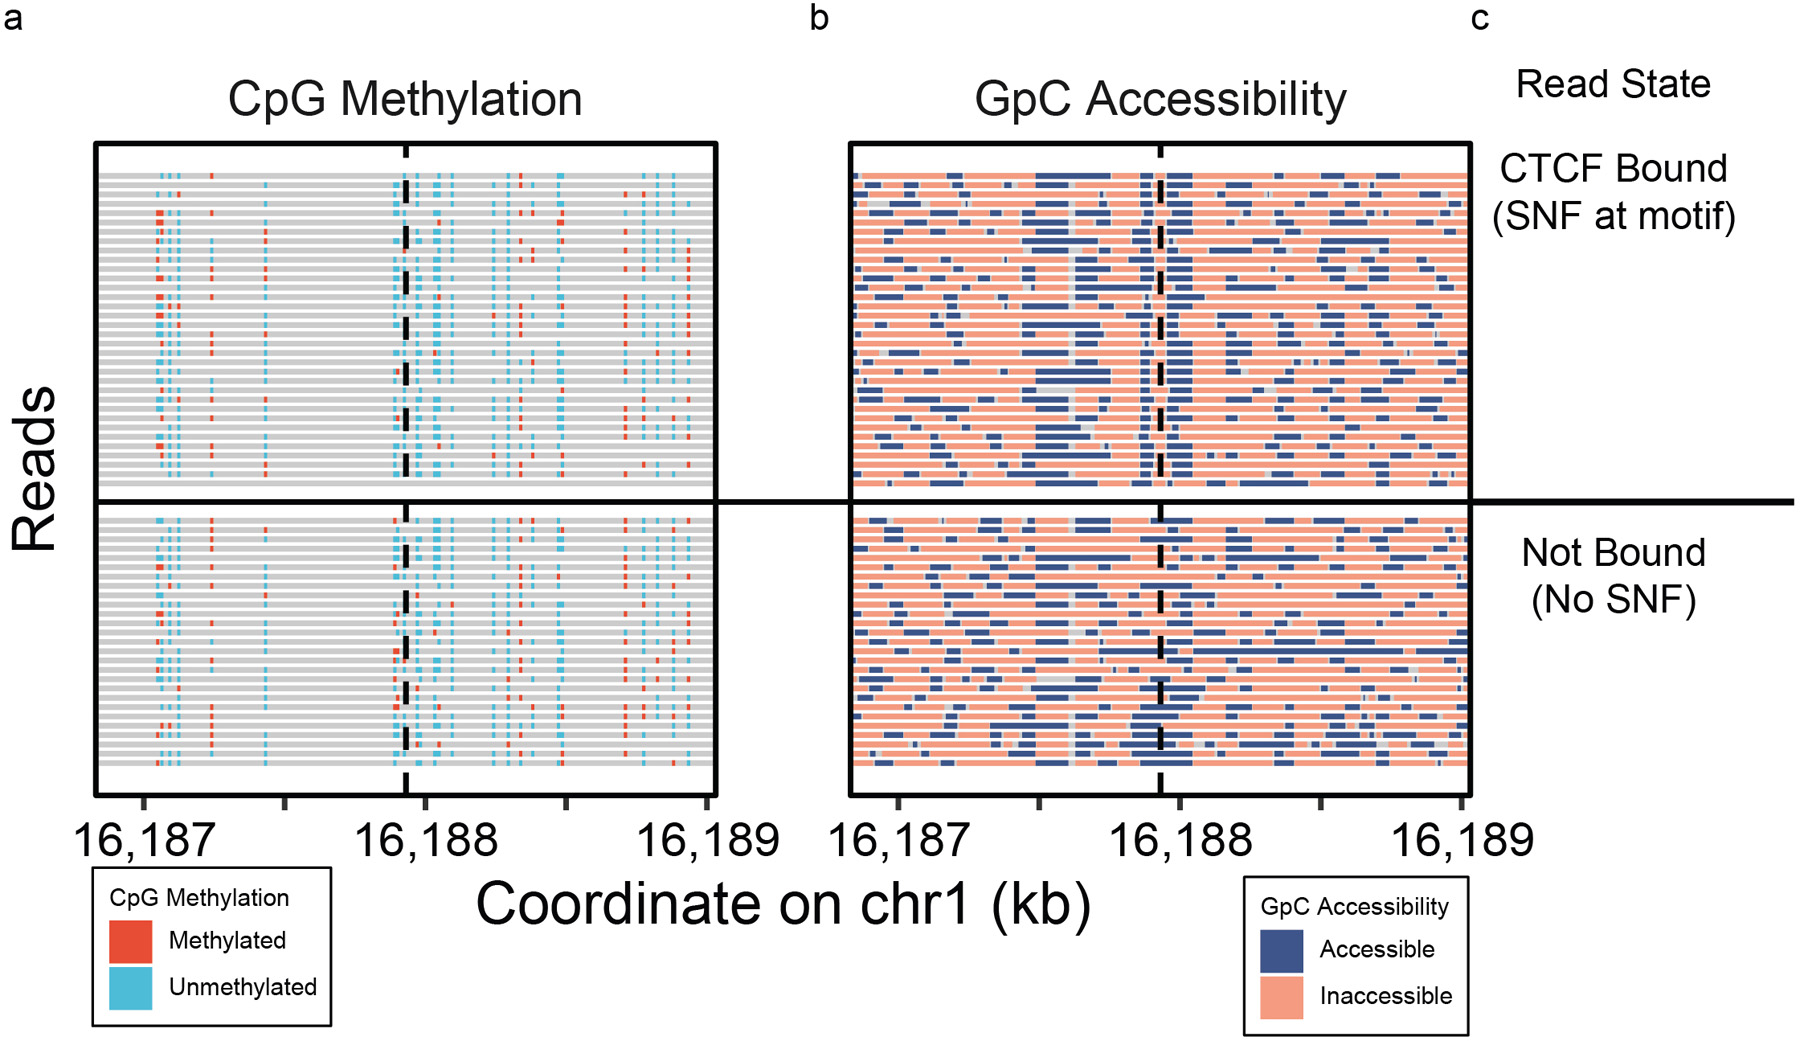
Single-read (a) methylation and (b) accessibility plots on a CTCF binding motif, clustered by the presence of sub-nucleosomal footprint at the binding motif, predicted as events of CTCF protein binding.
Extended Data Fig. 7. Comparison of protein binding prediction with ChIP-seq.
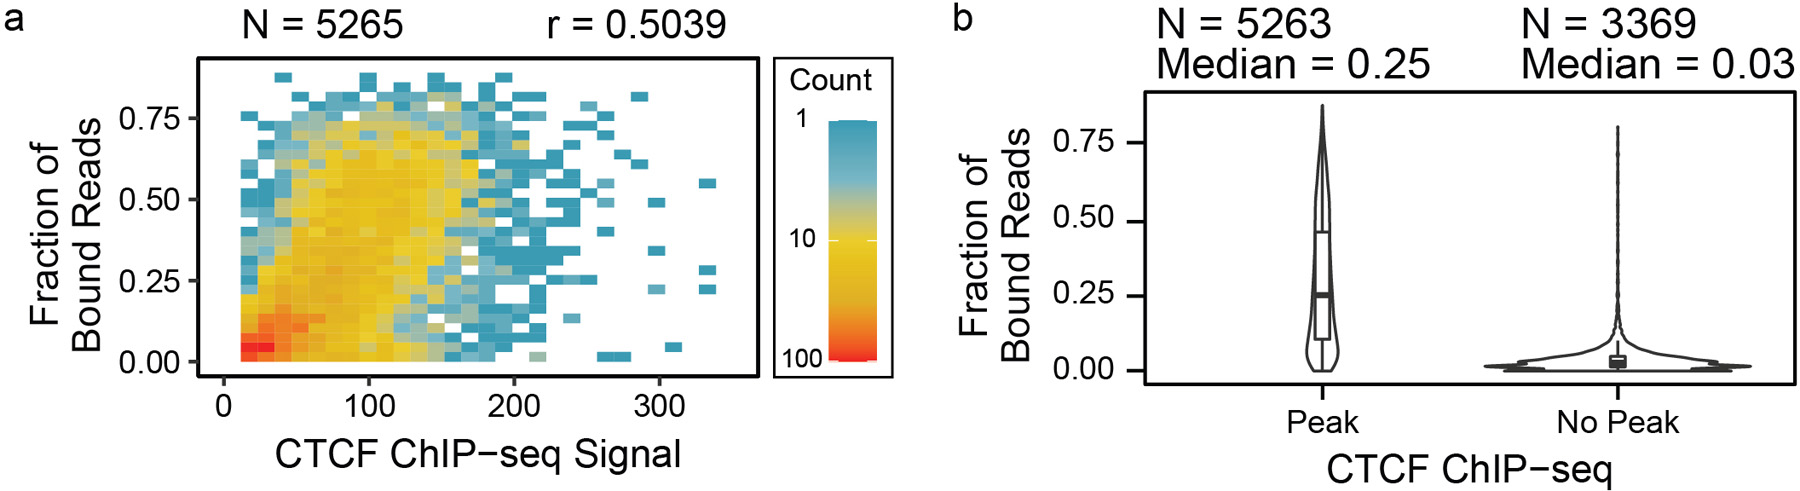
(a) The fractions of CTCF-bound reads determined by sub-nucleosomal footprints were compared with ChIP-seq coverage enrichments per CTCF binding motif, showing that the ChIP-seq signal tends to increase with CTCF binding fraction, and (b) the distributions of the fractions were stratified by binding motifs with ChIP-seq peaks to those without peaks, showing that sites with ChIP-seq peaks have higher fractions of CTCF binding. Data are presented as median values, interquartile range (IQR), and 1.5X IQR, as well as density distributions.
Extended Data Fig. 8. Haplotype phasing results on GM12878 nanoNOMe data.
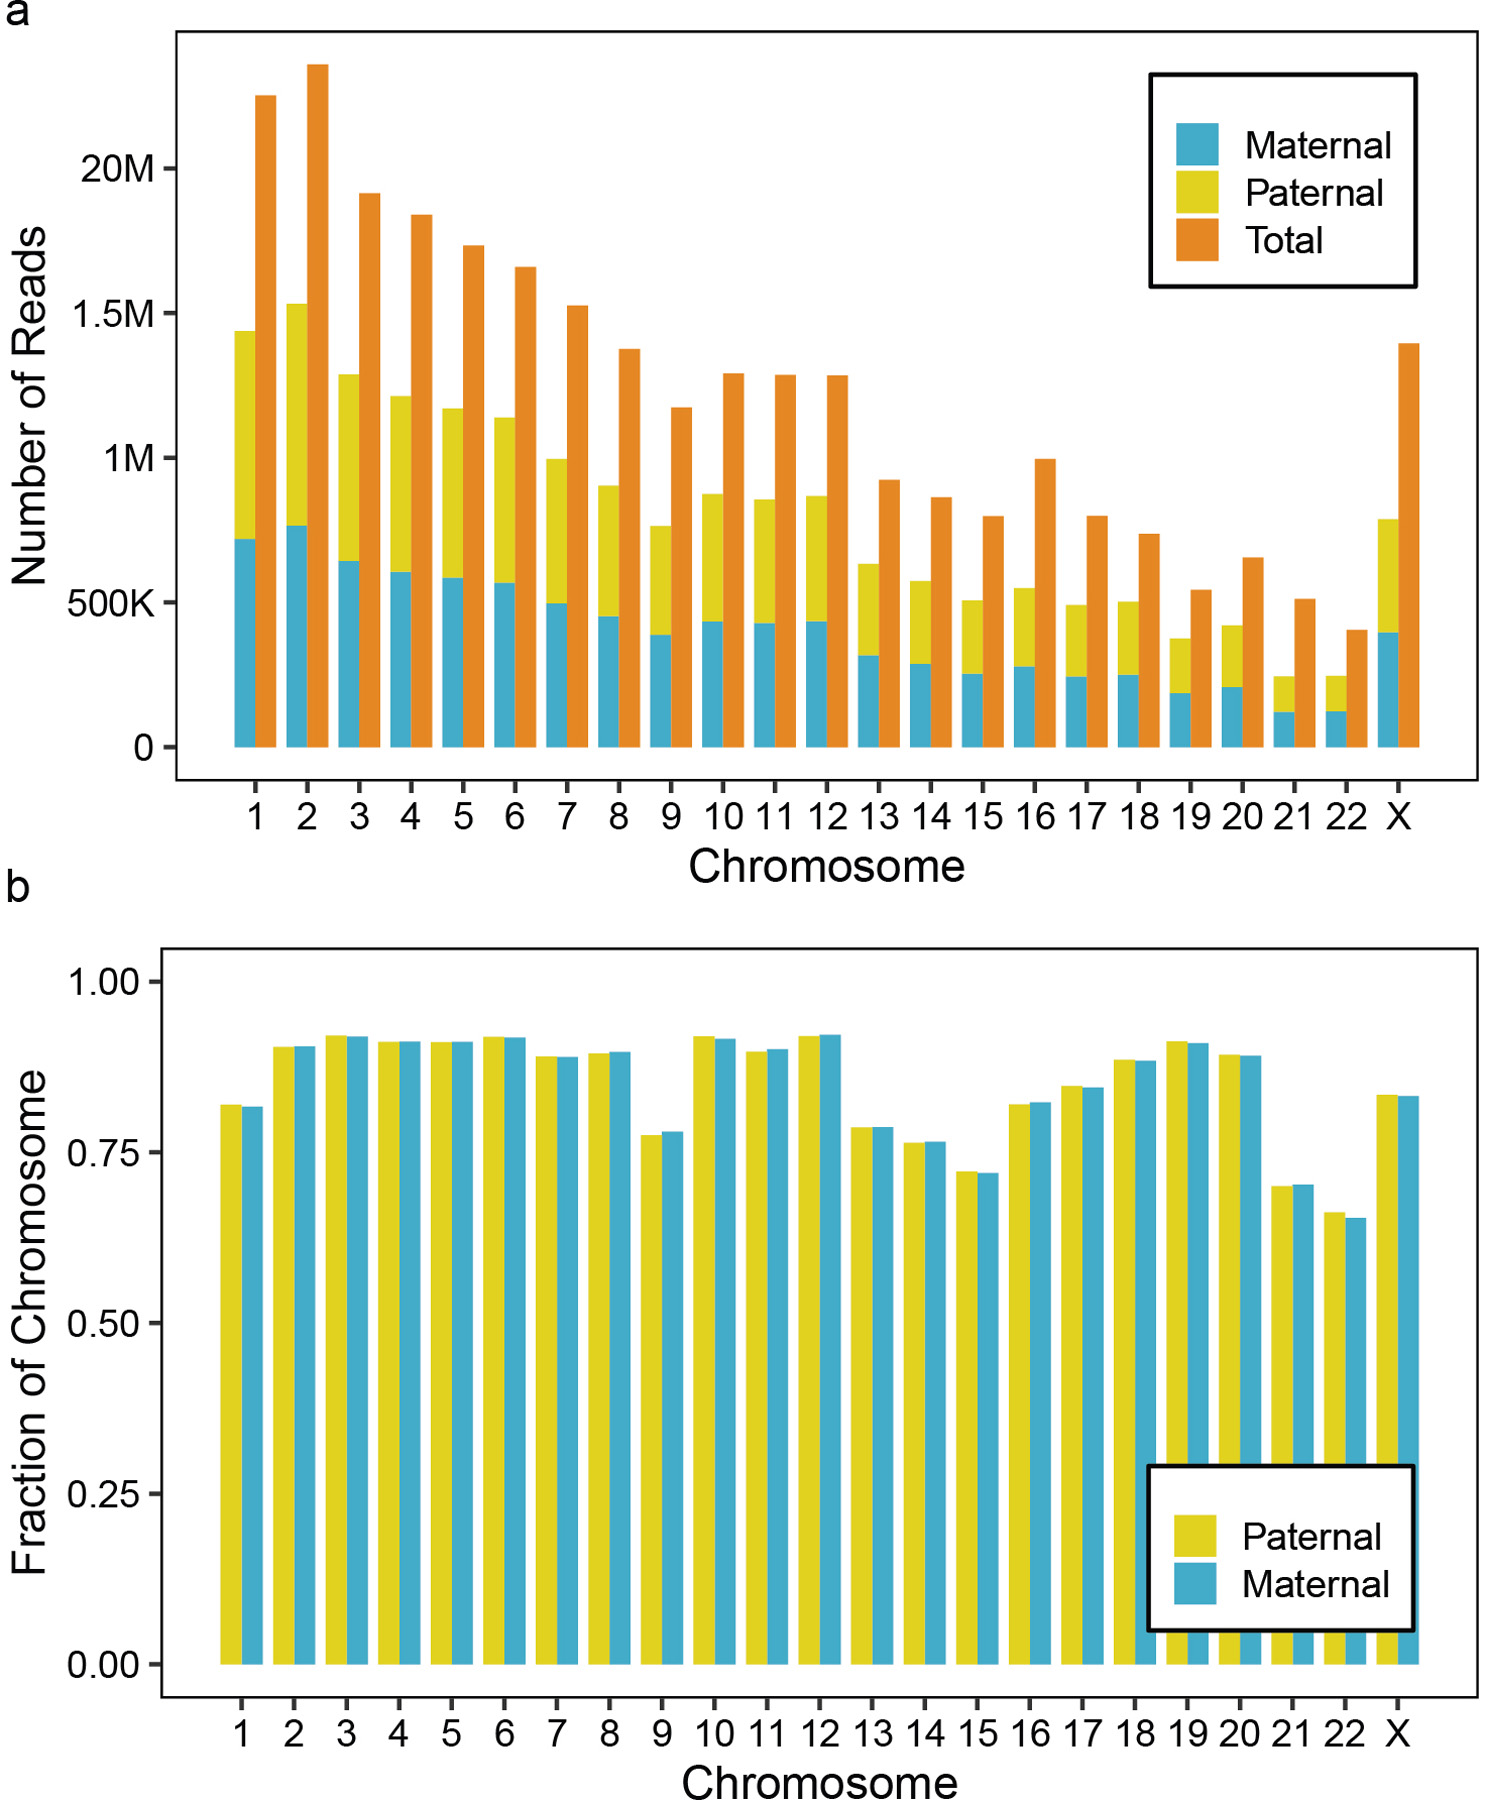
(a) The number of reads that could be phased into maternal or paternal read based on the presence of heterozygous SNV in the read, showing that 65% of reads could be phased. (b) The fractions of the chromosomes that could be phased (the fraction that had > 10x coverage on each allele after phasing) shows on average, 86 % of the genome could be phased.
Extended Data Fig. 9. X-chromosome inactivation promoter comparisons.
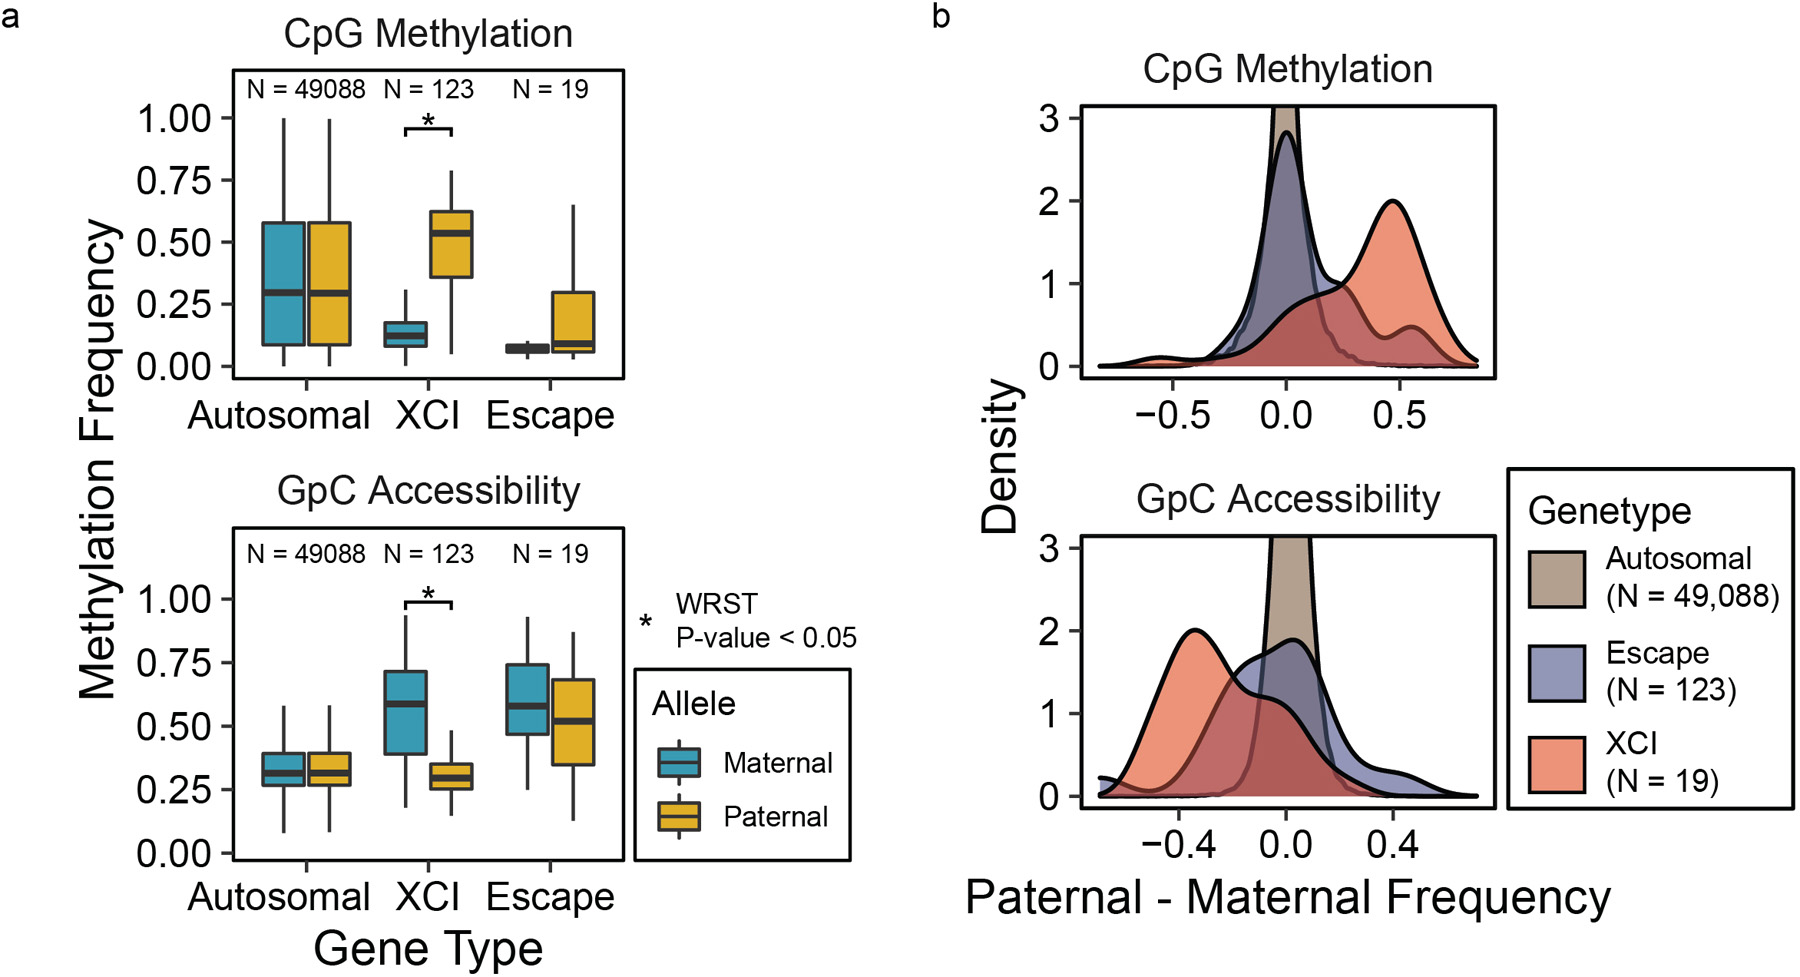
Methylation and accessibility in 500 bp and 100 bp windows, respectively, centered at TSS compared between maternal and paternal alleles (N = number of genes in the group), (a) by plotting and comparing the distributions using boxplots and one-sided Wilcoxon rank-sum test (Data are presented as median values, interquartile range (IQR), and 1.5X IQR, CpG XCI Pat > Mat p-value = 0, GpC XCI Mat > Pat p-value = 1.9e-229 ), and (b) by density plots of the difference in methylation frequencies between the two alleles.
Extended Data Fig. 10. Differentially methylated and differentially accessible regions between alleles in GM12878.
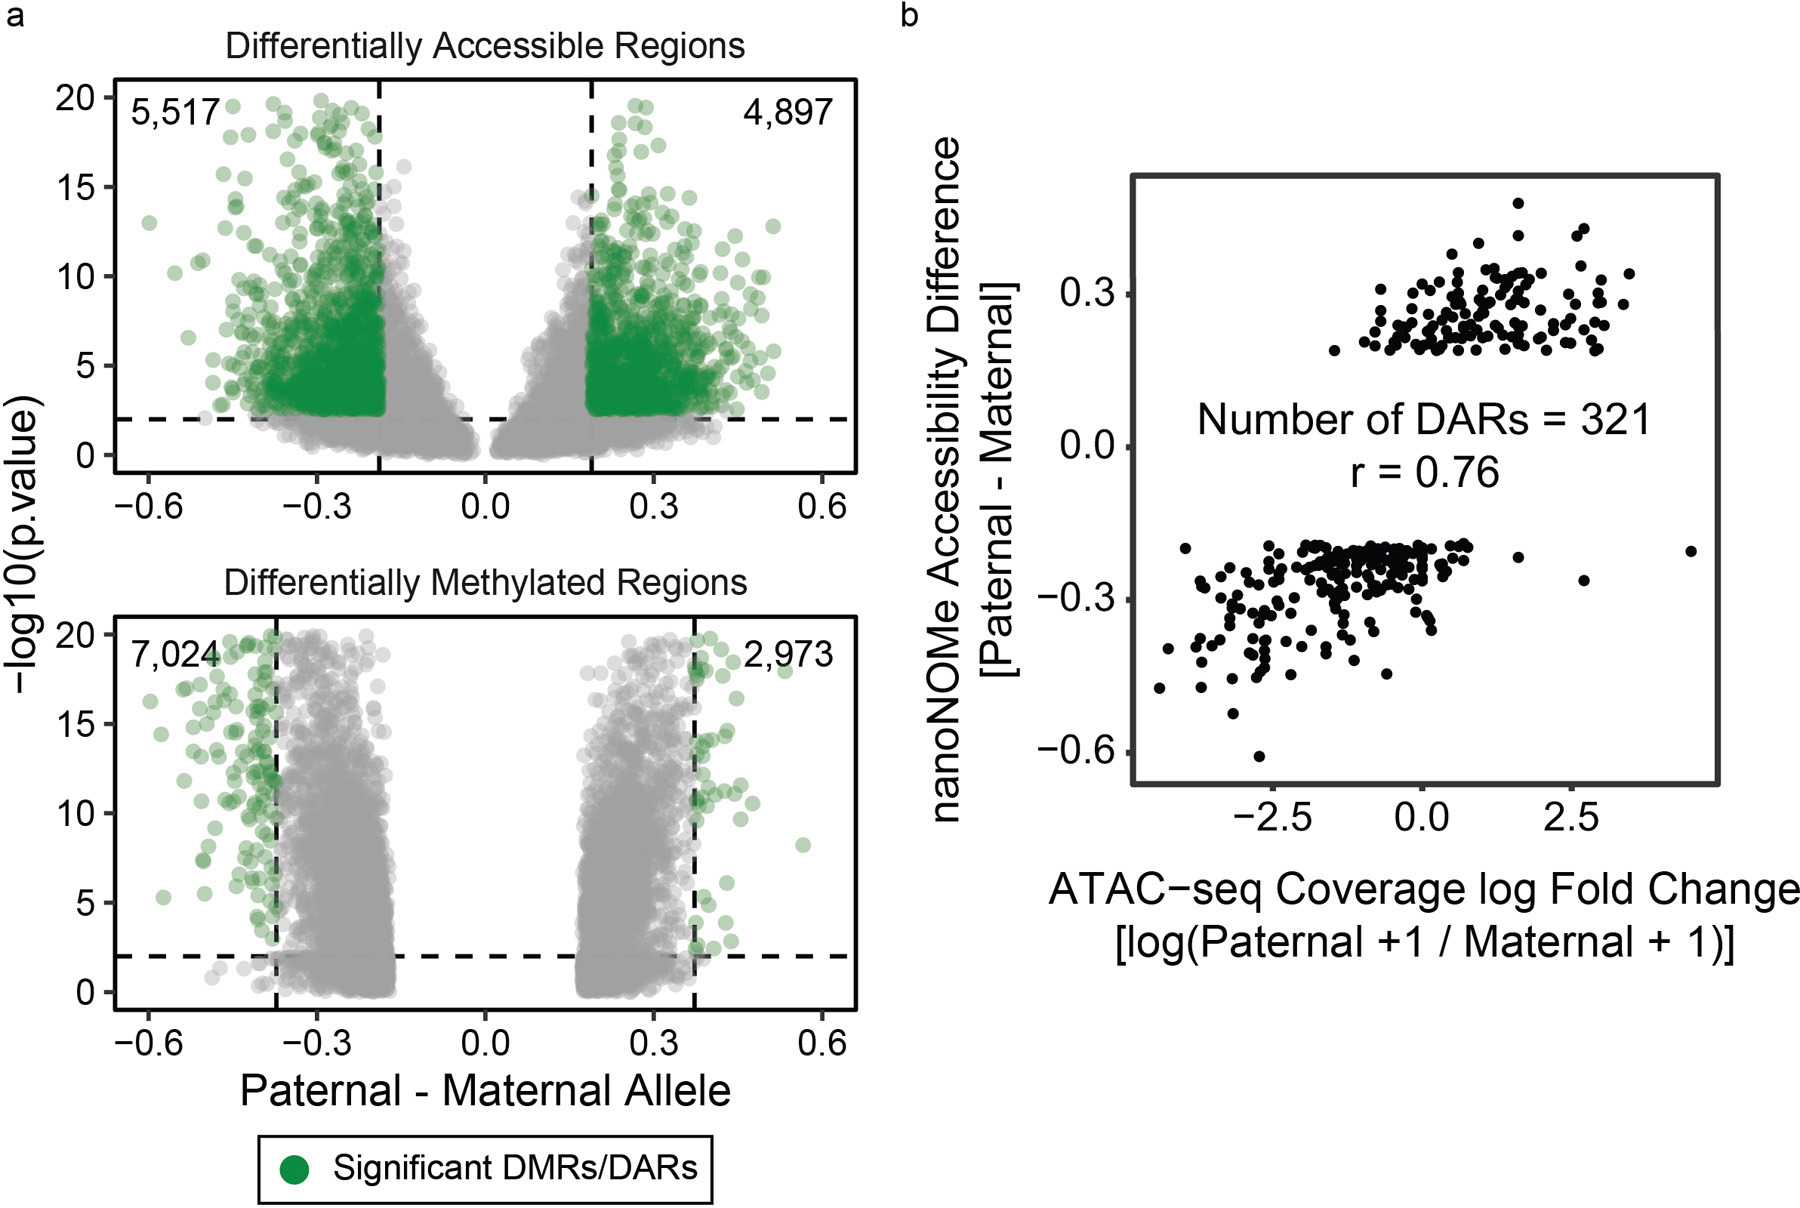
Methylation was compared between the two alleles across the genome to find regions of significant difference and were tested using one-sided Fisher’s exact test, and accessibility peaks were compared by 1) finding peaks of accessibility on each allele separately, 2) selecting peaks that occur exclusively in one allele, 3) and comparing the accessibility frequency between the two alleles in these candidate regions. The detected DMRs and DARs are (a) shown as volcano plots, with dashed lines representing thresholds for considering the region as DMR/DAR. (b) Examining existing (GEO Accession GSM1155957) ATAC-seq data, we compared allele specific accessible in ATAC-seq peaks that overlapped with a heterozygous SNP. In the 321 DARs detectable via ATAC-seq, we saw high correlation with nanoNOMe (r=0.76).
Supplementary Material
Supplementary Data 1: nanoNOMe accessibility peaks in GM12878
Supplementary Data 2: CTCF binding sites in GM12878
Supplementary Data 3: Estimated protein-bound regions near a subset of gene TSS in GM12878
Supplementary Data 4: Protein binding stratified by promoter epigenetic signatures
Supplementary Data 5: Allele-specific DMRs and DARs in GM12878
Supplementary Data 6: Gene promoter regions with allele-specific DMRs and DARs in GM12878
Supplementary Data 7: Heterozygous structural variations in GM12878
Supplementary Data 8: DMRs and DARs in MCF-7 and MDAMB-231 in comparison to MCF-10A
Supplementary Data 9: Summary of DMRs and DARs with respect to genomic contexts and structural variations
Supplementary Data 10: Structural variations in MCF-10A, MCF-7, and MDA-MB-231
Supplementary Data 11: Promoter epigenetic signatures of differentially expressed genes in MCF-10A, MCF-7, and MDA-MB-231
Supplementary Data 12: Protein binding regions near differentially expressed genes in MCF-10A, MCF-7, and MDA-MB-231
Acknowledgements
This study was supported by National Human Genome Research Institute (NHGRI project 5R01HG009190).
Footnotes
Competing Interests
WT has two patents (8,748,091 and 8,394,584) licensed to ONT. IL, TG, NS, FS, JTS and WT have received travel funds to speak at symposia organized by ONT. JTS received research funding from ONT.
Code Availability
Source code for analysis is available at https://github.com/timplab/nanoNOMe.
Data Availability
NanoNOMe data of GM12878, MCF-10A, MCF-7, and MDA-MB-231 are available at NCBI Bioproject ID PRJNA510783 (http://www.ncbi.nlm.nih.gov/bioproject/510783). Processed single-read data in select regions are deposited in Zenodo (https://zenodo.org/record/3969567) and processed methylation frequency files are available in GEO accession GSE155791.
References
- 1.Boyle AP et al. High-resolution mapping and characterization of open chromatin across the genome. Cell 132, 311–322 (2008). [DOI] [PMC free article] [PubMed] [Google Scholar]
- 2.Buenrostro JD, Giresi PG, Zaba LC, Chang HY & Greenleaf WJ Transposition of native chromatin for fast and sensitive epigenomic profiling of open chromatin, DNA-binding proteins and nucleosome position. Nat. Methods 10, 1213–1218 (2013). [DOI] [PMC free article] [PubMed] [Google Scholar]
- 3.Kelly TK et al. Genome-wide mapping of nucleosome positioning and DNA methylation within individual DNA molecules. Genome Res 22, 2497–2506 (2012). [DOI] [PMC free article] [PubMed] [Google Scholar]
- 4.Clark SJ et al. scNMT-seq enables joint profiling of chromatin accessibility DNA methylation and transcription in single cells. Nat. Commun 9, 781 (2018). [DOI] [PMC free article] [PubMed] [Google Scholar]
- 5.Lai B et al. Principles of nucleosome organization revealed by single-cell micrococcal nuclease sequencing. Nature 562, 281–285 (2018). [DOI] [PMC free article] [PubMed] [Google Scholar]
- 6.Satpathy AT et al. Massively parallel single-cell chromatin landscapes of human immune cell development and intratumoral T cell exhaustion. Nat. Biotechnol 37, 925–936 (2019). [DOI] [PMC free article] [PubMed] [Google Scholar]
- 7.Simpson JT et al. Detecting DNA cytosine methylation using nanopore sequencing. Nat. Methods 14, 407–410 (2017). [DOI] [PubMed] [Google Scholar]
- 8.Rand AC et al. Mapping DNA methylation with high-throughput nanopore sequencing. Nat. Methods 14, 411–413 (2017). [DOI] [PMC free article] [PubMed] [Google Scholar]
- 9.Shipony Z et al. Long-range single-molecule mapping of chromatin accessibility in eukaryotes. Nat. Methods 17, 319–327 (2020). [DOI] [PMC free article] [PubMed] [Google Scholar]
- 10.Wang Y et al. Single-molecule long-read sequencing reveals the chromatin basis of gene expression. Genome Res 29, 1329–1342 (2019). [DOI] [PMC free article] [PubMed] [Google Scholar]
- 11.Stergachis AB, Debo BM, Haugen E, Churchman LS & Stamatoyannopoulos JA Single-molecule regulatory architectures captured by chromatin fiber sequencing. Science 368, 1449–1454 (2020). [DOI] [PubMed] [Google Scholar]
- 12.Abdulhay NJ et al. Massively multiplex single-molecule oligonucleosome footprinting. bioRxiv 2020.05.20.105379 (2020) doi: 10.1101/2020.05.20.105379. [DOI] [PMC free article] [PubMed] [Google Scholar]
- 13.ENCODE Project Consortium. An integrated encyclopedia of DNA elements in the human genome. Nature 489, 57–74 (2012). [DOI] [PMC free article] [PubMed] [Google Scholar]
- 14.Jain M et al. Nanopore sequencing and assembly of a human genome with ultra-long reads. Nat. Biotechnol 36, 338–345 (2018). [DOI] [PMC free article] [PubMed] [Google Scholar]
- 15.Olova N et al. Comparison of whole-genome bisulfite sequencing library preparation strategies identifies sources of biases affecting DNA methylation data. Genome Biol 19, 33 (2018). [DOI] [PMC free article] [PubMed] [Google Scholar]
- 16.Ji L et al. Methylated DNA is over-represented in whole-genome bisulfite sequencing data. Front. Genet 5, 341 (2014). [DOI] [PMC free article] [PubMed] [Google Scholar]
- 17.Ziebarth JD, Bhattacharya A & Cui Y CTCFBSDB 2.0: a database for CTCF-binding sites and genome organization. Nucleic Acids Res 41, D188–94 (2013). [DOI] [PMC free article] [PubMed] [Google Scholar]
- 18.Gaffney DJ et al. Controls of nucleosome positioning in the human genome. PLoS Genet 8, e1003036 (2012). [DOI] [PMC free article] [PubMed] [Google Scholar]
- 19.Valouev A et al. Determinants of nucleosome organization in primary human cells. Nature 474, 516–520 (2011). [DOI] [PMC free article] [PubMed] [Google Scholar]
- 20.Hesselberth JR et al. Global mapping of protein-DNA interactions in vivo by digital genomic footprinting. Nat. Methods 6, 283–289 (2009). [DOI] [PMC free article] [PubMed] [Google Scholar]
- 21.Luscombe NM, Austin SE, Berman HM & Thornton JM An overview of the structures of protein-DNA complexes. Genome Biol 1, REVIEWS001 (2000). [DOI] [PMC free article] [PubMed] [Google Scholar]
- 22.Boyle AP et al. High-resolution genome-wide in vivo footprinting of diverse transcription factors in human cells. Genome Res 21, 456–464 (2011). [DOI] [PMC free article] [PubMed] [Google Scholar]
- 23.Fu Y, Sinha M, Peterson CL & Weng Z The insulator binding protein CTCF positions 20 nucleosomes around its binding sites across the human genome. PLoS Genet 4, e1000138 (2008). [DOI] [PMC free article] [PubMed] [Google Scholar]
- 24.Hartl D et al. CG dinucleotides enhance promoter activity independent of DNA methylation. Genome Res 29, 554–563 (2019). [DOI] [PMC free article] [PubMed] [Google Scholar]
- 25.Pinello L, Farouni R & Yuan G-C Haystack: systematic analysis of the variation of epigenetic states and cell-type specific regulatory elements. Bioinformatics 34, 1930–1933 (2018). [DOI] [PMC free article] [PubMed] [Google Scholar]
- 26.Fornes O et al. JASPAR 2020: update of the open-access database of transcription factor binding profiles. Nucleic Acids Res 48, D87–D92 (2020). [DOI] [PMC free article] [PubMed] [Google Scholar]
- 27.Gigante S et al. Using long-read sequencing to detect imprinted DNA methylation. Nucleic Acids Res 47, e46 (2019). [DOI] [PMC free article] [PubMed] [Google Scholar]
- 28.Eberle MA et al. A reference data set of 5.4 million phased human variants validated by genetic inheritance from sequencing a three-generation 17-member pedigree. Genome Res (2016) doi: 10.1101/gr.210500.116. [DOI] [PMC free article] [PubMed] [Google Scholar]
- 29.Cotton AM et al. Landscape of DNA methylation on the X chromosome reflects CpG density, functional chromatin state and X-chromosome inactivation. Hum. Mol. Genet 24, 1528–1539 (2015). [DOI] [PMC free article] [PubMed] [Google Scholar]
- 30.Hellman A & Chess A Gene body-specific methylation on the active X chromosome. Science 315, 1141–1143 (2007). [DOI] [PubMed] [Google Scholar]
- 31.Sharp AJ et al. DNA methylation profiles of human active and inactive X chromosomes. Genome Res 21, 1592–1600 (2011). [DOI] [PMC free article] [PubMed] [Google Scholar]
- 32.Jirtle RL Genomic imprinting and cancer. Exp. Cell Res 248, 18–24 (1999). [DOI] [PubMed] [Google Scholar]
- 33.Morison IM, Ramsay JP & Spencer HG A census of mammalian imprinting. Trends Genet 21, 457–465 (2005). [DOI] [PubMed] [Google Scholar]
- 34.Holliday DL & Speirs V Choosing the right cell line for breast cancer research. Breast Cancer Res 13, 215 (2011). [DOI] [PMC free article] [PubMed] [Google Scholar]
- 35.Messier TL et al. Histone H3 lysine 4 acetylation and methylation dynamics define breast cancer subtypes. Oncotarget 7, 5094 (2016). [DOI] [PMC free article] [PubMed] [Google Scholar]
- 36.Subik K et al. The Expression Patterns of ER, PR, HER2, CK5/6, EGFR, Ki-67 and AR by Immunohistochemical Analysis in Breast Cancer Cell Lines. Breast Cancer 4, 35–41 (2010). [PMC free article] [PubMed] [Google Scholar]
- 37.Sedlazeck FJ et al. Accurate detection of complex structural variations using single-molecule sequencing. Nat. Methods 15, 461–468 (2018). [DOI] [PMC free article] [PubMed] [Google Scholar]
- 38.Jeffares DC et al. Transient structural variations have strong effects on quantitative traits and reproductive isolation in fission yeast. Nat. Commun 8, 14061 (2017). [DOI] [PMC free article] [PubMed] [Google Scholar]
- 39.Miga KH et al. Telomere-to-telomere assembly of a complete human X chromosome. Nature (2020) doi: 10.1038/s41586-020-2547-7. [DOI] [PMC free article] [PubMed] [Google Scholar]
Online Methods References
- 40.Krueger F & Andrews SR Bismark: a flexible aligner and methylation caller for Bisulfite-Seq applications. Bioinformatics 27, 1571–1572 (2011). [DOI] [PMC free article] [PubMed] [Google Scholar]
- 41.Hansen KD, Langmead B & Irizarry RA BSmooth: from whole genome bisulfite sequencing reads to differentially methylated regions. Genome Biol 13, R83 (2012). [DOI] [PMC free article] [PubMed] [Google Scholar]
- 42.Scrucca L, Fop M, Murphy TB & Raftery AE mclust 5: Clustering, Classification and Density Estimation Using Gaussian Finite Mixture Models. R J 8, 289–317 (2016). [PMC free article] [PubMed] [Google Scholar]
- 43.Patterson M et al. WhatsHap: Weighted Haplotype Assembly for Future-Generation Sequencing Reads. J. Comput. Biol 22, 498–509 (2015). [DOI] [PubMed] [Google Scholar]
- 44.Love MI, Huber W & Anders S Moderated estimation of fold change and dispersion for RNA-seq data with DESeq2. Genome Biol 15, 550 (2014). [DOI] [PMC free article] [PubMed] [Google Scholar]
Associated Data
This section collects any data citations, data availability statements, or supplementary materials included in this article.
Supplementary Materials
Supplementary Data 1: nanoNOMe accessibility peaks in GM12878
Supplementary Data 2: CTCF binding sites in GM12878
Supplementary Data 3: Estimated protein-bound regions near a subset of gene TSS in GM12878
Supplementary Data 4: Protein binding stratified by promoter epigenetic signatures
Supplementary Data 5: Allele-specific DMRs and DARs in GM12878
Supplementary Data 6: Gene promoter regions with allele-specific DMRs and DARs in GM12878
Supplementary Data 7: Heterozygous structural variations in GM12878
Supplementary Data 8: DMRs and DARs in MCF-7 and MDAMB-231 in comparison to MCF-10A
Supplementary Data 9: Summary of DMRs and DARs with respect to genomic contexts and structural variations
Supplementary Data 10: Structural variations in MCF-10A, MCF-7, and MDA-MB-231
Supplementary Data 11: Promoter epigenetic signatures of differentially expressed genes in MCF-10A, MCF-7, and MDA-MB-231
Supplementary Data 12: Protein binding regions near differentially expressed genes in MCF-10A, MCF-7, and MDA-MB-231
Data Availability Statement
NanoNOMe data of GM12878, MCF-10A, MCF-7, and MDA-MB-231 are available at NCBI Bioproject ID PRJNA510783 (http://www.ncbi.nlm.nih.gov/bioproject/510783). Processed single-read data in select regions are deposited in Zenodo (https://zenodo.org/record/3969567) and processed methylation frequency files are available in GEO accession GSE155791.