Abstract
To achieve a comprehensive understanding of brain function requires multiple imaging modalities with complementary strengths. We present an approach for concurrent wide-field optical and functional MRI. By merging these modalities, we can simultaneously acquire whole-brain blood oxygen level-dependent (BOLD) and whole-cortex calcium-sensitive fluorescent measures of brain activity. In a transgenic murine model, we show that calcium predicts the BOLD signal, using a model that optimizes a Gamma-variant transfer function. We find consistent predictions across the cortex, which are best at low frequency (0.009–0.08Hz). Furthermore, we show that the relationship between modality connectivity strengths varies by region. Our approach links cell type- specific optical measurements of activity to the most widely used method for assessing human brain function.
INTRODUCTION
To study the organizational principles that govern brain function, a wide array of tools has been developed. Each tool has strengths that offer insight into specific aspects of brain function, but also experimental tradeoffs. In pursuit of linking different measures of activity, complementary techniques can be combined. We present a system for performing simultaneous mesoscopic calcium (Ca2+) and functional magnetic resonance imaging (fMRI) in mice.
With genetically encoded or virally mediated expression of Ca2+ indicators, the concerted activity of cells across a large field of view (FOV) can be examined using wide-field “mesoscopic” Ca2+ imaging (1). The resulting signal constitutes a cell type-specific measurement of activity as Ca2+ sensors can be genetically targeted (1). During mesoscopic imaging, neuropil is the dominant signal source (2). However, Ca2+ imaging is limited to optically accessible tissue, and the expression of Ca2+ indicators necessitates invasive manipulation of the nervous system, practically limiting its application to animal models. Nevertheless, the ability to label specific cell types, and the high spatial and temporal resolution of the signal make this approach informative when studying brain function.
Functional MRI provides a non-invasive measure of activity in both humans and animals with whole-brain coverage. However, fMRI has relatively low spatial and temporal resolution, and relies on an indirect and indiscriminate index of activity through a blood oxygen level-dependent (BOLD) contrast mechanism (3).Despite the indirect and non-specific nature of the BOLD signal, there is a clear relationship between neural activity and changes in BOLD signal across species (4; 5). Despite the complexity of the BOLD signal, the whole-brain coverage, intrinsic contrast, and ability to perform measurements in both animals and humans make this approach a prominent tool in neuroscience. Therefore, a better understanding of the cellular origins of the BOLD signal stands to have a major impact on the interpretation of fMRI studies.
Despite the success of Ca2+ and fMR imaging individually, technical challenges have prohibited applying these techniques in combination. We implement these methods simultaneously and describe the innovations that enable us to collect these data longitudinally in mice. We show that trial-to-trial variations in elicited response magnitude are correlated across modalities, which adds to the growing evidence for a common underlying neural source and demonstrates the high sensitivity of our method. We test a gamma-variate fit-based convolution model (6) and show that a third of spontaneous BOLD activity can be predicted from simultaneously recorded Ca2+ signal from excitatory neurons. We find that across the cortex the predicted parameters are consistent, and that a low-frequency bandwidth (0.009–0.08Hz) matches better than higher bandwidths.
Next, we show that functional parcellation of the cortex based on connectivity derived from spontaneous activity are consistent across modalities, which provides further validation of functional connectivity, as measured with fMRI (7; 8). Finally, we show that the relationship between connectivity strengths derived from Ca2+ activity in excitatory neurons and BOLD signal depends on the function of a given brain region. We assert that this regional functional dependence provides evidence that BOLD connectivity arises from concerted neural activity across different cell populations. Together, these results support the notion that our approach relates cell-specific activity to the signals measured via BOLD activity.
RESULTS
Simultaneous Ca2+ and MR imaging
Wide-field Ca2+ imaging is typically performed with a conventional microscope and camera positioned directly above the animal. To enable multi-modal imaging, we designed the optical set-up to work within the confined space and high magnetic field of the MRI scanner (Fig. 1a). This included customized optics and radio frequency (RF) MRI hardware.
Fig. 1. Experimental setup for simultaneous mesoscopic Ca2+ and MR imaging.
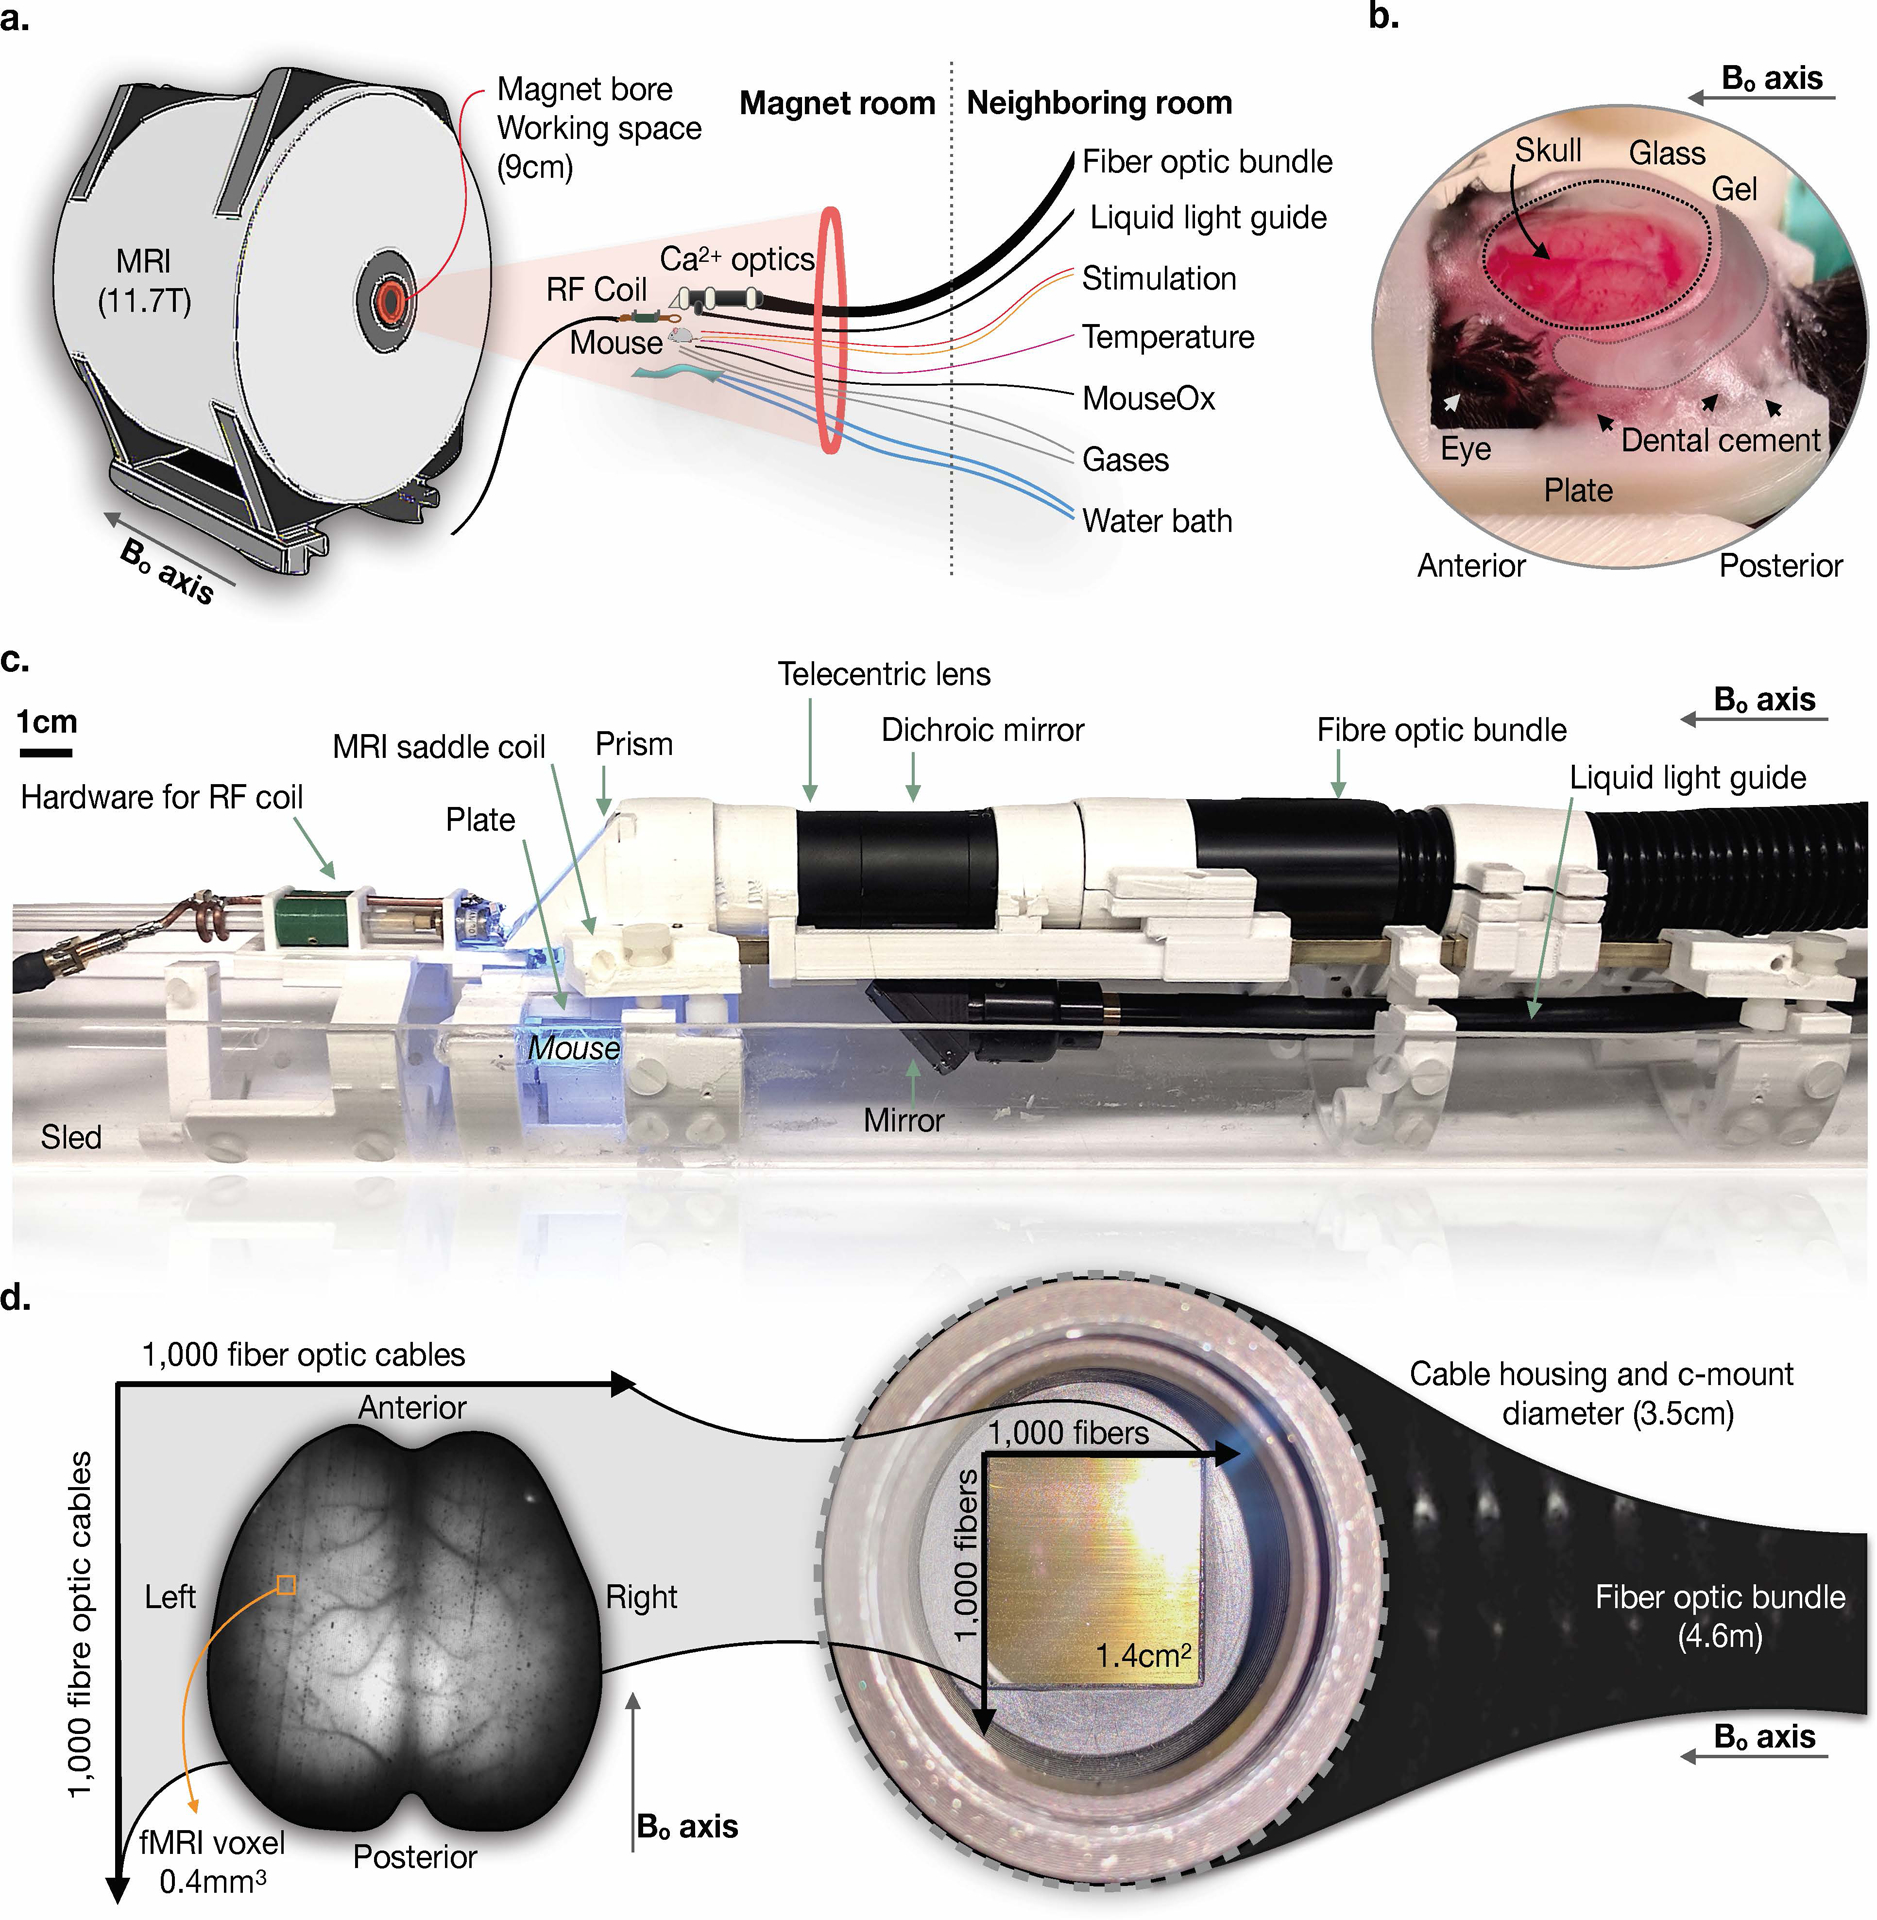
a) Overview of the components of the imaging set-up, which include an 11.7T, 9cm bore MR scanner, into which we insert the optical components for Ca2+ signal acquisition, MRI coil, animal, and physiological monitoring and maintenance equipment. The Ca2+ imaging data is recorded by a CCD camera connected to a computer housed in a room adjacent to the scanner. A 4.6m long fiber optic bundle relays the Ca2+ signal from within the magnet to the CCD camera. b) Surgical window preparation for acute imaging. The preparation is secured to a plate that cradles the sides of the skull and attaches to the skull above the olfactory bulb. c) Photograph of the assembled dual-imaging apparatus. The plate shown in b) is fixed to the MRI coil below the Ca2+ imaging hardware. d) A raw Ca2+ image captured using the set-up shown in a) and c). A fiber optic bundle containing ~2 million fibers is used to obtain a FOV spanning the optically exposed FOV.
We performed Ca2+ imaging on transgenic mice expressing GCaMP6f in cortical excitatory neurons (Slc17a7-Cre/Camk2a-tTA/Ai93). Note that our approach should be suitable for any mouse line with a sufficiently bright fluorescent signal.
We introduce two surgical preparations, one acute and one for chronic experiments. Both are optimized to reduce fMRI signal loss due to magnetic susceptibility effects without compromising fluorescent signal transmission. For acute preparations, we built a dental cement ‘well’ along the circumference of the clean and intact skull surface, which we filled with an MRI compatible transparent gel and sealed with glass (Fig. 1b) to create a smooth optically transparent surface (9; 10; 11). The gel allows the skull to be optically exposed, while minimizing MR susceptibility effects as this eliminates an air-tissue interface. For chronic preparations, we performed the same steps, with the addition of skull-thinning and the replacement of gel with transparent dental cement. For both preparations, we fixed the skull to a holder that dovetails with an RF coil and the optical imaging apparatus (Fig. 1c). The coil is saddle-shaped to avoid obstructing the optical FOV and to optimize MR sensitivity (Extended Data Fig. 1).
We performed optical imaging with a heavily modified telecentric lens. The primary modification is the replacement of all metal parts with non-conducting plastic (Extended Data Fig. 2). A key feature of the setup is a coherent fiber-optic bundle that relays the fluorescent signal from within the scanner to a camera housed in an adjacent room (Fig. 1d).
Our device is different from previous implementations combining MRI with fluorescence imaging. Typically, only single fibers have been used to measure fluorescence from one or more regions-of-interest (ROIs) (4; 12; 13; 14; 15; 16). Here, we obtain movies (FOV: 14.5×14.5mm2, resolution: 25×25μm2) of Ca2+ fluorescence spanning most of the mouse cortex. However, in a related approach a fiber array was introduced into the MR environment (11; 10). Although there are similarities, the optical coverage with our device is greater, and we implement the technology using mice, not rats.
We secure our set-up within an 11.7T preclinical magnet, but this design can be scaled for larger animals and bore sizes.
To assess the optical signal-to-noise ratio (SNR), we conducted three weekly dual-imaging sessions, and an additional optical-only session outside of the scanner using commercially available equipment in mice that underwent chronic window preparations. Overall, we observe no gross differences in SNR. The stimulus response magnitude observed with the dual-imaging system and with commercially available equipment shows no difference (Supplementary Fig. 1). Furthermore, there is no difference in stimulus response magnitude between three weekly dual-imaging sessions following a chronic preparation with skull thinning. For the cyan wavelength (Ca2+-sensitive contrast) imaging two or three weeks after surgery (with thinning) improves in-scanner SNR relative to 7 days after surgery (with thinning) (P=0.0003 and P=0.0447 respectively, t-test) or at two weeks after surgery (with thinning) compared to an acute preparation (without thinning) (P=0.0214, t-test). The SNR of data collected outside of the magnet using commercially available equipment (with thinning) provides higher SNR than data collected after an acute preparation (without thinning) (P=0.0001, t-test), or data collected in-scanner at one (P=0.0001, t-test), two (P=0.0019, t-test) or three (P=0.0001, t-test) weeks after a chronic preparation (with thinning). Notably, the variance in SNR at one, two or three weeks after surgery (with thinning) collected in-scanner is lower than in data collected subsequently outside of the magnet using commercially available equipment (P=0.0015, P=0.0001, and P=0.0000 respectively, f-test) (Supplementary Fig. 2).
Multi-modal acquisition and image registration
We record optical and fMR images (Fig. 2a) together with physiological data (heart rate, breath rate, arterial oxygen saturation and rectal temperature) (Supplementary Fig. 3). At the start of each fMRI volume acquisition (TR=1000ms, 1Hz, 0.4×0.4×0.4mm3), a TTL pulse from the scanner triggers the capture of 20 optical frames (20Hz). We process fluorescence and fMRI data using standard procedures, including motion correction, hemodynamic correction, bandpass filtering, drift correction and global signal regression (Extended Data Fig. 3).
Fig. 2. Registration pipeline for simultaneously acquired Ca2+ and MRI data.
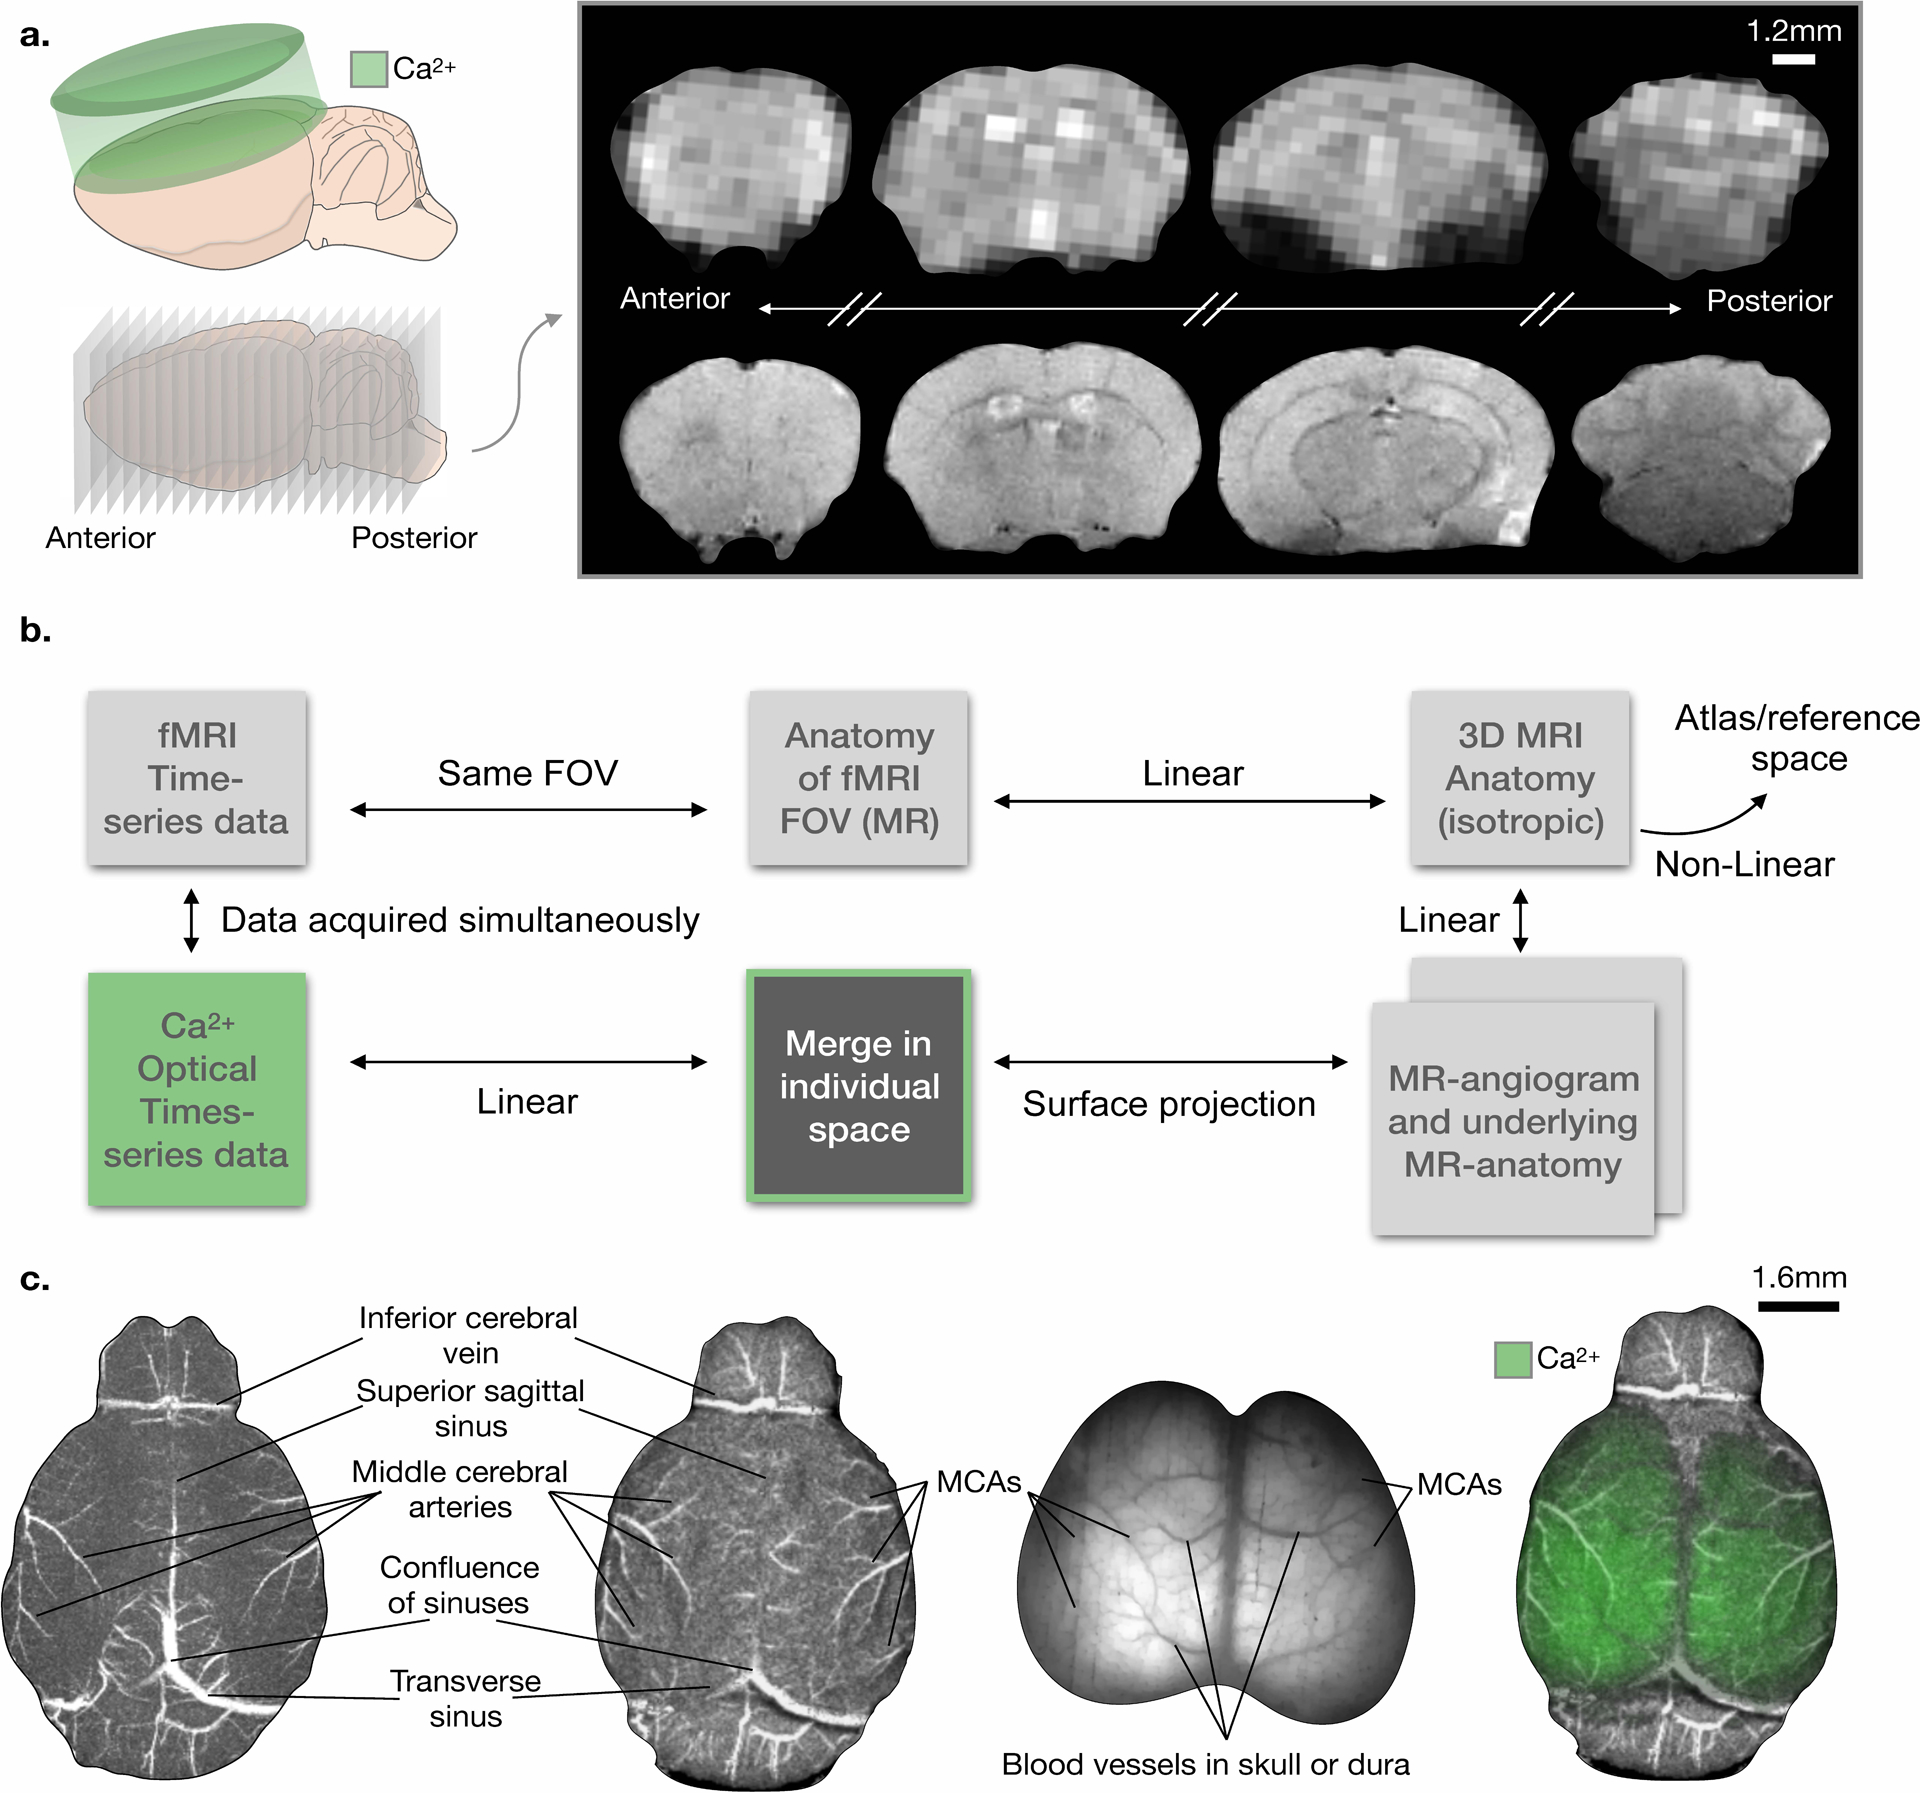
a) Cartoons depicting the Ca2+ (top left) and fMRI (bottom left) acquisitions. Sample MR functional (top right) and structural (bottom right) images. b) Overview of the multi-modal image acquisition and registration pipeline. In addition to the simultaneously acquired Ca2+ and fMRI data, we acquire a high in-plane resolution image of the fMRI FOV, an isotropic anatomical MRI of the whole brain, a TOF MR-angiogram, and a high-resolution anatomical image of the tissue within the angiogram FOV. The functional and structural MRI data are registered in ‘individual space’, and then, using non-linear registration, to reference space. c) Steps in the registration pipeline illustrating the use of surface vessels as anatomical landmarks. Left: MR angiogram. Center left: surface projection. Center right: Ca2+ image. Right: merged image. Vessels used for registration are indicated in the images.
We co-register Ca2+ (2D surface) and fMR (3D volume) images using the vascular anatomy on the surface of the cortex as reference landmarks (Fig. 2b). The vessels are visible in the optical images and in a time-of-flight (TOF) MR angiogram without the administration of an exogenous contrast agent. In addition, registration uses an anatomical MR image with high in-plane resolution that matches the fMRI prescription (i.e. they are of the same anatomy), an isotropic anatomical whole-brain MR image, and a MR image of the brain tissue within the FOV of the MR angiogram (Fig. 2). We combine the latter image and the angiogram to obtain one MR projection (2D) that recapitulates the surface of the mouse brain (Fig. 2c, Extended Data Fig. 4). For each mouse, we registered all the MRI data together to create the ‘animal’s reference space’. From there, we register the isotropic anatomical image to a common space and an atlas (17). Finally, we register the Ca2+ image to the MR surface projection, thereby moving all the multi-modal data into the same space. We perform all image registration using BioImageSuite Web (www.bioimagesuite.org) using customized modules developed for this purpose.
Evoked multi-modal Ca2+ and fMRI responses
We demonstrate the sensitivity of our approach by imaging evoked responses upon unilateral hind-paw electrical stimulation (Fig. 3, Extended Data Fig. 5) (18). The stimulus ON duration (5 seconds) is shorter than typical for MR experiments to conform with optical imaging literature (19; 20). With a generalized linear model, we identify responding regions for both modalities. We observe that responding regions across modalities do not completely overlap (Extended Data Fig. 6). This is likely a function of statistical threshold and physiological differences between contrast mechanisms. We would not expect these measurements to be identical given the specificity of the Ca2+ signal to excitatory neurons and the non-specificity of fMRI. Furthermore, BOLD responses are maximal spatially downstream of the activation (21). Finally, we collect fMRI contrast in 3D, whereas Ca2+ data is integrated across an uncertain depth (22; 6).
Fig. 3. Spontaneous fluctuations of evoked Ca2+ and fMRI signals.
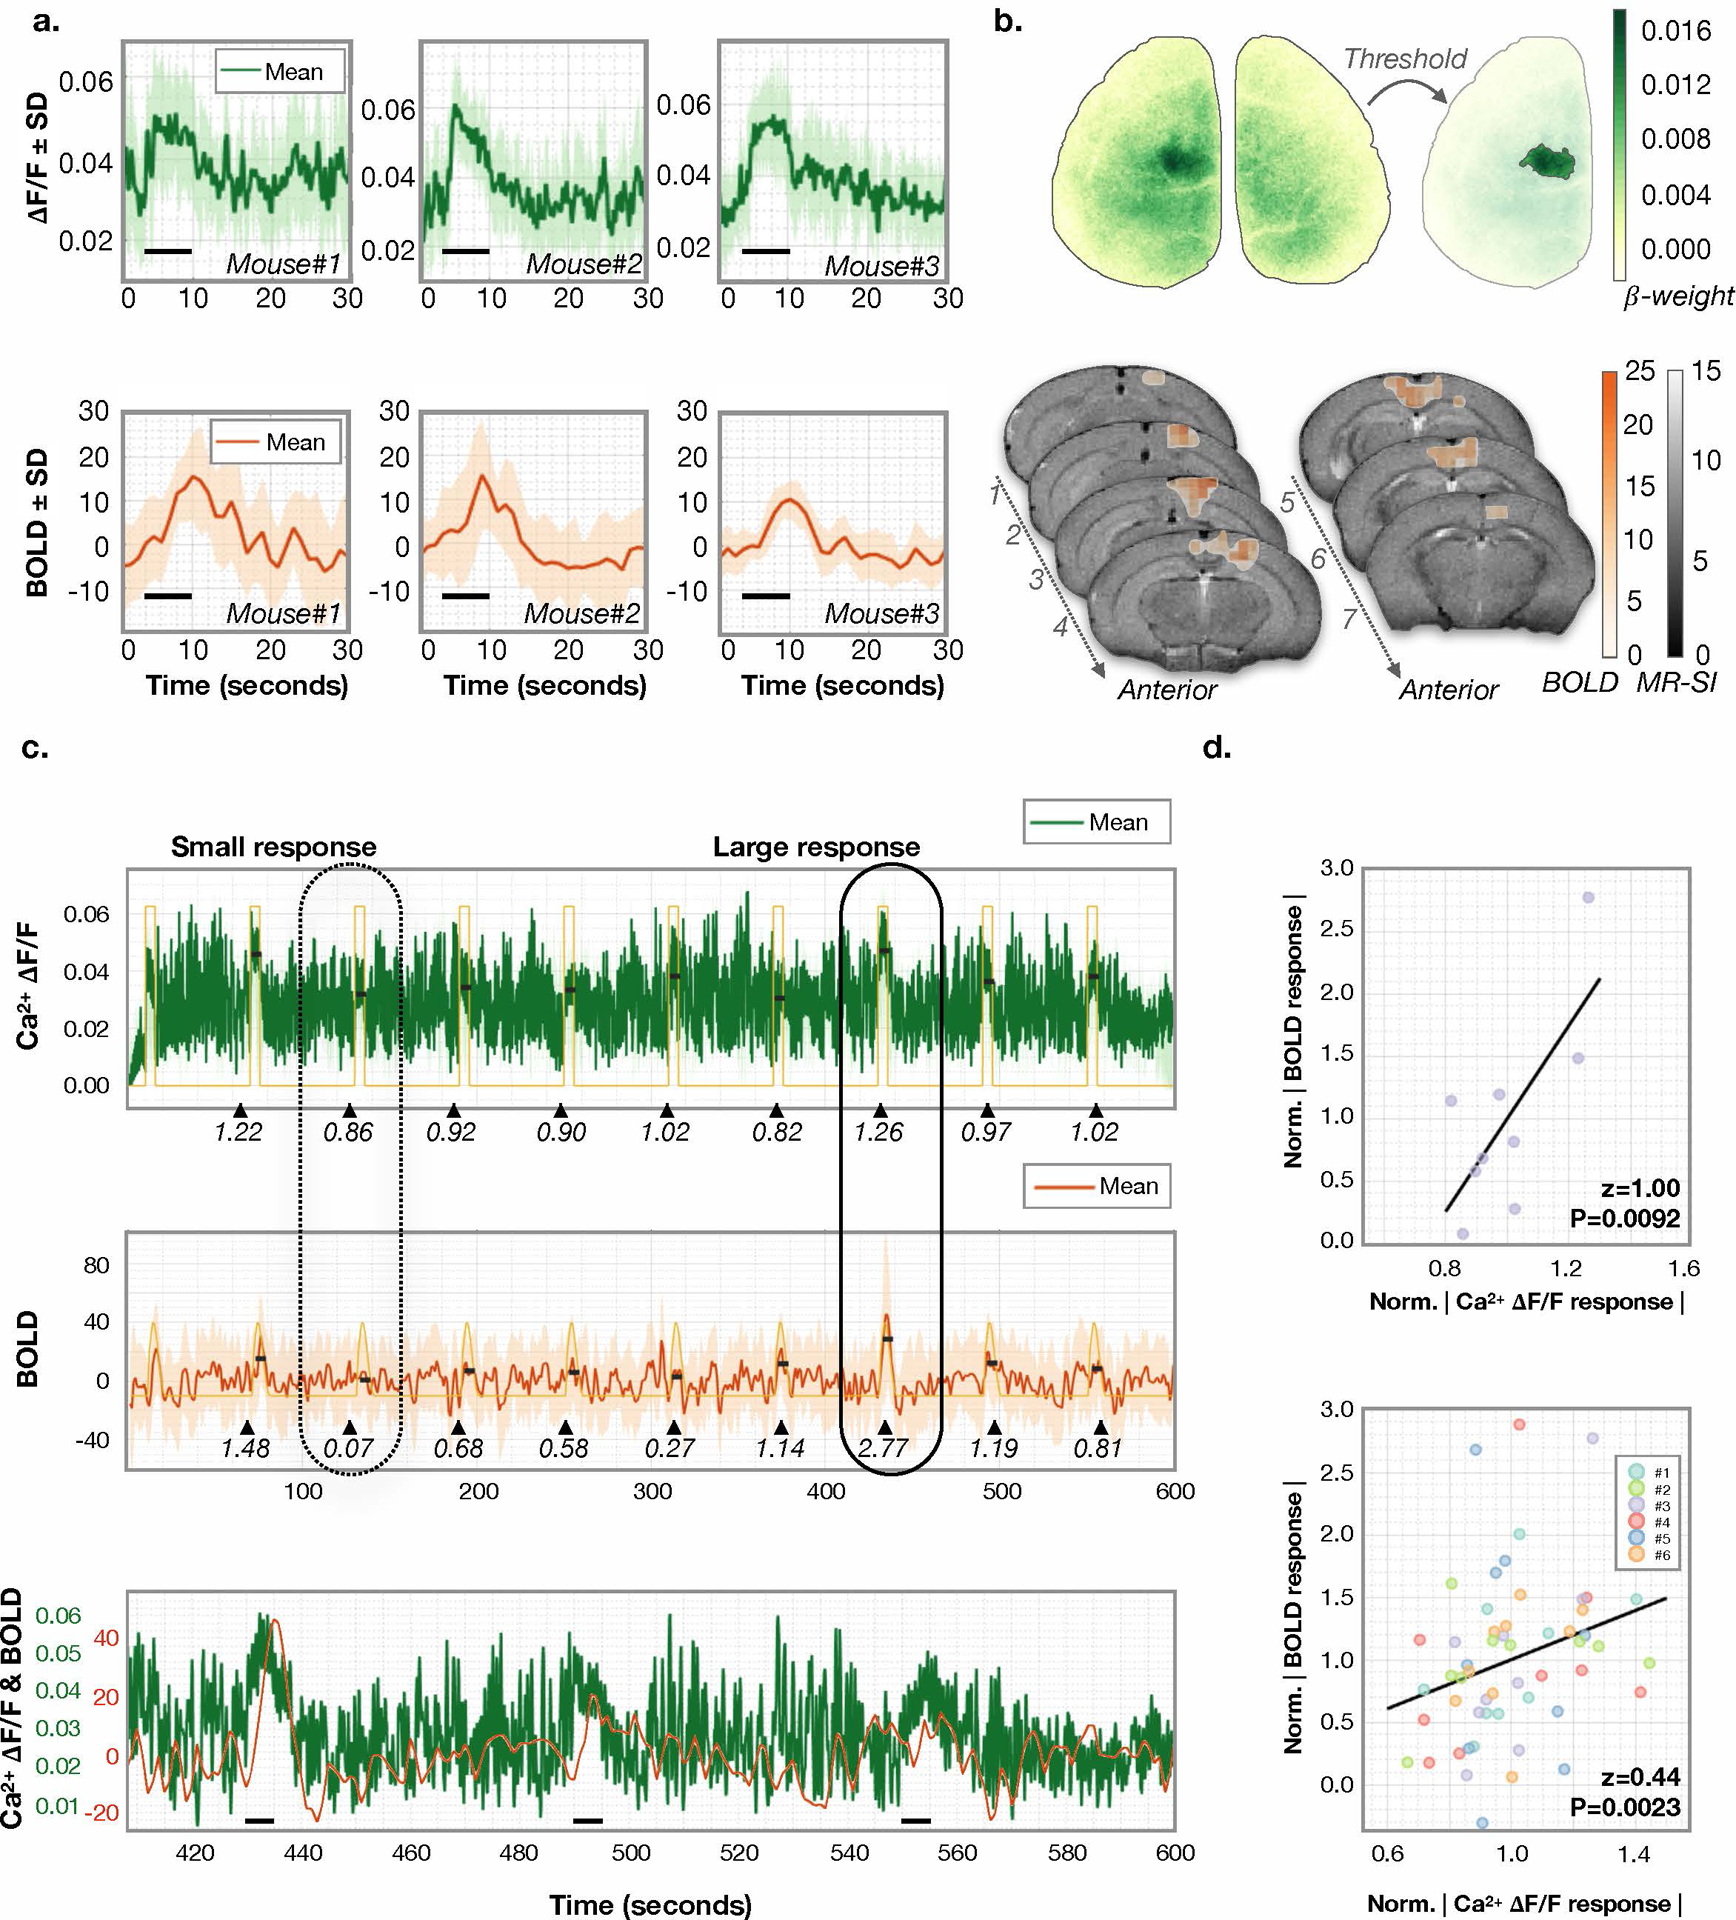
a) Evoked responses to unilateral hind-paw stimulation. The average Ca2+ (top row) and fMRI (bottom row) responses (to N=9 stimuli) for three example mice are plotted. ROIs were determined using standard generalized linear modeling. The stimulus ON time is denoted by a black line. The fMRI signal is normalized to the mean. The SD across stimulus presentations is shaded. b) Ca2+ (top) and fMRI (bottom) ROI data for Mouse #2. c) Average response for Ca2+ (top) and fMRI (middle) of an example mouse is plotted over a 10-minute interval encompassing N=9 stimuli. Data are averaged spatially. Yellow: boxcar (top) and HRF (middle) from the GLM models. Bottom: zoomed-in section of the fMRI signal trace. Small (dashed line) and large (solid line) amplitude responses are circled to indicate coincident fluctuations in amplitude. Peak amplitude response estimated by averaging the signal from the peak until three seconds after the peak are shown by black lines at the level of each estimated response amplitude. The normalized response amplitude (relative to the mean signal) is written beneath each response (black triangles denote stimuli onset). d) Correlation for the normalized Ca2+ and fMRI response amplitudes in Mouse #3 are z=1.00 P=0.009 (top). Across all 6 mice (n=9 responses per mouse), the correlations are z=0.44, P=0.0023 (bottom). No adjustment was made for multiple comparisons. P-values are from Fisher’s Z transformed Pearson’s correlation, which tests the null hypothesis that a correlation does not exist.
We quantify individual response amplitudes as the average signal within the responding regions and define the time-to-peak (TTP) from one acquisition (10 minutes of data including 9 stimuli) from each of six mice (Ca2+ 0.6 ± 0.03 seconds, and fMRI 4.7 ± 0.5 seconds, mean ± standard deviation (SD), Supplementary Fig. 7). Previous work demonstrated that changing stimulus parameters such as strength or duration modulates response magnitude (12). Without changing the stimulus parameters however, fluctuations still appear in both modalities. We observe that evoked response amplitudes to individual identical stimuli are correlated between modalities (Fisher’s Z transformed, Pearson’s correlation, z=0.44 P<0.003, Fig. 3). This extends previous work by suggesting that such fluctuations are not measurement noise but real variations in the response and demonstrates that the quality of the data from both modalities is sufficient to measure individual events.
Transfer function between Ca2+ and BOLD signals
We estimate a convolution kernel that, when convolved with Ca2+ signal, approximates BOLD activity, using an approach previously proposed (6). This method optimizes a three-parameter (amplitude, time-of-peak, and width-of-peak) gamma-variate function, using minimized least-squares error, to approximate a hemodynamic response function (HRF) (6). We estimate the goodness of fit using Fisher’s Z transformed Pearson’s correlation. We apply this approach using the average signal within the ROIs that respond to hind-paw stimulation. Across N=6 mice, we obtain z=0.36 ± 0.20 (mean ± SD) using unfiltered data (Extended Data Fig. 7). Fitting improves this value to z=0.48 ± 0.19 (Extended Data Fig. 7b) when data are filtered (0.04–0.1Hz, Butterworth) compared to unfiltered data (MATLAB, ttest, P=0.0128) (6). From this, we conclude that BOLD activity is coupled to excitatory neurons residing within functionally defined ROIs.
In the remaining sections, we present results obtained during spontaneous activity. We register the imaging data from N=6 mice to a down sampled version of the Allen Atlas (Supplementary Fig. 8). Within each of n=18 ROIs, we apply the convolution kernel approach we used previously (Fig. 4) (6). Using filtered data (0.04–0.1Hz), we find that across ROIs, scans and mice, the correlation between BOLD signals and Ca2+ signals after convolution with the optimized HRF is z=0.53 ± 0.23 (Fig. 4, Extended Data Fig. 8). Further, we find this relationship is consistent across the duration of each scan and across bandwidths (Extended Data Fig. 8) (6; 23; 24; 25). We obtain the highest correlation using the lowest band (0.009–0.08Hz) consistent with previous studies (23)(25) (Fox, Snyder, Vincent, Corbetta, Van Essen, & Raichle, 2005). We examine the spatial distribution of the three predicted parameters (amplitude, time-of-peak, and width-of-peak) (Fig. 4e). Overall, across the cortex, up to 30 ± 9% of the variance in BOLD activity is accounted for by excitatory cell activity during rest.
Fig. 4. Gamma-variate convolution model applied within Allen Atlas ROIs.
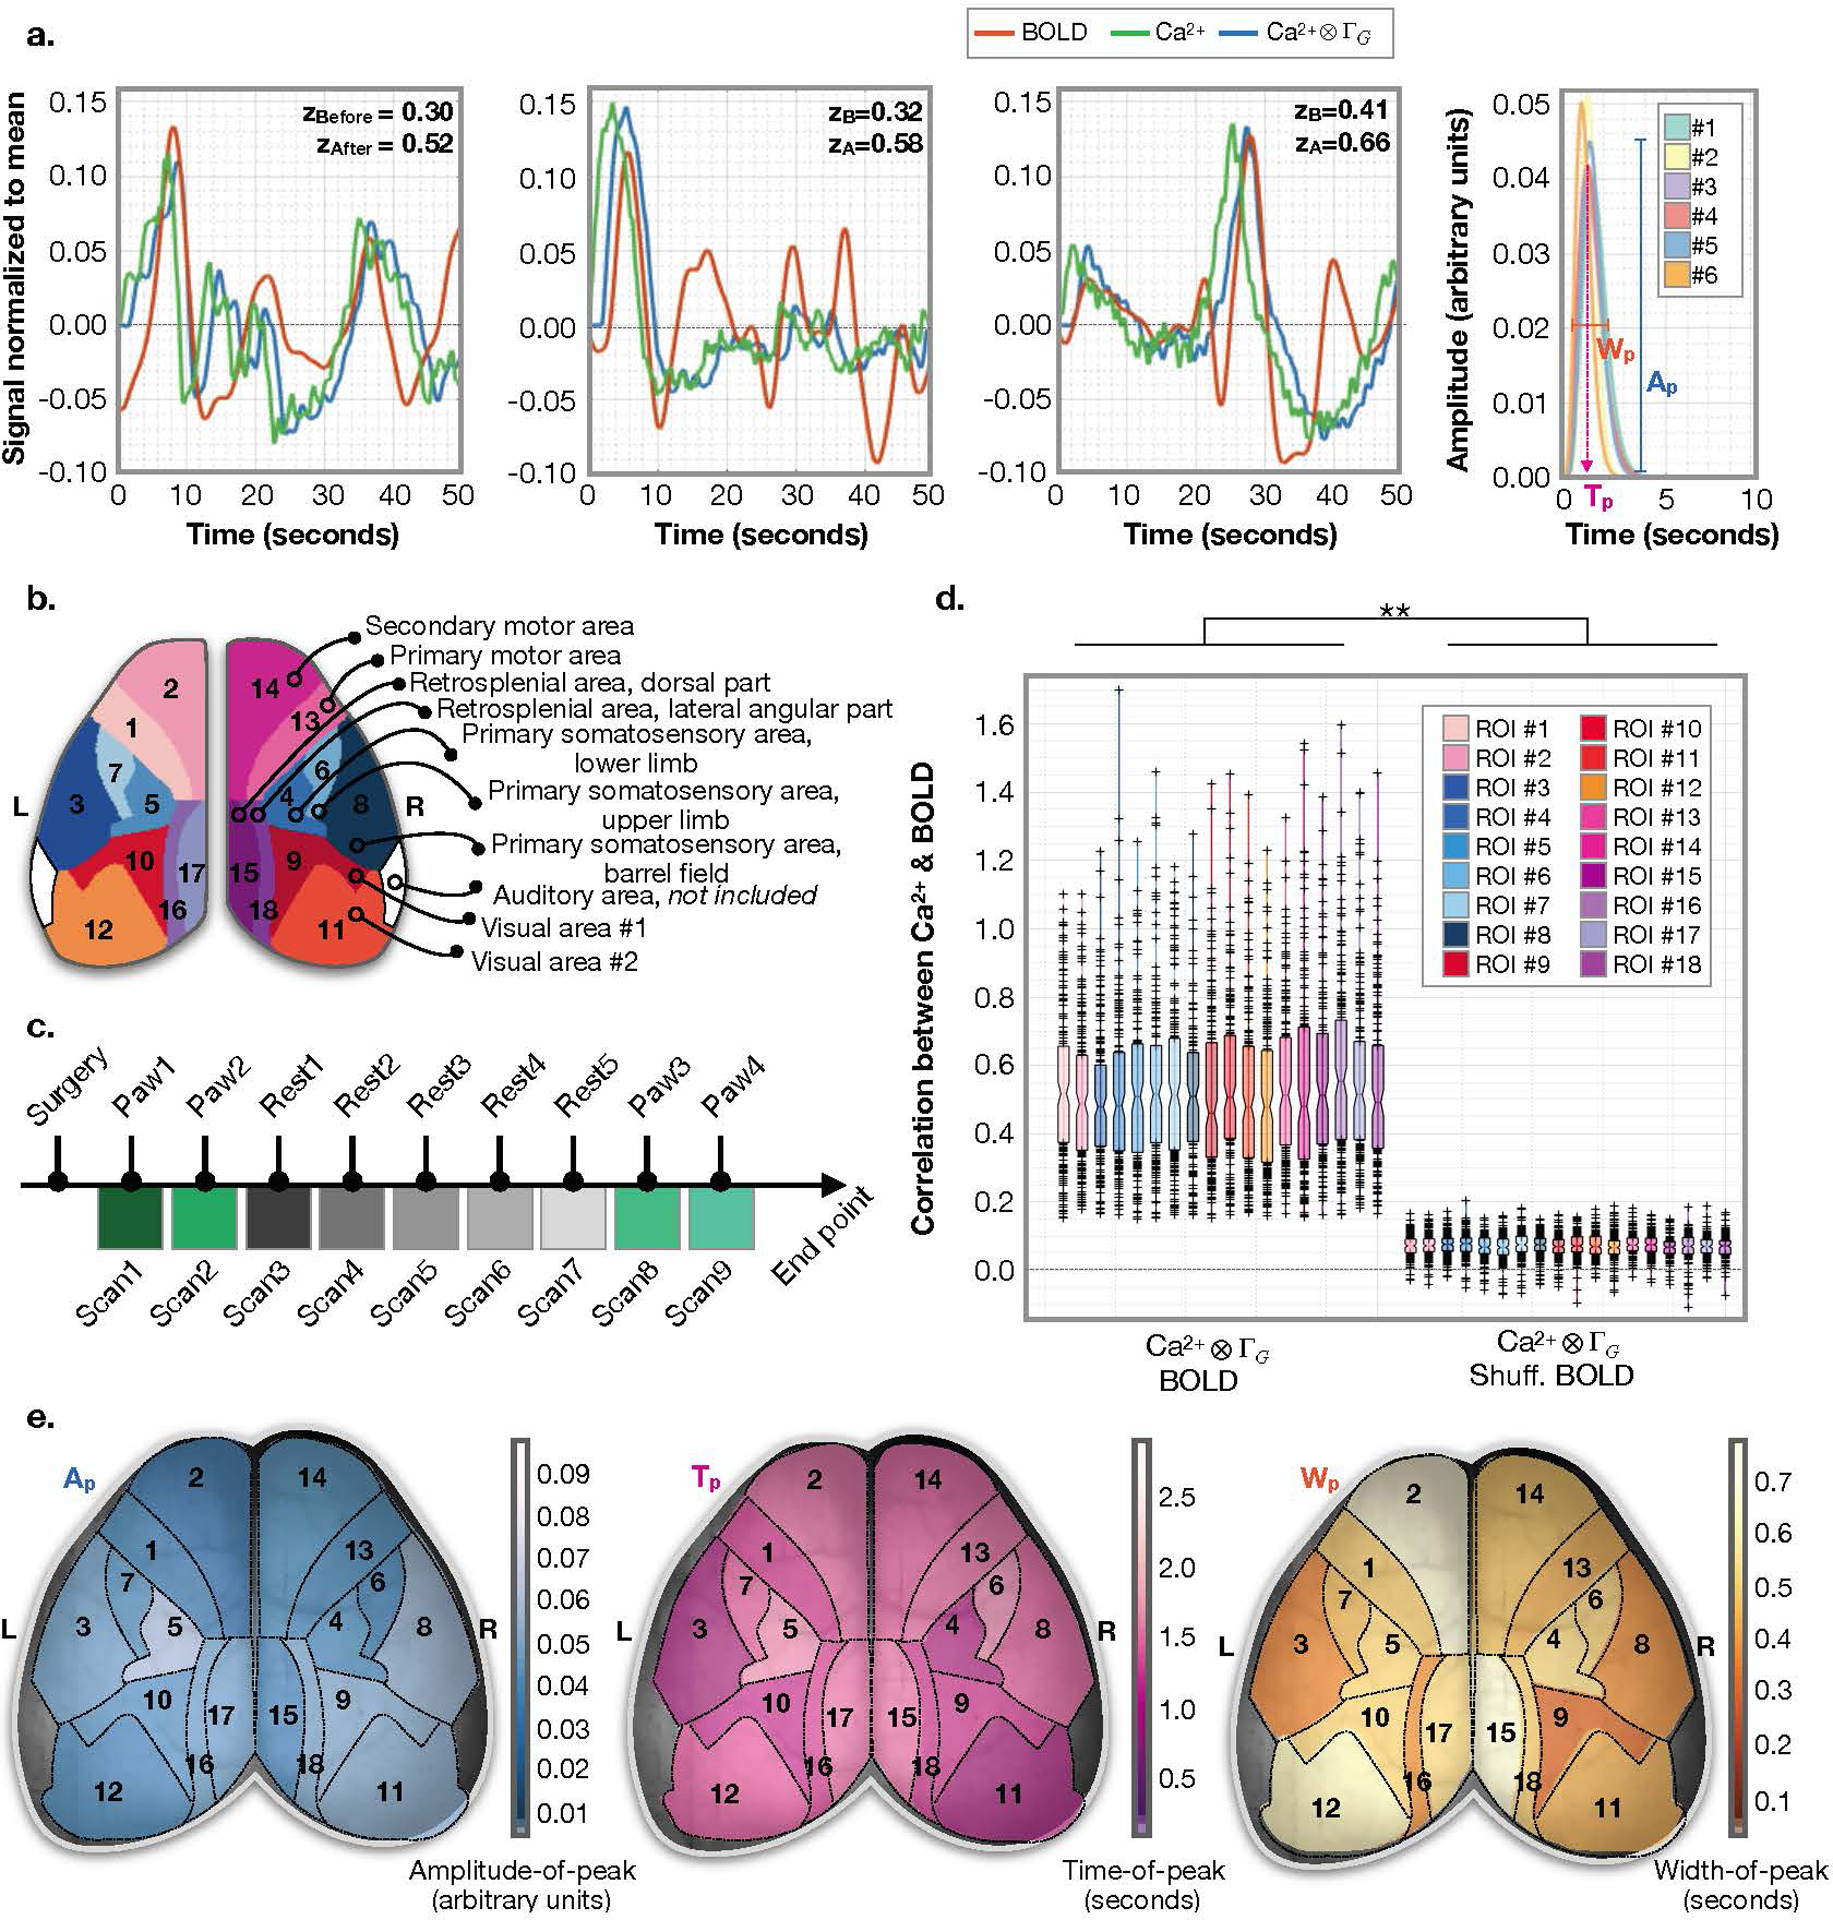
a) Average signals within example Allen Atlas regions. Ca2+ signal before (green) and after (blue) applying gamma-variate convolution for 50-second windows from N=3 mice. BOLD signal (orange) for the same windows, mice, and atlas regions (left and middle panels). Average predicted HRF across all regions and data for each mouse (right panel). Goodness of fit is assessed by Fisher’s Z transformed Pearson’s correlation between the Ca2+ data convolved with the predicted HRF (blue) and the BOLD signal (orange). b) Our down-sampled version of the Allen Atlas. c) Experiment timeline. d) Correlation strength of Ca2+ data convolved with the predicted HRF and the BOLD signal for N=6 mice for n=18 Allen Atlas ROIs (n=9 scans, n=11 50-second windows per scan, i.e. 99 data points per mouse). Boxplot terms: central line is the median, the minima and maxima of the box extends to the 25th and 75th percentiles, whiskers extend to all data points, and outliers (data points beyond the 25th to 75th percentiles) are denoted by ‘+’. No correction for multiple comparisons is applied. We test for a difference between all ROIs and a null distribution (BOLD time points are scrambled) using a two-sample t-test, P=0.0000. Effects of different frequency filters are considered (Extended Data Fig. 8). e) Maps of median estimated gamma variant parameters: amplitude (left), time-of-peak (middle), and width (right).
Functional parcellation of Ca2+ and fMRI data
We use data-driven parcellation (26; 27; 28; 29) with a multi-graph k-way clustering algorithm to identify functional brain regions (parcels) in order to derive a functional atlas (parcellation) of the brain (Supplementary Fig. 9) (30). We apply this method using both Ca2+ or fMRI data in the left and right hemispheres of each mouse independently. This allows a within-animal estimate of reproducibility through computing cross-hemisphere similarity (Fig. 5a), quantified using the Dice coefficient. Parcellations show strong cross-hemisphere similarity for both modalities (Ca2+: 0.68 ± 0.05, and BOLD: 0.56 ± 0.04, mean ± SD, 10 parcels, N=6 mice). Relative to random parcel membership, each mouse shows significant cross-hemisphere similarity for both modalities (t-test; for Ca2+ data mouse #1–6: P=0.0001, 0.0000, 0.0000, 0.0000, 0.0000, and 0.0000; for BOLD data mouse #1–6: P=0.0066, 0.0004, 0.0012, 0.0002, 0.0000, and 0.0000; Fig. 5b).
Fig. 5. Parcellation using spontaneous Ca2+ and fMRI activity.
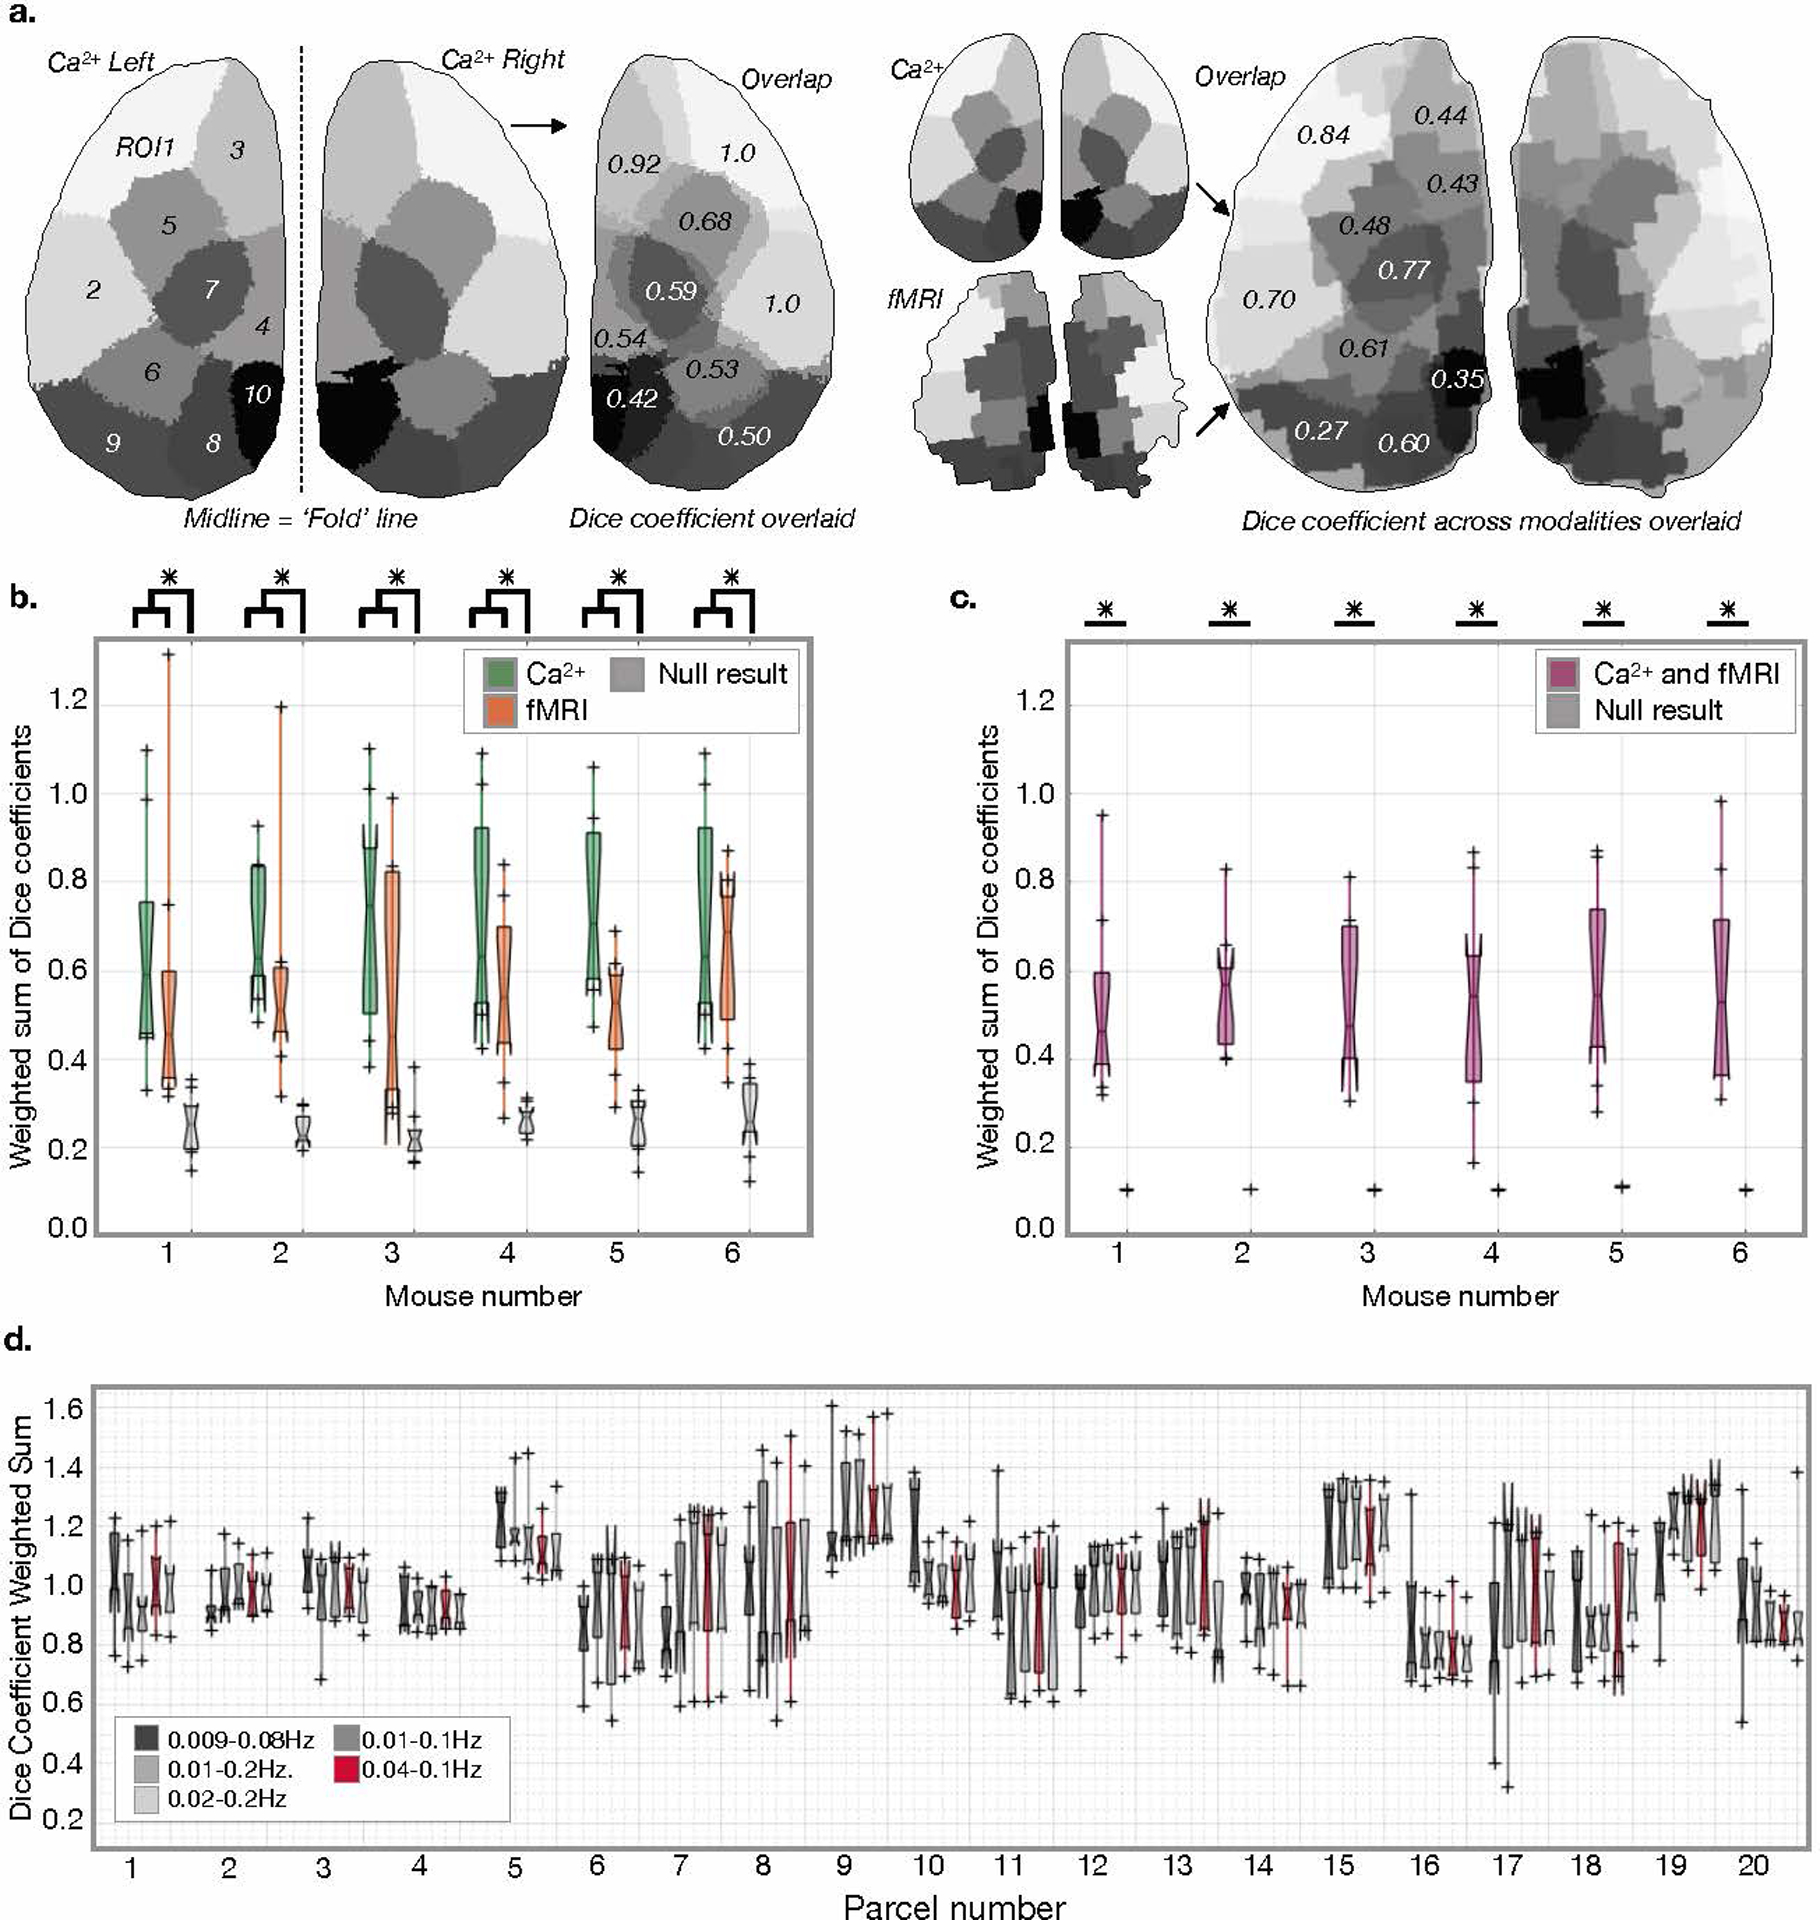
a) Example of overlap of functional parcellations within (left), and between (right) modalities. To measure the consistency of functional parcellations, we separately parcel the left and right hemispheres for each modality, then compare parcels across hemispheres (left) and modalities (right) using the Dice coefficient. b) Bilateral symmetry of the Ca2+ (green), and fMRI (orange) parcellations is above chance (null result from random parcel assignment, gray). For Ca2+ data (mouse #1–6): P=0.0001, 0.0000, 0.0000, 0.0000, 0.0000, and 0.0000. For BOLD data (mouse #1–6): P=0.0066, 0.0004, 0.0012, 0.0002, 0.0000, and 0.0000. No correction for multiple comparisons is applied. We test for a difference between Dice coefficients across ROIs using a two-sample t-test. c) Comparison between Ca2+ and fMRI parcellations, with parcels overlapping across modalities above chance levels (mouse #1–6): P=0.0000, 0.0000, 0.0000, 0.0000, 0.0000, 0.0000. No correction for multiple comparisons is applied. We test for a difference between Dice coefficients across ROIs using a two-sample t-test. d) Dice coefficients for different parcels, depending on frequency band (Extended Data Fig. 9). For all boxplots the central line is the median, the minima and maxima of the box extends to the 25th and 75th percentiles, whiskers extend to all data points, and outliers (data points beyond the 25th to 75th percentiles) are denoted by ‘+’.
We register all N=6 mice so that we can compare parcel overlap across animals (n=20 parcels). For all mice, Dice coefficients are correlated with parcel size (Extended Data Fig. 9), accounting for >89% of the variance. Hence, smaller regions show less overlap independent of bandwidth or mouse. This indicates that smaller regions are more difficult to localize. This fact, combined with inherent differences between hemispheres and the challenge of cross-hemisphere registration, likely drives the variance in parcellation overlap (Fig. 5b).
Next, we compare functional parcellations between modalities (Fig. 5a) and find a strong inter-modality topological similarity (Dice: 0.54 ± 0.15, mean ± SD, 20 parcels, N=6 mice). This relationship is significant relative to randomly assigned parcel membership for all mice (mouse #1–6: P=0.0000, 0.0000, 0.0000, 0.0000, 0.0000, and 0.0000, t-test) (Fig. 5c), indicating that the functional parcellation of the Ca2+ and fMRI data identify shared brain organization. Notably, the inter-modality agreement was akin to the bilateral symmetry within each modality. This demonstrates that despite the different sources of contrast, spatiotemporal resolutions and response functions of these modalities, they identify consistent, functional regions. We repeat the parcellation within various frequency bands (Fig. 5d) (6; 23; 24; 25).
The relationship between Ca2+ and BOLD connectivity strength depends on region
Parcellations based on either modality share a topological pattern (Fig. 6), including correspondence to known brain regions. To investigate further, we project each parcellation onto the data obtained using the other modality. Then, from each parcellation, and the Allen Atlas, we compute a connectivity matrix for each mouse (Fig. 6a). As a control, we include analyses of data collected from N=2 deceased mice (Supplementary Fig. 10). Data from deceased mice do not show a topological or connectivity structure indicating that the results from live mice reflect activity, not measurement noise.
Fig. 6. Inter- vs. intra-hemisphere connectivity strength patterns between Ca2+ and BOLD vary regionally and by brain function.
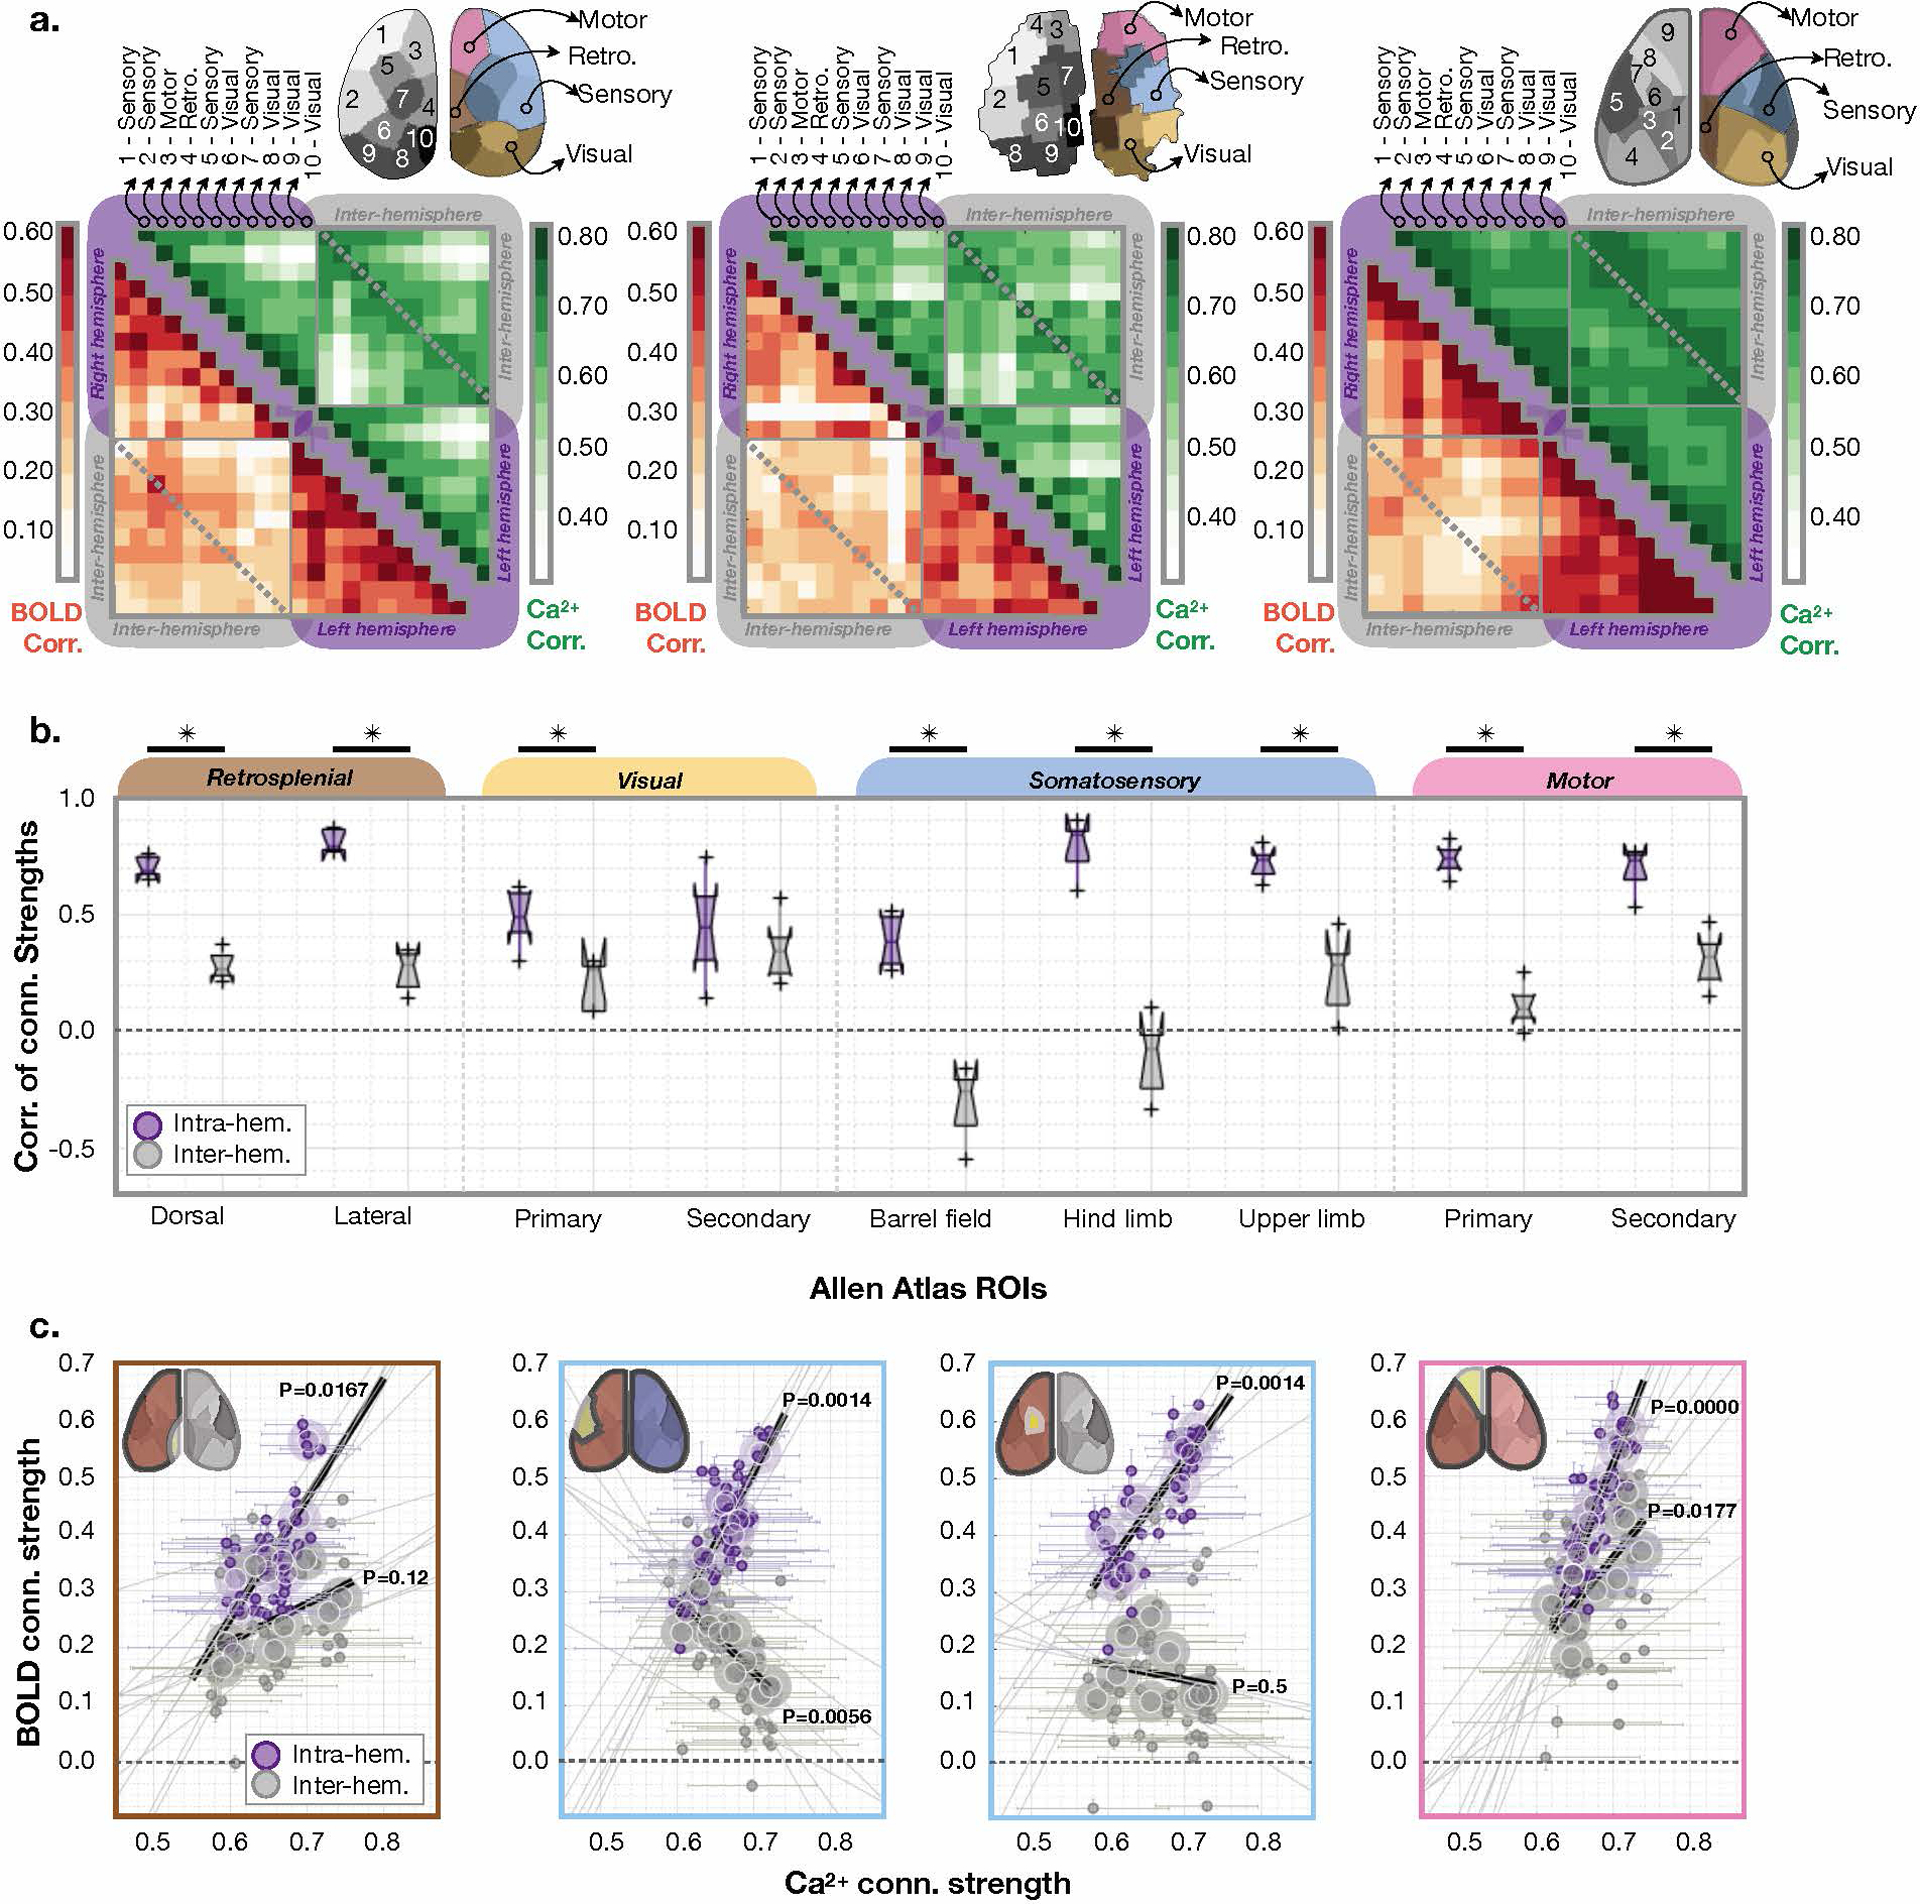
a) Ca2+ (left), BOLD (middle), and Allen Atlas (right) connectivity matrices averaged across mice (N=6). ROIs within the Ca2+ and BOLD parcellations are labeled based on proximity to regions defined by the Allen Atlas, with the exception of the somatosensory lower limb area which can be identified by evoked responses. b) Correlation between the Ca2+ and BOLD connectivity strengths for each region both intra- (purple) and inter-hemisphere (grey) for Allen atlas regions. We test for a difference between inter- and intra-hemisphere connectivity across ROIs using a two-sample t-test (left to right): dorsal P=0.0000, lateral P=0.0000, primary visual P=0.0042, secondary visual P=0.4317, barrel field P=0.0000, hind-limb P=0.0000, upper-limb P=0.0003, primary motor P=0.0000, secondary motor P=0.0005. For the boxplot, the central line is the median, the minima and maxima of the box extends to the 25th and 75th percentiles, whiskers extend to all data points, and outliers (data points beyond the 25th to 75th percentiles) are denoted by ‘+’. c) The correlation of the Ca2+ and BOLD connectivity strengths show different relationships across functional regions within and between hemispheres. Four example regions are shown (left to right): dorsal (left), barrel (left middle), hind limb (right middle), and motor (right). No adjustment is made for multiple comparisons. P-values are from a two-sided test (obtained using Fisher’s Z transformed Pearson’s correlation) which tests the null hypothesis that a correlation does not exist. Data from each edge is averaged across mice (small circles) and across scans (large circles).
K-means clustering maximizes differences in synchrony between parcels. Thus, when Ca2+ data, instead of BOLD, is used to define parcels, voxels with higher BOLD synchrony can be assigned to different parcels, when they would have been assigned to the same parcel if BOLD data were used to define the parcellation (or vice-versa). This point is emphasized by connectivity matrices from the Allen Atlas (Fig. 6a).
To quantify the relationship between Ca2+ and fMRI connectivity strengths, we compute the correlation between Ca2+ and fMRI connectivity between regions within (intra-), as well as between (inter-) hemispheres using the Allen Atlas (Fig. 6b), Ca2+ or BOLD parcellations (Extended Data Fig. 10). We find that the relationship between Ca2+ and BOLD connectivity strength varies by region and intra- versus inter-hemisphere. For example, Ca2+ and BOLD connectivity strengths are correlated (synchronous, P=0.0014, Fisher’s Z transformed Pearson’s correlation) between barrel field and intra-hemispheric regions (Fig. 6c) but anti-correlated between barrel field and inter-hemispheric regions (asynchronous, P=0.0056. A way to interpret these data is to hypothesize that increased inter-hemispheric inhibitory activity could be causing a simultaneous increase in BOLD and decrease in excitatory activity.
These results demonstrate that the Ca2+ and fMRI signals are providing partially shared information and add to growing evidence of a neural basis for the functional connectivity metrics obtained from fMRI. In addition, these results show that the relationship between Ca2+ and BOLD connectivity has a regional and functional dependence which could be cell type-specific.
DISCUSSION
Despite widespread use, the interpretation of fMRI is hindered by our understanding of the physiological events which give rise to the BOLD signal. In animal models, we can apply an array of tools across a range of spatiotemporal scales. The challenge lies in linking measurements across scales and species. It is only through combining different techniques that we can relate many findings (31).
Due to the complexity of the brain and the difficulty of controlling the factors that influence activity, serial experiments, even in the same subject, are insufficient to establish definitive links between modalities. With evoked responses, averaged events can be aligned across experiments. However, the vast majority of activity in the brain is spontaneous. Elucidating the information contained within spontaneous activity is of great interest and can only be studied without temporal averaging. Subtle differences in cellular activity and hemodynamic responses are evidence of true moment-to-moment changes in brain activity which are not observable in serial experiments (32; 8). In this work, we provide further evidence of this by observing correlated trial-to-trial variations in Ca2+ and BOLD activations and correlated spontaneous activity.
Simultaneous multi-modal methods that measure complementary features of activity, including optical and fMR imaging, have been described (4; 33; 34; 35). However, these implementations typically employ single fibers to elicit and/or measure activity which cannot reveal the spatial information available from imaging approaches. To further research in systems and network level analyses, increased area coverage with better spatial resolution is essential.
How different cell types influence hemodynamic regulation, and ultimately BOLD, has been studied for decades (36; 37; 35). BOLD arises from a complex combination of events and is indiscriminate to cell type, whereas the Ca2+ signal is cell type specific. While we labeled only excitatory neurons here, a key strength of our approach is the ability to measure the relative contributions of different cell populations to the fMRI signal.
Using the same approach, we predict BOLD activity from Ca2+ data to a similar degree as hemodynamic activity was previously predicted (6). We account for 30 ± 9% of the variance in BOLD, in contrast to the previously predicted ~46% (6). Notably, both the hemodynamic and neural signals previously reported were measured optically within the same spatial domain (6). Our results show correspondence between the temporal patterns of two independent signals arising from spontaneous activity. We anticipate that different transfer functions will be observed for each cell population in future work.
A few research groups have established protocols for awake mouse fMRI (38). Currently, none of the awake protocols described in the literature are compatible with the dual-imaging technology described here. Even light anesthesia can have profound effects on brain activity, but in the work presented here, the anesthetized model was sufficient for demonstrating correspondence between Ca2+ and fMRI signals and served as a proof of principle for this dual-modality imaging approach (38). The device and procedures have been designed to be compatible with imaging awake animals. To cover a large FOV with a high NA objective would require the use of an objective with a much larger diameter than what would fit in our 11.7T system. For low magnification (x1 used here) the objective needs to be extremely large to get a slightly higher NA. Furthermore, for mesoscopic Ca2+ imaging, a typical NA is less than 0.1. We use an NA of 0.07. Future work could investigate optimizing the design of our optical apparatus (through increasing the NA).
This simultaneous imaging method will provide data that contributes to a firmer biological understanding of the cellular origins of the BOLD signal. The fMRI component of our approach provides a direct link from mouse to human studies, giving insights into the functional organizing principles of the brain.
ONLINE METHODS
Acute surgical preparation
All procedures are performed in accordance with the Yale Institutional Animal Care and Use Committee and are in agreement with the National Institute of Health Guide for the Care and Use of Laboratory Animals. Anesthesia is induced with 3% Isoflurane (1.5–2% during surgery). Fur is removed from the scalp and thigh (for MouseOx) using dilapidation cream (Nair™). Lidocaine (0.5%, Henry Schein Animal Health VINB-0024–6800) and marcaine and epinephrine (0.5%, Pfizer Injectables 00409175550) are used to numb the scalp prior to resection. Once the skull surface is clear of tissue, a dental cement (C&B MetabondⓇ, Parkell) ‘well’ is built around the circumference, taking care not obstruct the Ca2+ FOV. A fluorescent bead (Fluorescent green PE microspheres, UVMS-BG-1.00, 106–125μm, Cospheric) is embedded within the right-anterior wall for motion correction. Dental cement is used to secure the outside edges of the well to a head-plate (acrylonitrile butadiene styrene plastic, Lulzbot TAZ-5 printer, with 0.35mm nozzle) which cradles the sides of the skull and attaches above the olfactory bulb. The head-plate dovetails with the RF MRI coil and Ca2+ imaging hardware to minimize motion. The well is filled with an optically transparent agar substitute: 0.5% Phytagel (BioReagent, CAS.71010-52-1) with 0.5% MgSO4 in water, sealed with a glass cover-slip (Carolina Biological Supply Company, item.no.633029) and secured with dental cement.
Chronic surgical preparation
Anesthesia is induced with 5% isoflurane (30% O2 and 70% medical air). Mice are head-fixed in a stereotaxic frame (KOPF), and anesthesia is reduced to 2%. Paralube is applied to the eyes, bupivacaine (0.1%) is injected under the scalp, a subcutaneous injection of meloxicam (2mg/kg) is given, and fur is removed from the scalp using NAIR™. The scalp is washed three times using betadine, and 70% ethanol. The skin and soft tissue overlying the skull is removed, and the upper portion of the neck muscle is removed from the occipital bone. Neo-Predef is applied to the skin, and isoflurane is reduced to 1.5%. The parietal and frontal plates of the skull are thinned with a 1.4mm and 0.7mm tip diameter hand-held drill (FST, USA). The thinned bone is cleaned using a fine brush, and a small amount (less than one drop) of superglue is applied to the thinned surface (Loctite, Henkel). When the glue is dry, transparent dental cement C&B Metabond (Parkell, Inc) is applied, and the head post attached. The head post is a double-dove tail plastic frame with a microscope slide hand-cut to match the size and shape of the mouse skull.
Optical components for within scanner imaging
Components are composed of glass or plastic. Directly above the mouse, a prism (25mm, uncoated, N-BK7, #32–336 RA-Prism, Edmund Optics) redirects the excitation and emission light by 90° so that they pass through the telecentric lens (MML-1-HR65DVI-5M, Moritex). For MRI compatibility, we replace the metal housing of the stock lens with plastic (DerlinⓇ Acetal Resin and PEEK, McMater-Carr). We further customize by replacing the beam-splitter with a dichroic filter (15×17×1mm, 495nm high-pass, T495lpxr, Lot: 321390, CHROMA). A custom port that collimates (12 Dia. × 15 FL mm, VIS-EXT, Inked, Plano-Convex, Edmund Optics) and redirects the excitation light by 90° into the lens was purpose built out of Delrin and nylon (Kramer Scientific). The excitation light arrives via a 5mmx5m liquid light guide (10–10645, Lumencor) from the room neighboring the magnet where the LED light source (Lumencor SPECTRA X, Lumencor) is housed. Similarly, a custom 4.6m long 14.5×14.5mm2 cross section coherent fiber optic bundle (N.A. 0.64) containing an array of multi-fibers (10μm elements in a 6×6, 60μmx60μm array, a total of ~2,000,000 fibers) (SCHOTT Inc.) transports the emission light to the same neighboring room where the Ca2+ imaging data is recorded using a sCMOS camera (512×512 pixels, pco.edge 4.2, PCO). An additional GFP emission filter (ET525/50m, CHROMA) is placed between the fiber bundle and the camera connected by two optical extenders (sub-assemblies of a TwinCam LS Image splitter, Cairn Research).
Optical components for out-of-scanner data acquisition
Imaging is performed with a Zeiss Axiozoom V.16 coupled to a PlanNeoFluar Z 1x, 0.25 NA objective with 56mm working distance.
Mice
Mice are housed on a 12-hour light/dark cycle. Food and water were available ad libitum. Mice are mixed-sex adults, 6–8 weeks old, 25–30g, at the time of imaging. We report data from a first-generation TIGRE (genomic locus) line crossed with reporter lines controlled by Cre recombinase (promoter) with a tetracycline-regulated transcriptional trans-activator (tTA) for amplification (39; 40; 41; 42). For detailed expression level data, refer to: http://connectivity.brain-map.org/transgenic;http://www.alleninstitute.org/what-we-do/brainscience/research/products-tools/ (39). More specifically, we used Ai93 mice (or TIT2L-GCaMP6f, TIGRE - Insulators - TRE2 promoter - LoxPStop1LoxP - GFP CalModulin fusion Protein 6 fast) crossed to CaMK2a-tTA mice (CalModulin dependent protein Kinase 2 alpha) driven by Slc17a7 (or Vglut1) - IRES (internal ribosome entry site) 2 - Cre promotor mice, all purchased from Jackson Labs (JAX stock numbers: 024103, 003010 and 023517) and bred in-house. The resulting Slc17a7-Cre; Camk2a-tTA; Ai93 mice have GCaMP6f expressed in 100% of cortical excitatory neurons.
Animal monitoring
During data acquisition, mice are anesthetized with 0.5–1.25% Isoflurane, adjusted to maintain a heart rate of 480–550 beats per minute. Mice freely breathe a mixture of O2 and medical air, adjusted to maintain an arterial O2 saturation of 94–98%. Heart and breath rate, arterial O2 saturation, and rectal temperature (Neoptix fiber), are continually monitored (MouseOx Plus Revision 1.5.25 from STARRLife Sciences, Inc.) and recorded (Spike2 7.07, Cambridge Electronic Design Limited) (Supplementary Fig. 3). Body temperature is maintained with a circulating water bath. During image acquisition, MRI, Ca2+ imaging and physiological data recording were synchronized (Master-8 A.M.P.I., Spike2 Cambridge Electronic Design Limited). Hind-paw electrical stimulation was delivered at 1mA, 5Hz, in 5/55 seconds ON/OFF cycles.
Functional imaging parameters
Ca2+ data is recorded using CamWare V3.17 at an effective rate of 10Hz. To enable frame-by-frame background correction, violet (395/25) and cyan (470/24) illumination (controlled by an LLE 7Ch Controller from lumencor) is interleaved at a rate of 20Hz. The exposure time for each channel (violet and cyan) is 40ms to avoid artifacts caused by the rolling shutter refreshing. Thus, the sequence is: 10ms blank, 40ms violet, 10ms blank, 40ms cyan etc. All Ca2+ data is cleaned from hemodynamic artifacts and motion by regressing the violet from the cyan wavelength as described previously (43; 44).
MRI data is recorded using a 11.7T preclinical Bruker magnet (Bruker, Billerica, MA) and ParaVision version 6.0.1. fMRI data is acquired using a gradient-echo, echo-planar-imaging (EPI) sequence with a repetition time (TR) of 1 second, and an echo time (TE) of 9.1ms (45). Data are collected at a 0.4×0.4×0.4mm3 resolution, across 28 slices. Each run is 600 repetitions in length (10 minutes).
Ray-casting algorithm for MR surface projection
The algorithm uses the 3D TOF MR-angiogram to create a simulated 2D MR image (Extended Data Fig. 4). There are three steps. First, non-brain tissue is removed using signal intensity thresholding. Second, the MR volume is rotated and translated using five degrees of freedom: three rotation angles of the axial plane of the MR volume relative to the optical imaging plane and two in-plane translations. Third, the MR data is projected along the translation perpendicular (after translation) to the optical imaging plane by shooting ‘rays’ from ‘above’. Each ray is followed until it ‘hits’ the MR brain-volume ‘surface’. For each pixel in the MR image, we compute the average signal of the first five voxels beneath the surface in the MR volume and multiply this by the cosine between the ray and the brain surface normal to estimate the local image gradient for shading. The second and third steps are repeated iteratively. Following each iteration, the similarity of the blood vessels in the optical image and projected MR image are assessed and the five parameters estimated in the second step adjusted until convergence.
Custom HRF from pilot data
The HRF passed to the generalized line model (GLM) used in the analysis of evoked responses is derived from a mouse imaged during a pilot experiment using the same imaging, anesthesia and stimulation protocol as the present work. This mouse was an Ai93 (TIT2L-GCaMP6f, TIGRE - Insulators - TRE2 promoter - LoxP Stop1 LoxP - Green fluorescent protein CalModulin fusion Protein 6 fast), CaMK2a-tTA, Emx1-IRES-cre animal purchased from Jackson Labs (JAX stock numbers: 024103, 003010 and 005628) and bred in-house. The Ai93/Camk2a-tTA/Emx1-Cre mice have GCaMP6f expression in excitatory neuronal cell populations just as the Ai93/CaMK2a-tTA/Slc17a7-Cre mice (reported in Results) do. These data are processed and fit using a GLM (AFNI, 3dDeconvolve) following the same steps as data reported in Results. The single difference is that a box-car time-locked to stimulation onset is used in place of an HRF.
Signal from responding voxels in the contralateral cortex are averaged. We isolate the first four responses to hind-paw stimulation because we find that in a typical experiment these are the most robust. The averaged, smoothed, and normalized trace is used as our HRF for the analyses of the animals presented in Results (Supplementary Fig. 6).
Ca2+ data processing
Images are rotated to align the anterior-posterior axis with vertical (top-to-bottom of page or screen) (MATLAB, imrotate). Violet and cyan frames, interleaved during data acquisition, are separated (odd or violet and even or cyan) and processed in parallel. Motion correction, using rigid body translation (MATLAB, imregtform), is performed using a FOV containing only the fluorescent bead imbedded within the dental cement (Fluorescent green PE microspheres, UVMS-BG-1.00, 106–125μm, Cospheric; Extended Data Fig. 3).
Data are masked to isolate brain tissue (ImageJ, polygon). For even and odd frames, individual pixel baseline correction (MATLAB imtophat, line structure 300 width) is applied to remove the trend caused by photobleaching. This results in a zero baseline. Data are baseline-shifted back to the raw-data signal intensity by adding the average (pre-baseline correction) signal of each pixel’s time course back to each pixel value. This is necessary for regression of the background signal, which includes Ca2+ unrelated signal (e.g. hemodynamic artifacts and motion) and calculating the relative fluorescence change (final step). To remove non-GCaMP6f fluorescence changes, we do background correction by regressing (MATLAB, regress) the violet from the cyan time course pixel-wise (43, 44, 46). To compute the relative fluorescence change, each pixel in the background corrected (violet regressed from cyan) time course is divided by the average signal of each pixel’s time course. The result is the ΔF/F (F, fluorescence) movie (Extended Data Fig. 3).
fMRI data processing
Data are motion corrected (AFNI, Analysis of Functional NeuroImages, 3dVolReg), masked to isolate brain tissue (MATLAB, roipoly), and spatially blurred within the brain-mask (MATLAB, smooth-gaussian, full-width-half-maximum, FWHM, 0.8mm) (47). Data are filtered using five frequency band windows: (i.) 0.009–0.08Hz (ii.) 0.01–0.1Hz (iii.) 0.01–0.2Hz (iv.) 0.04–0.1Hz, and (v.) 0.02–0.2Hz, (MATLAB, Butterworth), the global signal regressed (MATLAB, detrend), and the linear trend removed (MATLAB, detrend). Overall, we find our results to be unaffected by frequency filtering. Data with frame-wise motion estimates >0.4mm are excluded (voxel size 0.4×0.4×0.4mm3). The majority of the data we collect contains sub-threshold motion (75% of evoked activity recordings and 82% spontaneous activity recordings, N=28/38), (Supplementary Fig. 4). Parameters are in agreement with previous work (48; 49; 50).
Structural MR imaging parameters
High in-plane resolution images of fMRI FOV: Using a multi-spin-multi-echo (MSME) imaging sequence. In 10 minutes, 40 seconds, using a TR/TE of 2500/20ms, we obtain 28 slices (0.4mm thick) with an in-plane resolution of 0.1×0.1mm2 (two averages). The slice prescription of these images matches those of the fMR images (are of the same anatomy).
Isotropic 3D anatomy of the whole brain: Using a MSME imaging sequence. In 5 minutes, 20 seconds, using a TR/TE of 5500/15ms, we obtain a 0.2×0.2×0.2mm3 (single average) image of the whole brain. This sequence is repeated five times during our imaging protocol interleaved with functional acquisitions. Interleaving structural and functional acquisitions allows recovery of the Ca2+ signal and more robust responses to stimulation during functional data acquisitions with evoked responses. In post-processing, the five isotropic anatomical images are concatenated (MATLAB, horzcat), motion corrected (AFNI, 3dVolReg), and averaged (MATLAB, mean) to create one image.
MR angiogram: Using a fast-low-angle-shot (FLASH) time-of-flight (TOF) imaging sequence. In 18 minutes, using a TR/TE of 130/4ms, we obtain a 0.05×0.05×0.05mm3 2.0×1.0×2.5cm3 image of the blood vessels within the cortex.
High resolution anatomy of angiogram FOV: Also using a FLASH sequence. In 7 minutes, 30 seconds, using a TR/TE of 61/7.5ms, we obtain an image with resolution 0.13×0.08×0.05mm3 and FOV 2.0×1.0×2.5cm3 capturing the anatomy within the same FOV as the MR angiogram.
Generalized linear model (GLM) for Ca2+ and fMRI data
Ca2+ data: From each mouse, we collect 40 minutes of evoked responses to hind-paw stimulation during four 10-minute runs which are interspersed between spontaneous activity recordings and structural imaging. The first minute of data was excluded due to persistent effects of photo-bleaching in the Ca2+ data. Preprocessed Ca2+ data containing evoked responses are normalized (MALTAB, zscore) and fit using a GLM (MATLAB, glmfit). Motion parameter estimates from simultaneously recorded fMRI data, a drift parameter (photobleaching), motion estimates from fluorescent beads (Extended Data Fig. 3), as well as a box-car response function are included in the model. The response map is thresholded for pixels with beta values larger than the FWHM beta value. Clusters with <30 pixels are discarded (MATLAB, bwconncomp). Similar ROI results are obtained when motion estimates and/or drift parameters are not included within the model.
Functional MRI data: Data containing evoked responses are fit using a GLM (AFNI, 3dDeconvolve). Drift and motion parameters as well as a custom HRF are included in the model (51). A custom HRF is used because the BOLD response is not recapitulated well by a boxcar function, while the Ca2+ response is. In the GLM we use to identify the ROIs responding to the stimulus, we convolve the HRF with the stimulus paradigm before fitting to the fMRI data. The response map is thresholded to correct for multiple comparisons (false discovery rate q<0.01) and a cluster size limit (>30 contiguous voxels) applied.
Statistics
Tests for statistical significance are computed in MATLAB (R2017bV.38 or R2018aV.39). Errors are shown as the standard deviation or the standard error, unless otherwise specified. Number of subjects and measurements are given. Data are excluded when motion artifacts (measure in fMRI) are above a predetermined threshold of 0.4mm frame-wise displacement. This threshold is determined a priori using pilot data. In this data set, 21/28 runs (10 minutes of data) with stimulation, and 31/38 runs at rest are included (Supplementary Fig. 4). We test for differences between groups using a two-sample t-test (MATLAB, ttest2), unless otherwise specified. For correlations, P-values are from a two-sided test (obtained using MATLAB, corr) which tests the null hypothesis that a correlation does not exist. Exact P-values are given. P-values <0.00001 are reported as P=0.0000.
Gamma-variate convolution model
The following approach was modeled after the method described by Ma et al. (52). The original BOLD signal f(t) was upsampled x10 (MATLAB, interp) to match the sampling rate of the Ca2+ signal g(t). We assume a linear relationship between the upsampled BOLD signal fu(t) and the Ca2+ signal g(t) by a hemodynamic response function HRF(t),
where ⊗ denotes convolution, and HRF(t) is defined as a gamma function of the form,
where , and β = W2 T represents the delay to peak, and W represents the width of the HRF. The MATLAB optimization function fmincon was used to estimate the parameters {A, T, W}, and the loss function was defined to be the L2 distance between the estimated and the observed fu(t). We consider 50s windows of data, excluding the first 50s of each 10-minute experiment.
Ca2+ and fMRI parcellation: multi-graph k-way clustering
The cellular elements (e.g. dendrites, axons, or cell bodies) that give rise to the mesoscopic Ca2+ signal is unknown which makes it impossible to determine the exact depth of the signal source. For our purposes, this means we must choose a reasonable depth in order to compare 3D fMRI to 2D mesoscopic Ca2+ data. The source of the mesoscopic Ca2+ signal is most likely neuropil (dendrites) and dominated by superficial cortical layers 1–5 (43, 53). Based on this information, we impose a depth threshold on the fMRI data which corresponds approximately to cortical layers 1–5. We extract the fMRI data by back projecting the Ca2+ FOV (Fig. 2c) using BioImage Suite (BIS) to a fixed depth of 1.2mm (or 3 fMRI voxels). The parcellation of the fMRI data is computed in 3D within this mask. The parcels are then projected to the surface to compare with the Ca2+ data.
We denote the original data set (either Ca2+ or fMRI) as , where k can be the index for different runs from one animal or the index for different animals. Each Fk is organized as a 2D matrix Fk = [F1kF2k⋯Fik⋯FNk], where each column is a time course indexed by i, and N is the total number of pixels (2D, Ca2+ data) or voxels (3D, fMRI data).
To apply the clustering algorithm, we construct a graph for each set of data in Fk. The graph consists of vertices and edges. Vertices are the N pixels or voxels and edges are the connections between each pair of vertices. Edges are characterized by their strength, which is quantified by measuring the similarity between the time courses of pairs of vertices. Accordingly, we calculate a matrix of weights Wk of size N × N for a given Fk, and each entry wij is defined by . Here, we define , where rij is the Pearson correlation between the time course of pixel/voxel i and pixel/voxel j.
The optimization and computation of the clustering algorithm is performed in the spectral domain. In other words, given a Wk, we compute the first m eigenvectors of Wk denoted as Xk = [x1kx2k⋯xmk], xk is of size N × m, and each column is an eigenvector. The multi-graph k-way clustering algorithm is then set to solve the following optimization,
where Y is the m-ROI parcellation of the brain based on the complete sets of data from all K runs, 1N is a single column vector of size N, and Im is the m × m identity matrix. The optimization is solved iteratively. For more details refer to Shen et al. (54). After Y is solved, we convert Y to a 1D label. Each row of Y corresponds to one pixel or voxel. By definition, each row of Y has one out of m entries equal to one, and all other (m-1) entries are zero. Thus, the label for each pixel or voxel i is the column index where the ith row of Y equals one. Finally, the 1D label is mapped to the original 2D/3D space for visualization and further analysis.
Calculation of the Dice Coefficient
Given two data sets A and B, the Dice coefficient Dice(A, B) is calculated as Dice(A, B) = 2*|A∩B|/(|A| + |B|), where || denotes the cardinality of the set. When computing the overlap of two parcellations, ParcA and ParcB, they are required to be in the same space. Thus, we first find the best matched ROIBi in ParcB for a given ROIAi in ParcA, then we compute the weighted sum of the Dice coefficients as:
Reporting Summary
Additional information is available in the Life Sciences Reporting Summary linked to and published alongside this article.
DATA AVAILABILITY
The raw MR and optical imaging data generated during the current study are available from the corresponding author upon reasonable request. Data are not available in a public repository at the time of this publication due to ongoing work by the authors on these data set. The Allen Brain Atlas was downloaded from http://www.brain-map.org.
CODE AVAILABILITY
Custom MATLAB code for fMRI preprocessing and MR and Ca2+ data post-processing (parcellation and computation of connectivity matrices) is available from the corresponding author upon reasonable request. For analyses of Ca2+ data, refer to: https://github.com/bioimagesuiteweb/bisweb/tree/calcium. The analysis tools for multi-modal data registration and analysis are available BioImageSuite Web at www.bioimagesuite.org.
Extended Data
Extended Data Fig. 1. Assembly of MR saddle coil, mouse head-plate, and Ca2+ imaging optical apparatus.
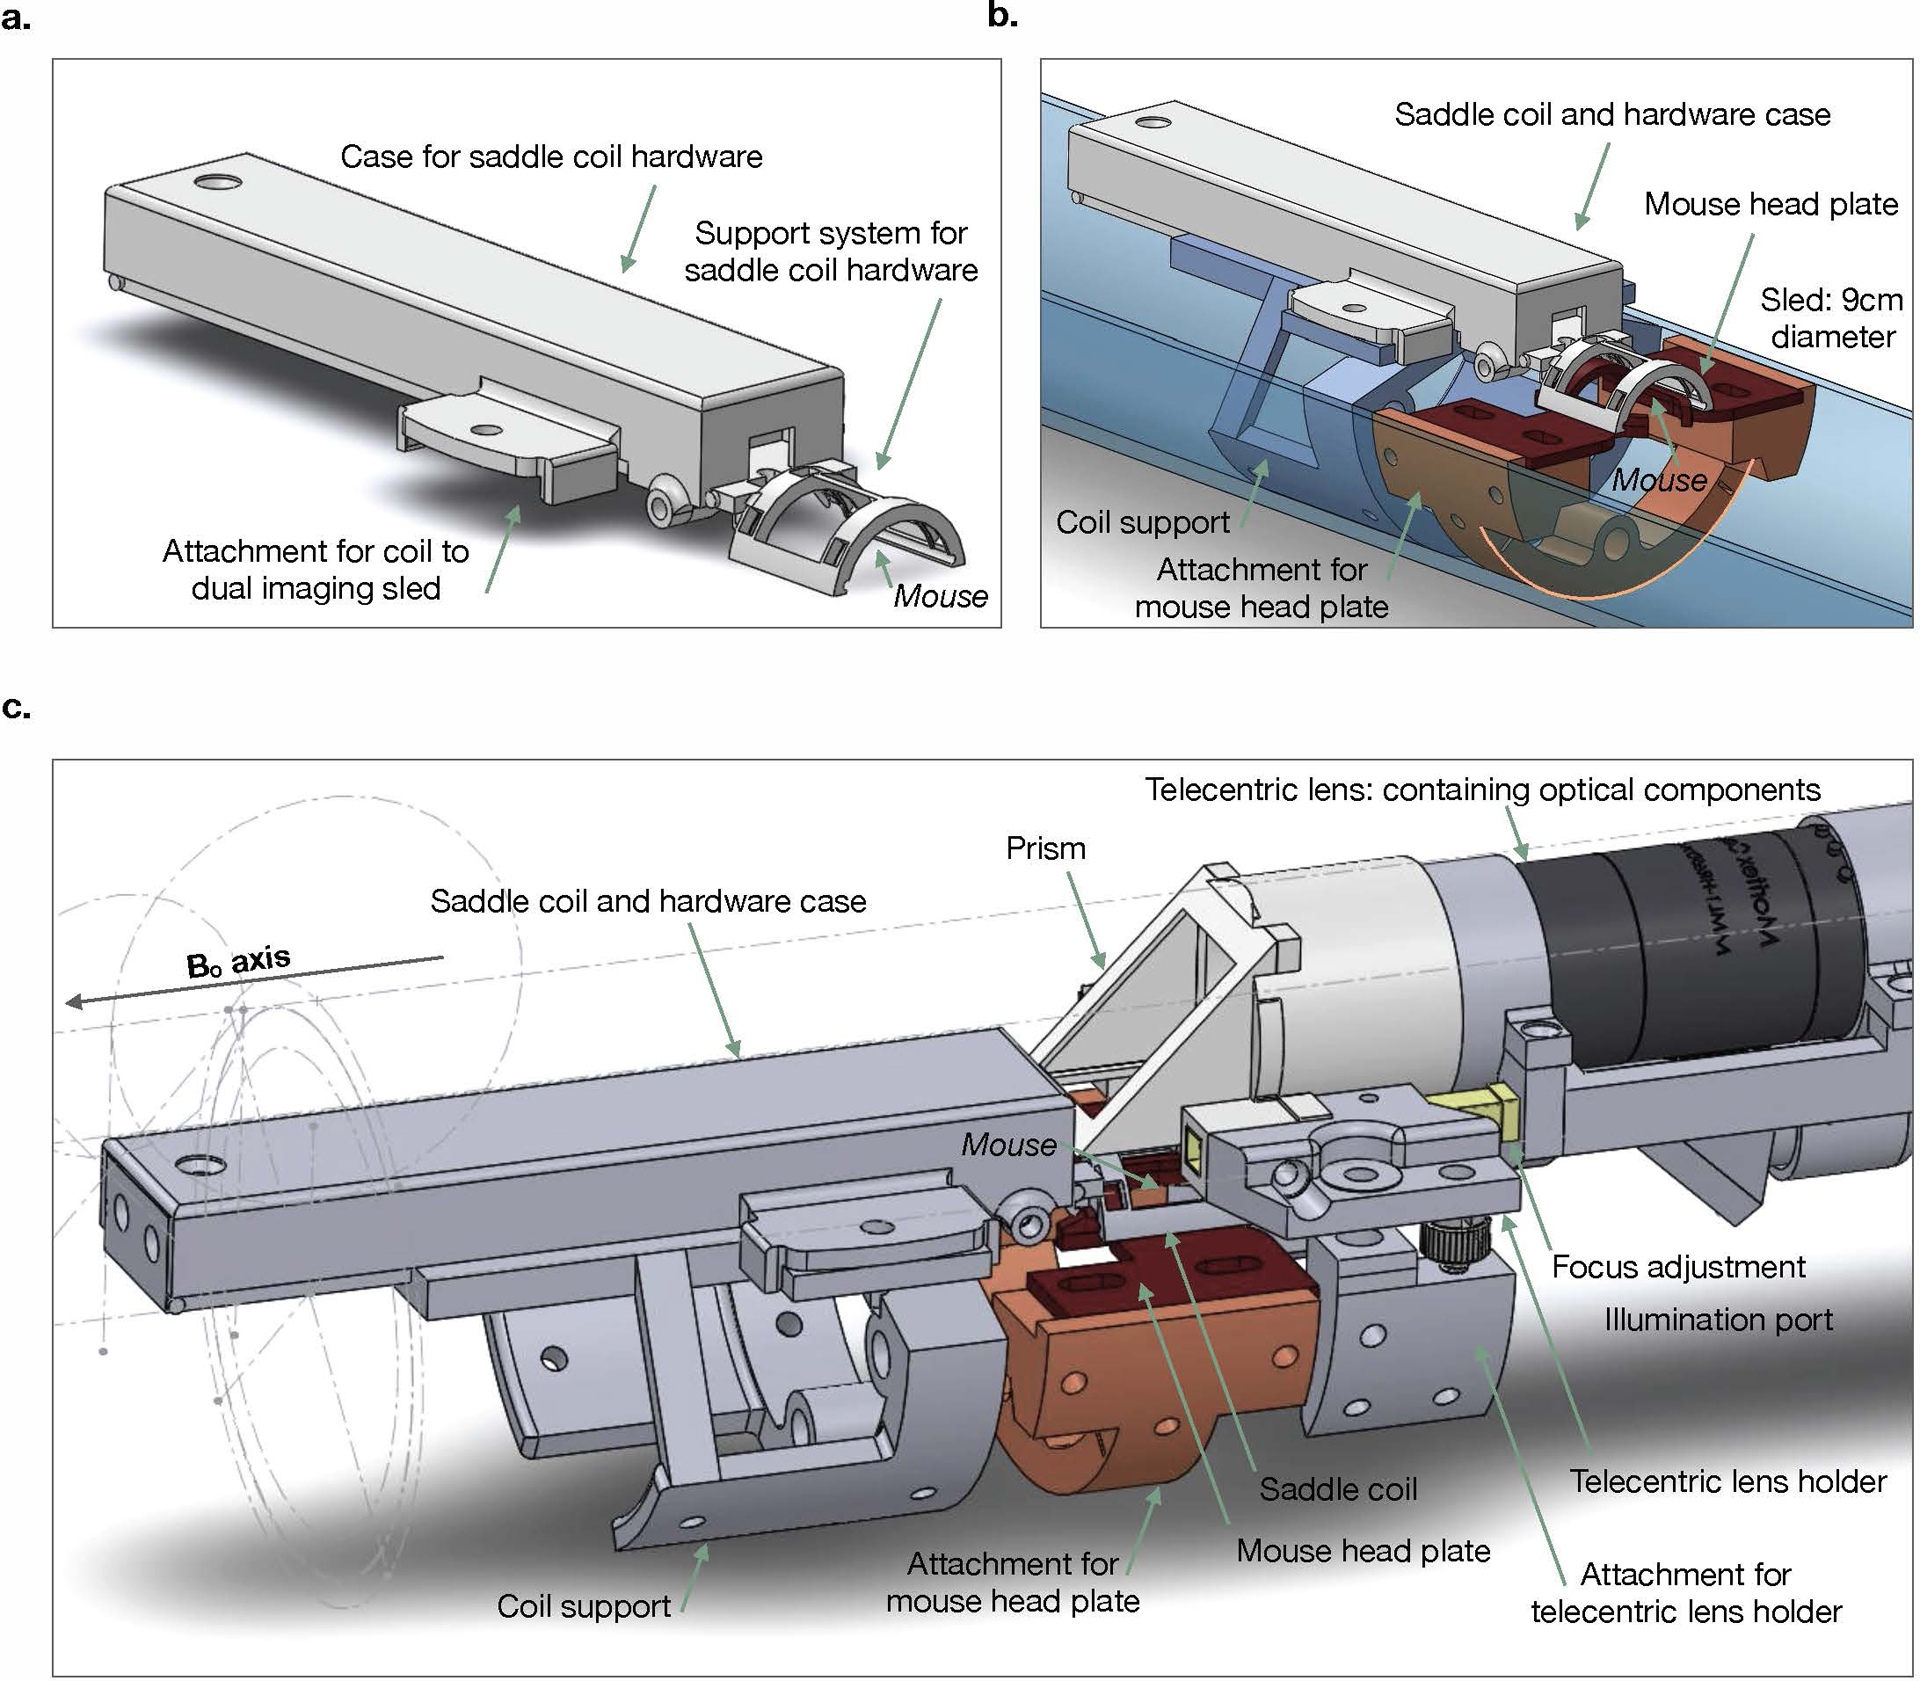
Custom saddle coil and imaging apparatus design. a) Removable saddle coil, with case that protects hardware. b) Coil in place on dual imaging sled. Coil (white) is mounted on a support system (blue) which is fixed to the sled (semi-transparent blue). A support system for the mouse (orange) is attached to the sled to which the mouse head plate (red) attaches. c) Assembled dual imaging apparatus. The telecentric lens (for Ca2+ imaging) is secured above the mouse and saddle coil. The position of the telecentric lens (and housing) can be adjusted (yellow) along the magnet Bo axis to focus the Ca2+ image.
Extended Data Fig. 2. A cross section of the optical apparatus.
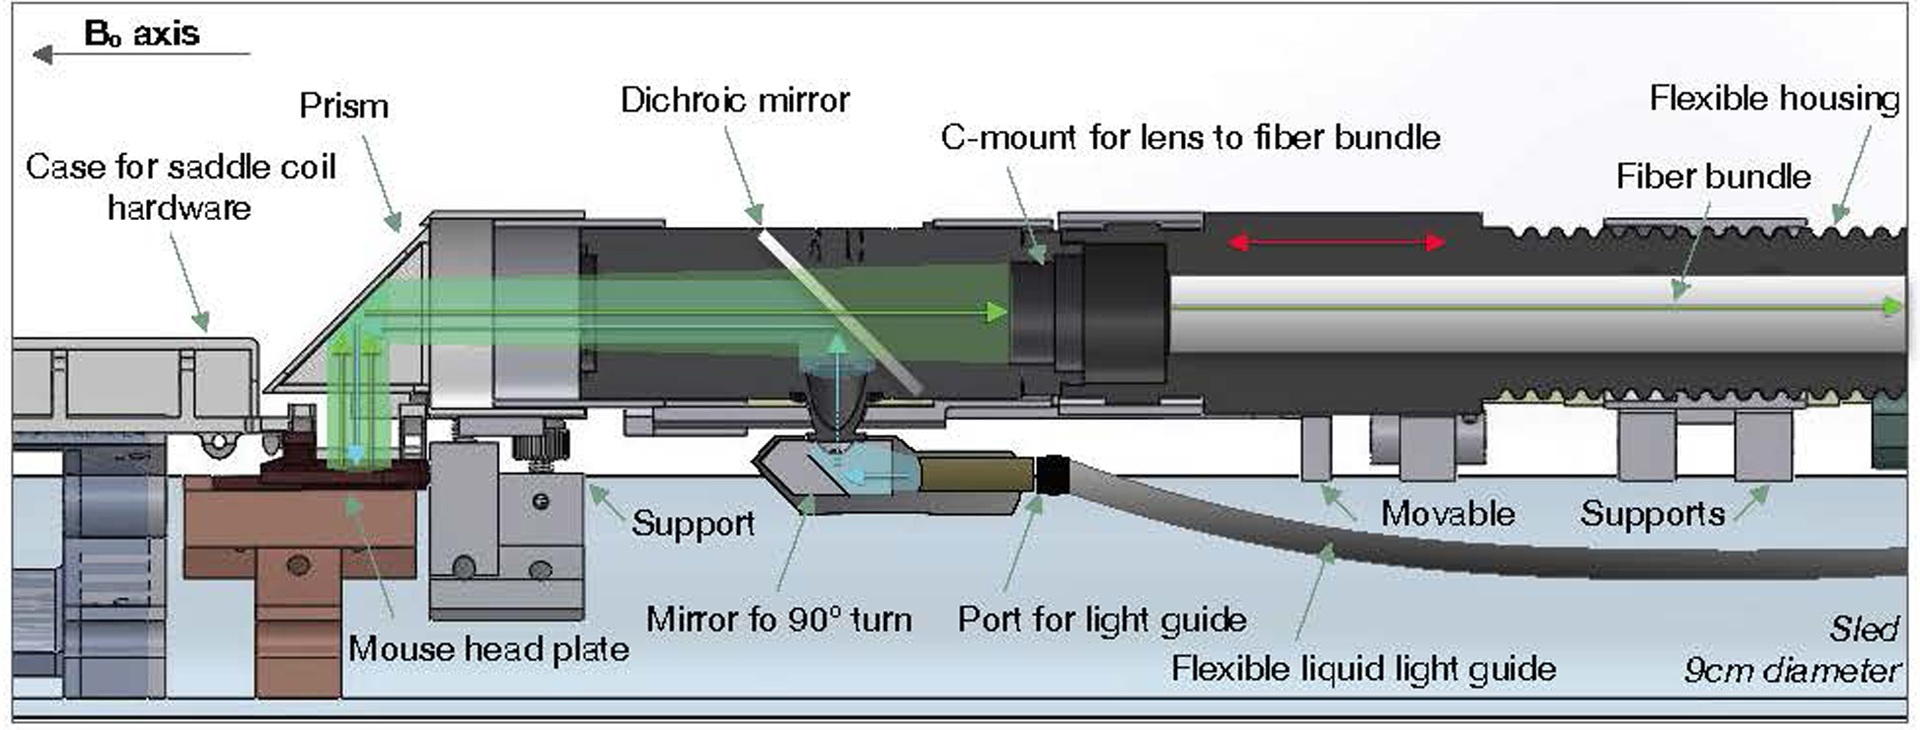
A diagram of the light path overlaid on a cross section of our optical apparatus. The light enters the system via a flexible liquid light guide. At the base of the telecentric lens, the light is bent by 90° degrees to enter the telecentric lens. Upon entering the telecentric lens, the excitation light reflects off of the dichroic mirror and is redirected along the length of the telecentric lens and into the prism at the end of the apparatus. The prism redirects the excitation light onto the mouse cortex. The emission light is similarly re-directed by the prism along the length of the telecentric lens (this time traveling in the opposite direction) and passes through the dichroic mirror. The fiber bundle array is mounted onto the end of the telecentric lens and transmits the light to the room neighboring the magnet where the camera is housed. To focus the Ca2+ image, the fiber bundle moves relative to the telecentric lens (red arrows).
Extended Data Fig. 3. Videos of Ca2+ data pre- and post-image processing.
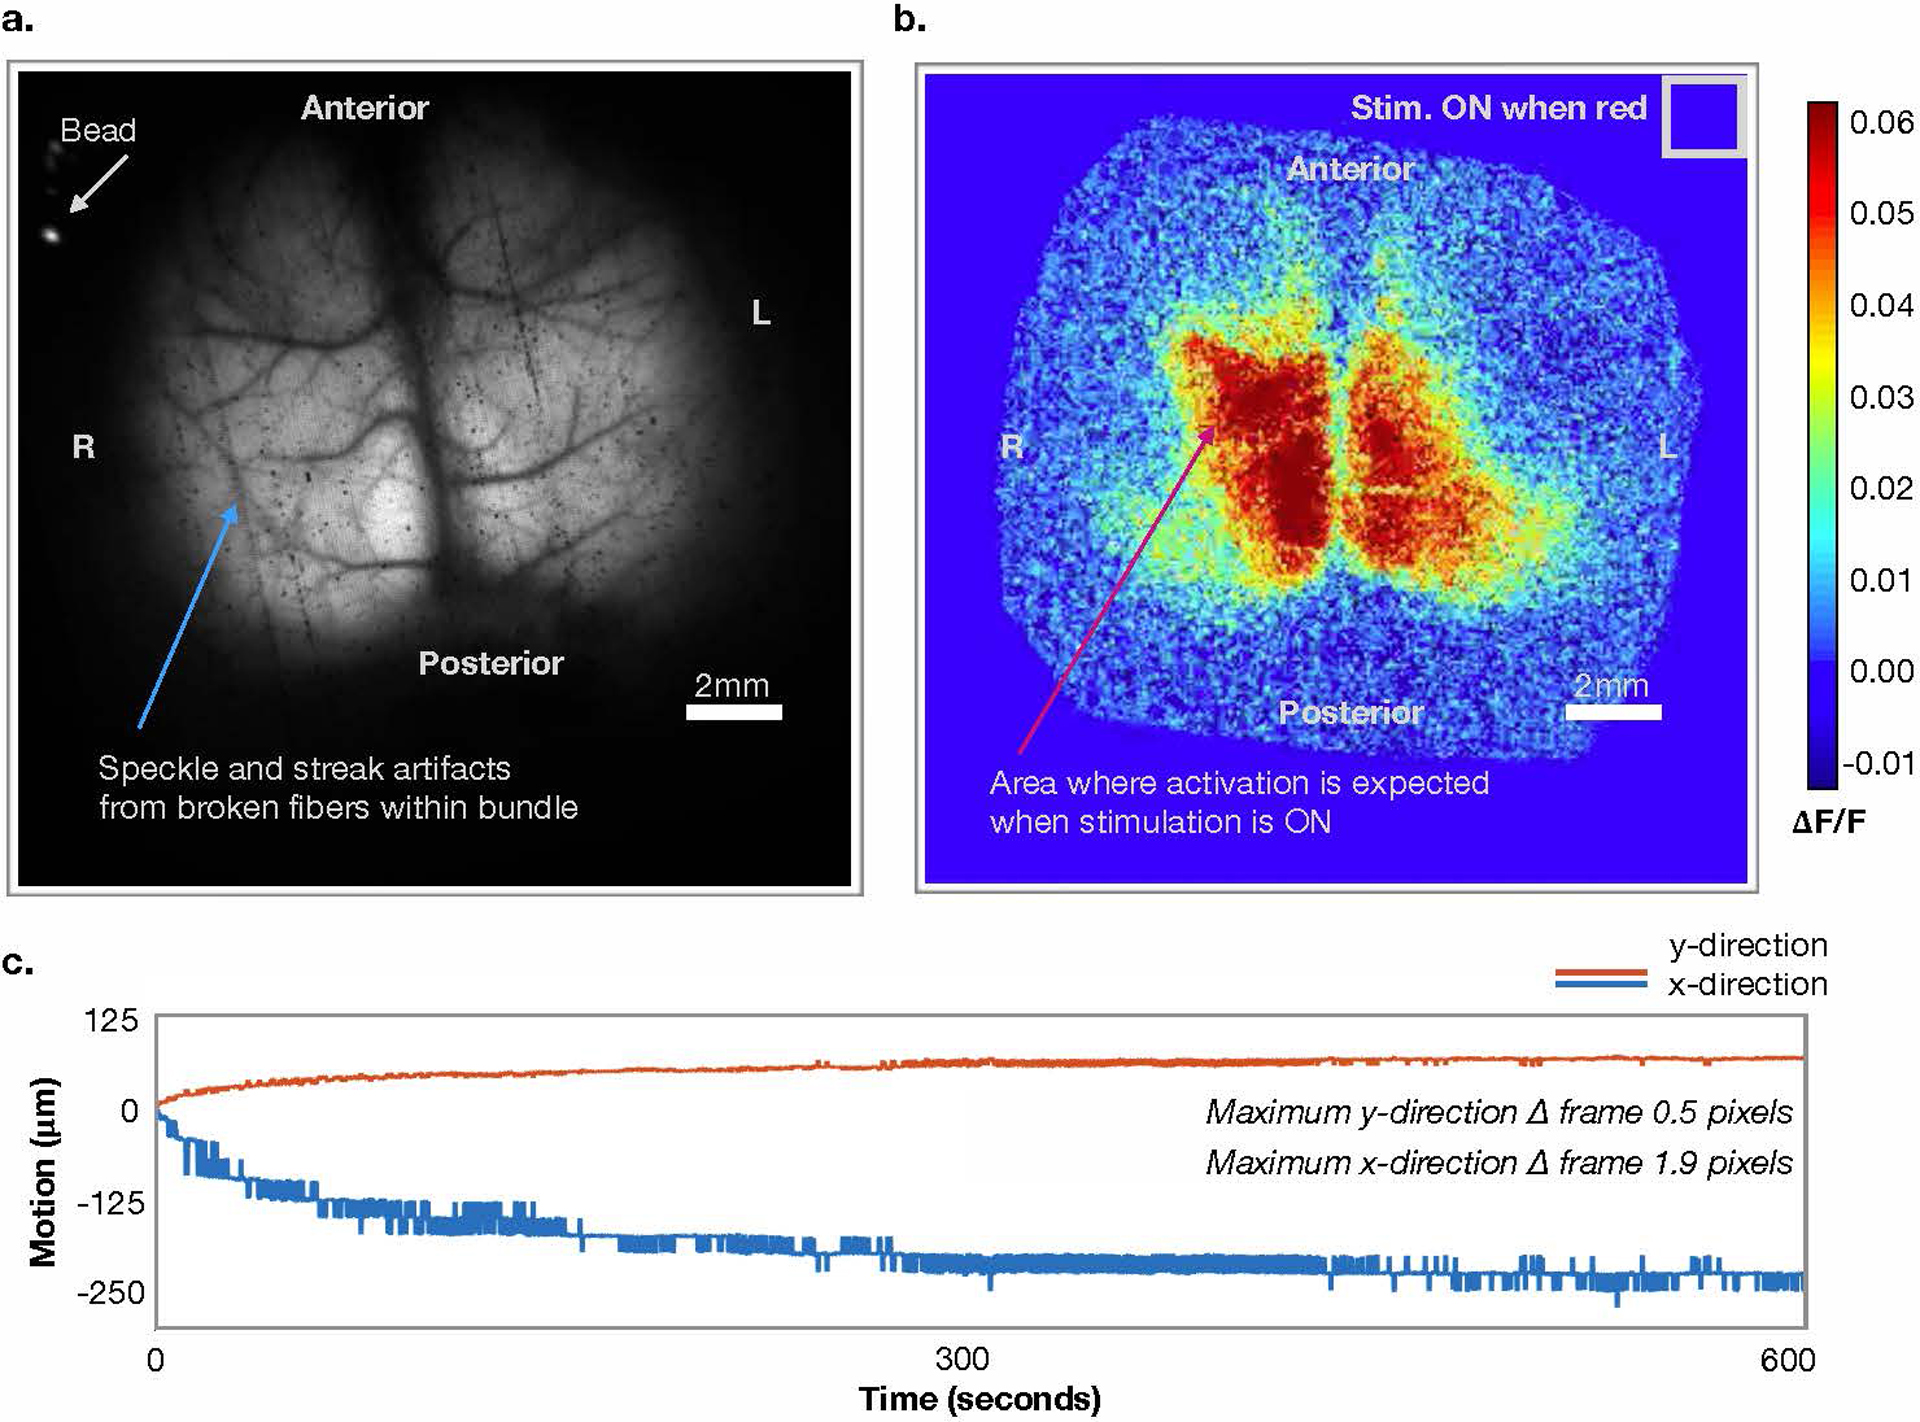
Representative frames from example videos (Supplementary Video 1 & 2) a) Raw (unprocessed) fluorescence signal (cyan wavelength). A fluorescent bead placed within the dental cement at the right anterior edge of the surgical preparation is indicated (white arrow). The bead is used for right and left identification and motion correction. b) Data from a) after processing. c) Estimated motion parameters based on position of fluorescent bead.
Extended Data Fig. 4. Ray-casting algorithm to create the TOF MR angiogram-projected surface image for multi-modal image registration.
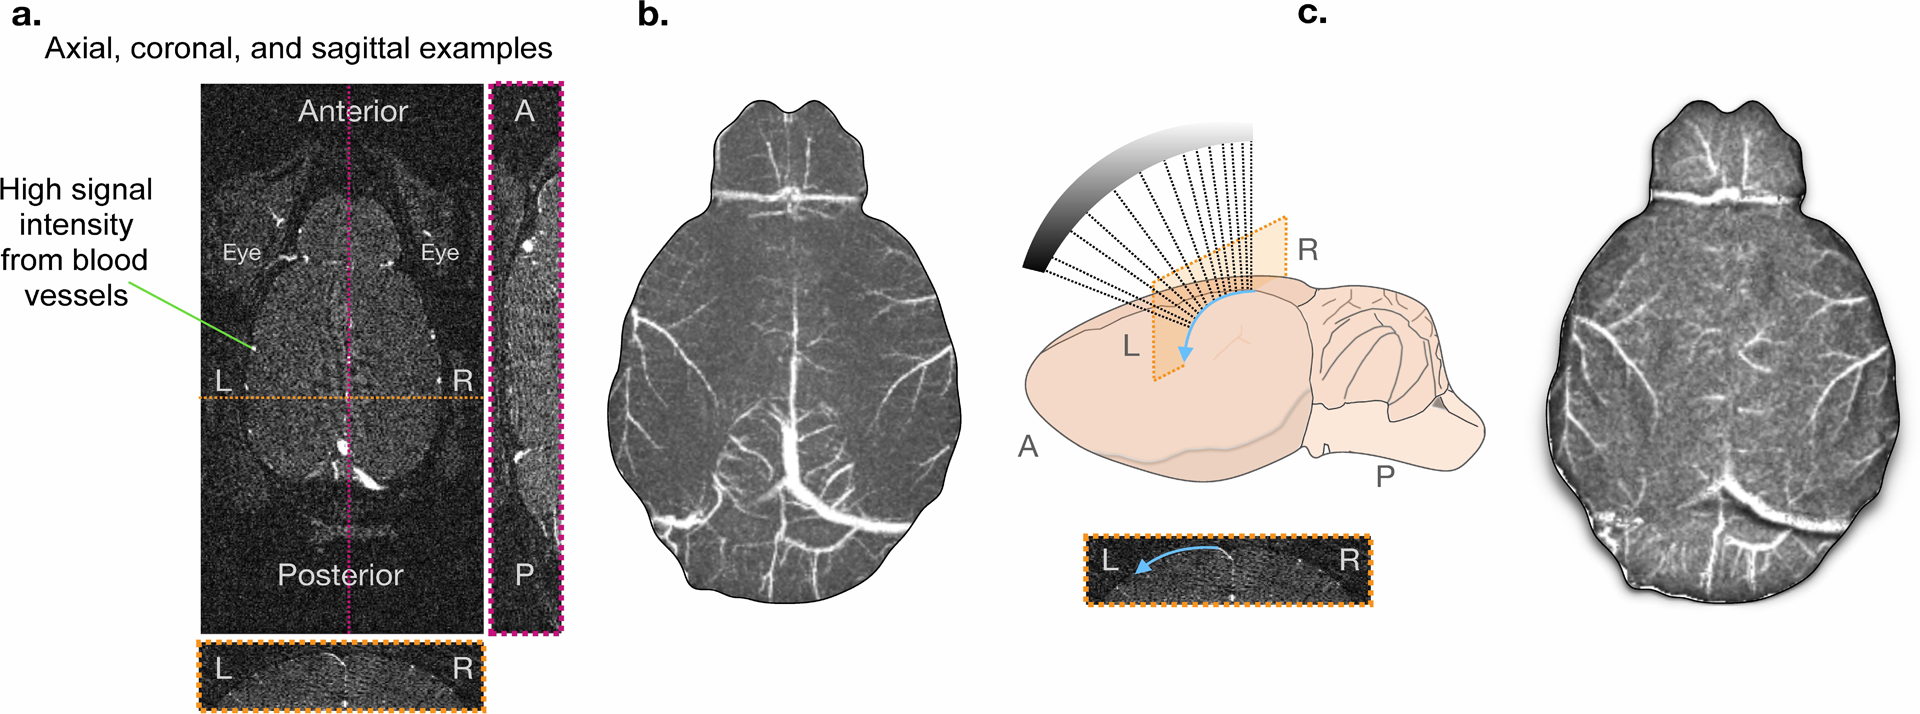
a) Three example views of the raw 3D MR angiogram data. Blood vessels have high MR signal intensity. b) Example of a maximum intensity projection (MIP) image (left) and a schematic of our ray-casting approach (right). The MIP is generated following masking which removes signal from anatomy outside of the brain. To show the curvature of the brain surface, and to isolate the blood vessels on the surface of the brain, we use the ray-casting algorithm. We project the MR data along the axis perpendicular to the optical imaging plane. Each pixel is shaded based on brain curvature. c) The resulting 2D projection of the MR image.
Extended Data Fig. 5. Average responses to unilateral hind-paw stimulation.
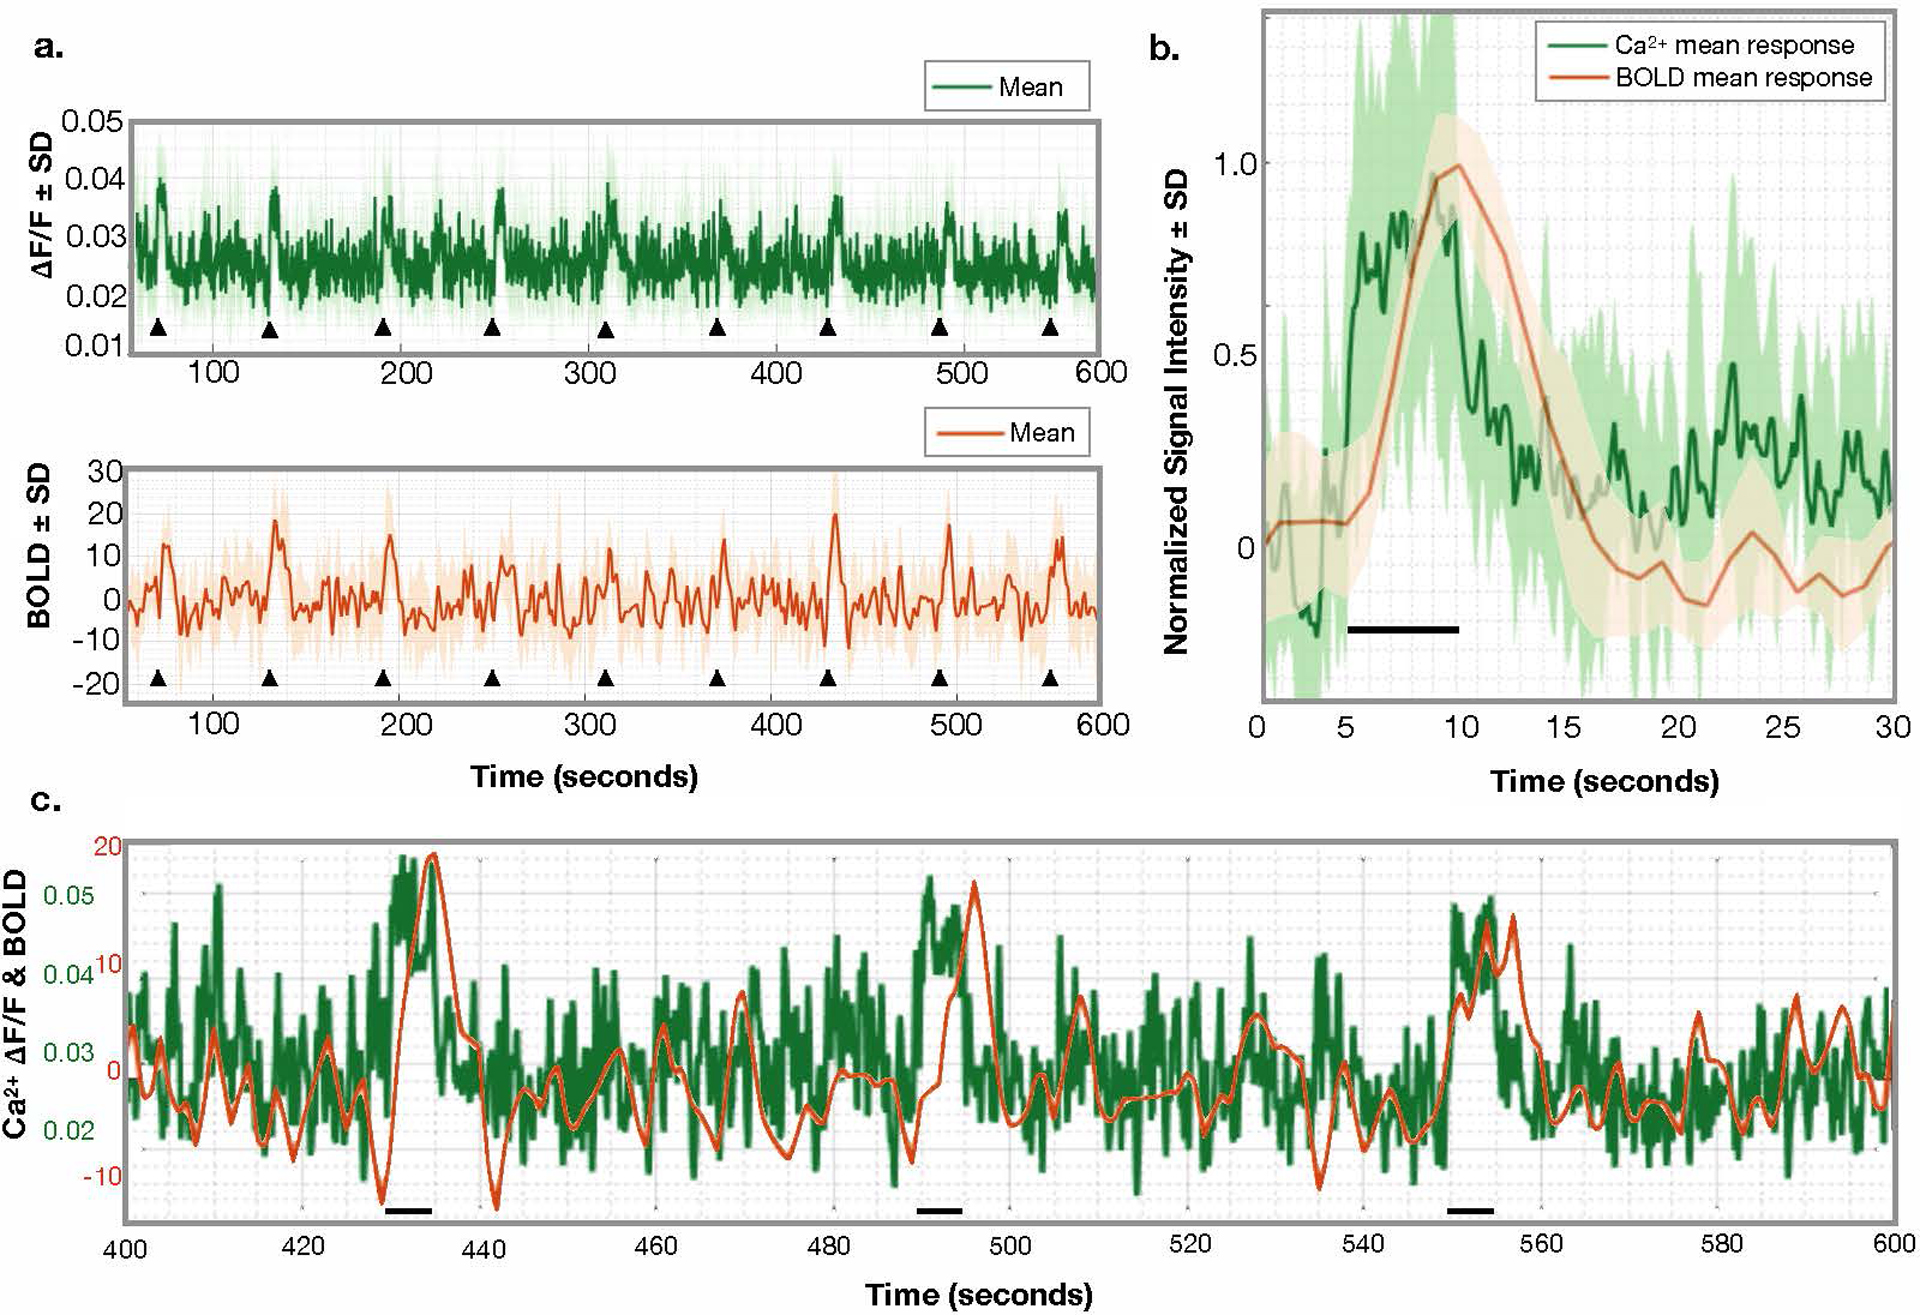
a) Average responses to nine stimuli across N=6 mice. Stimulus onset is denoted by black triangles. Ca2+ data (top) and the corresponding fMRI data (bottom) are plotted. The fMRI signal is normalized to the mean. The standard deviation within the responding ROI is shown as shading. b) The average normalized (to peak amplitude), stimulus response across N=6 mice, n=9 stimuli each. This shows the different temporal dynamics of these two modalities. The fMRI signal is delayed, relative to stimulus presentation and the Ca2+ signal. c) A zoomed in view of the Ca2+ and BOLD signals. Since the Ca2+ signal is collected at a relatively high temporal resolution (10Hz), it appears in to be noisy. By zooming in the fast kinetics of these data are shown. No filtering of the Ca2+ signal has been applied.
Extended Data Fig. 6. Localization of Ca2+ and fMRI responses to stimuli.
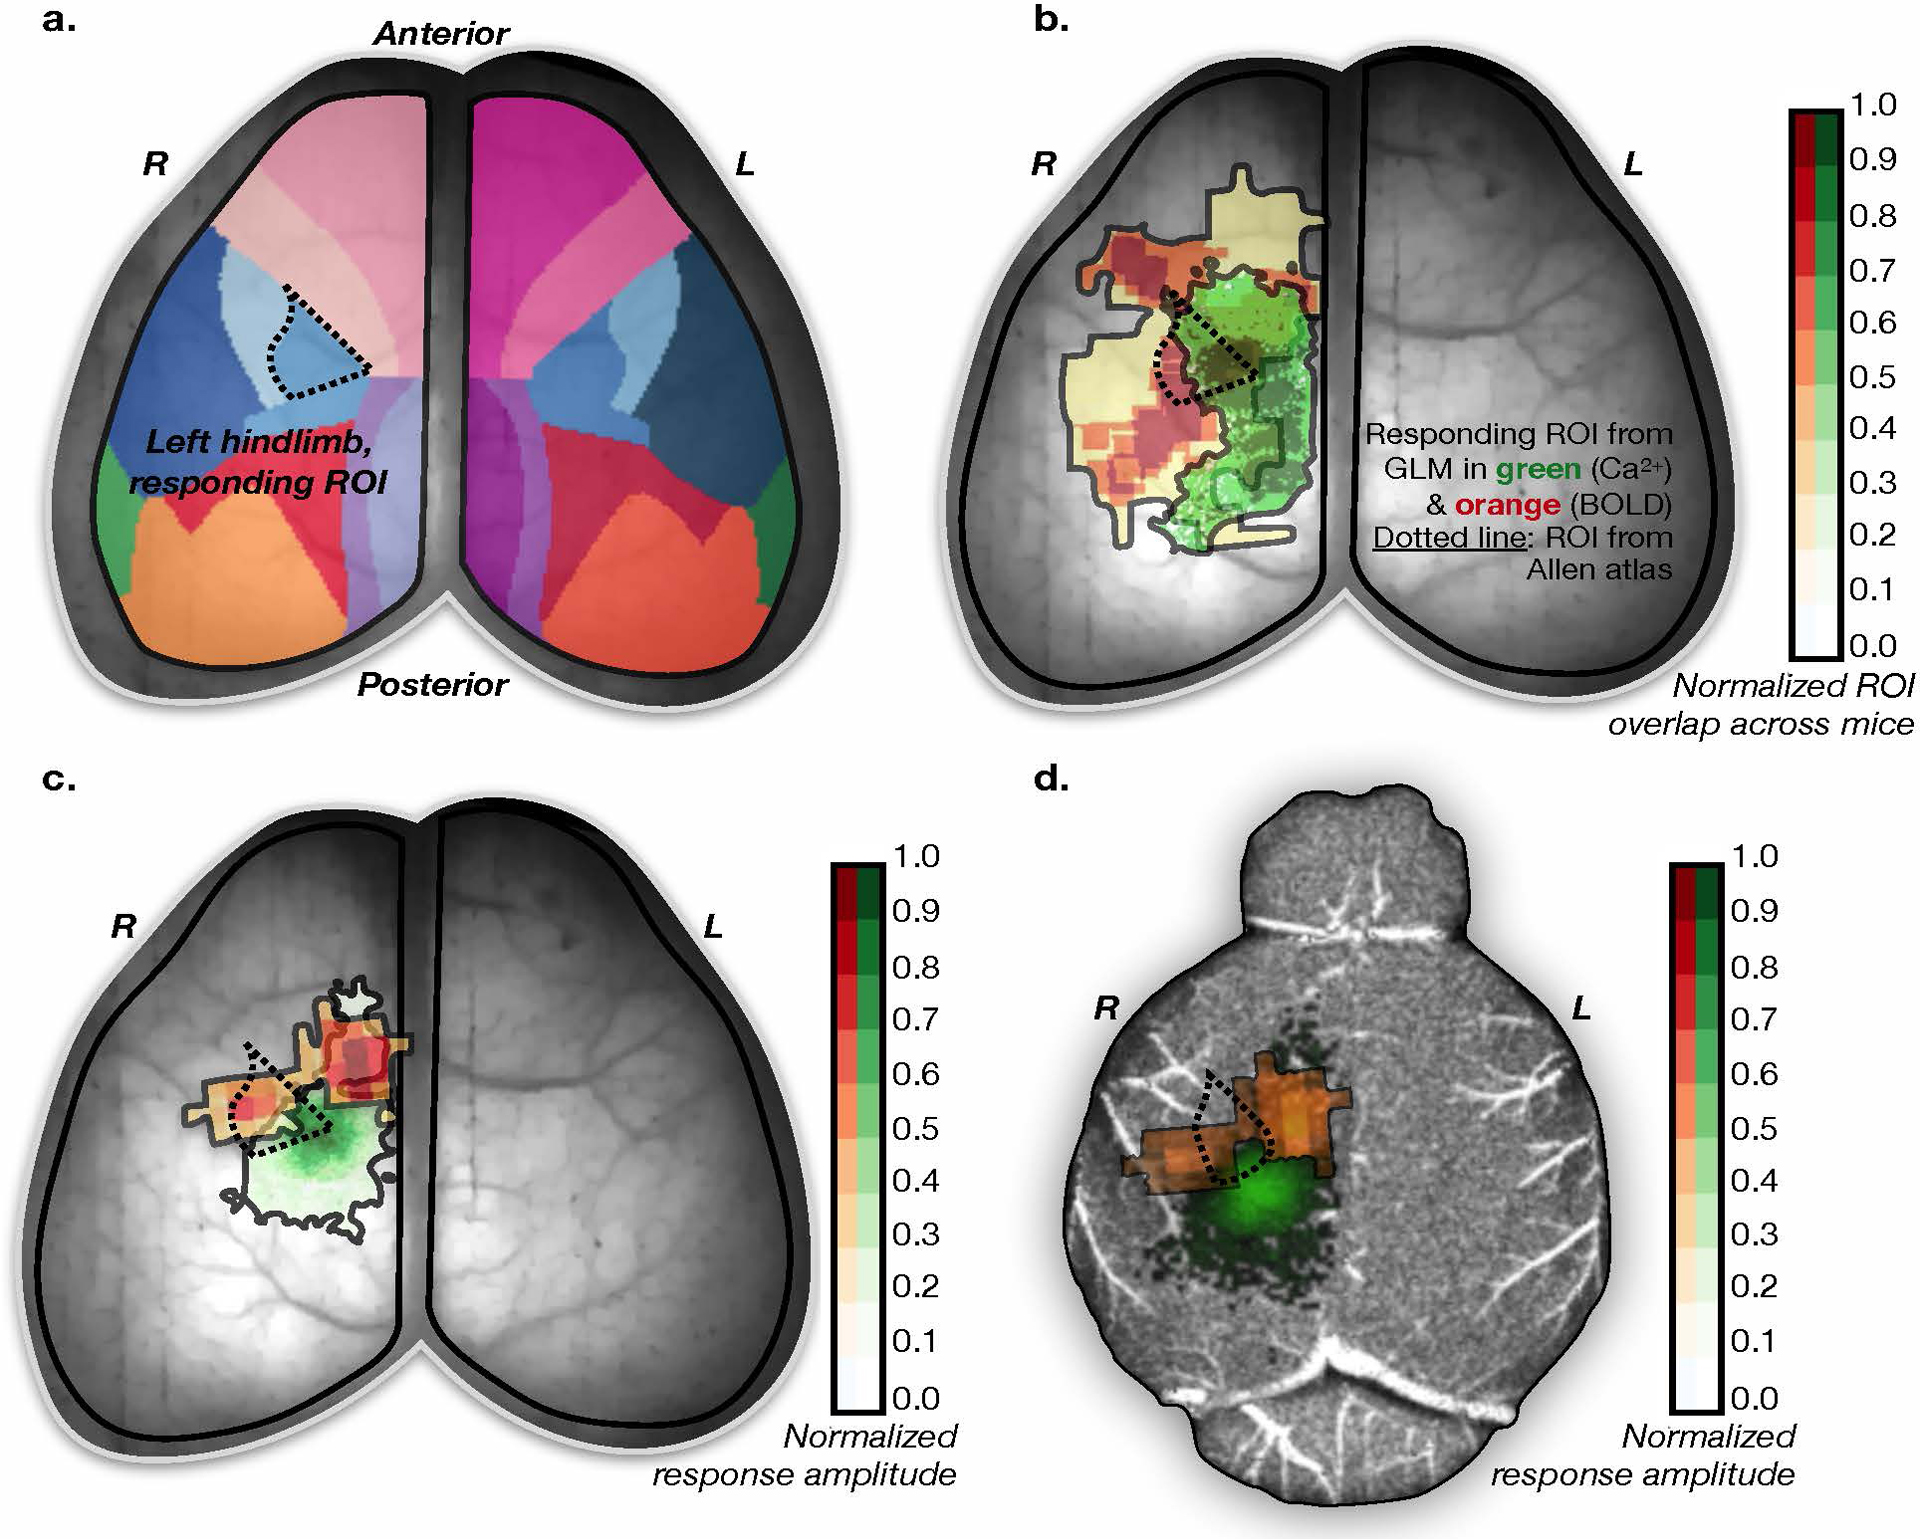
a) A surface projection of the down-sampled Allen Atlas overlaid on the optical data of an example mouse. The ROI expected to respond to the presented unilateral hind limb stimuli is indicated with a dotted line. b) Responding ROIs from all mice from both modalities normalized to the maximum response amplitude. Calculated as follows if we had two instead of six mice: if voxel (i,j) for mouse #1 on average showed a 40% response relative to the maximum responding voxel for that mouse, and voxel (i,j) for mouse #2 on average showed a 60% response relative to the maximum responding voxel for mouse #2, then voxel (i,j) would be color-coded to 50%. The expected responding ROI from the Allen Atlas is shown as a dotted line. c) An example responding ROI from one mouse overlaid on the optical data. d) The same example responding ROIs (from the same mouse) overlaid on the projected MRI data.
Extended Data Fig. 7. Gamma-variant convolution model applied within responding ROIs identified by GLM.
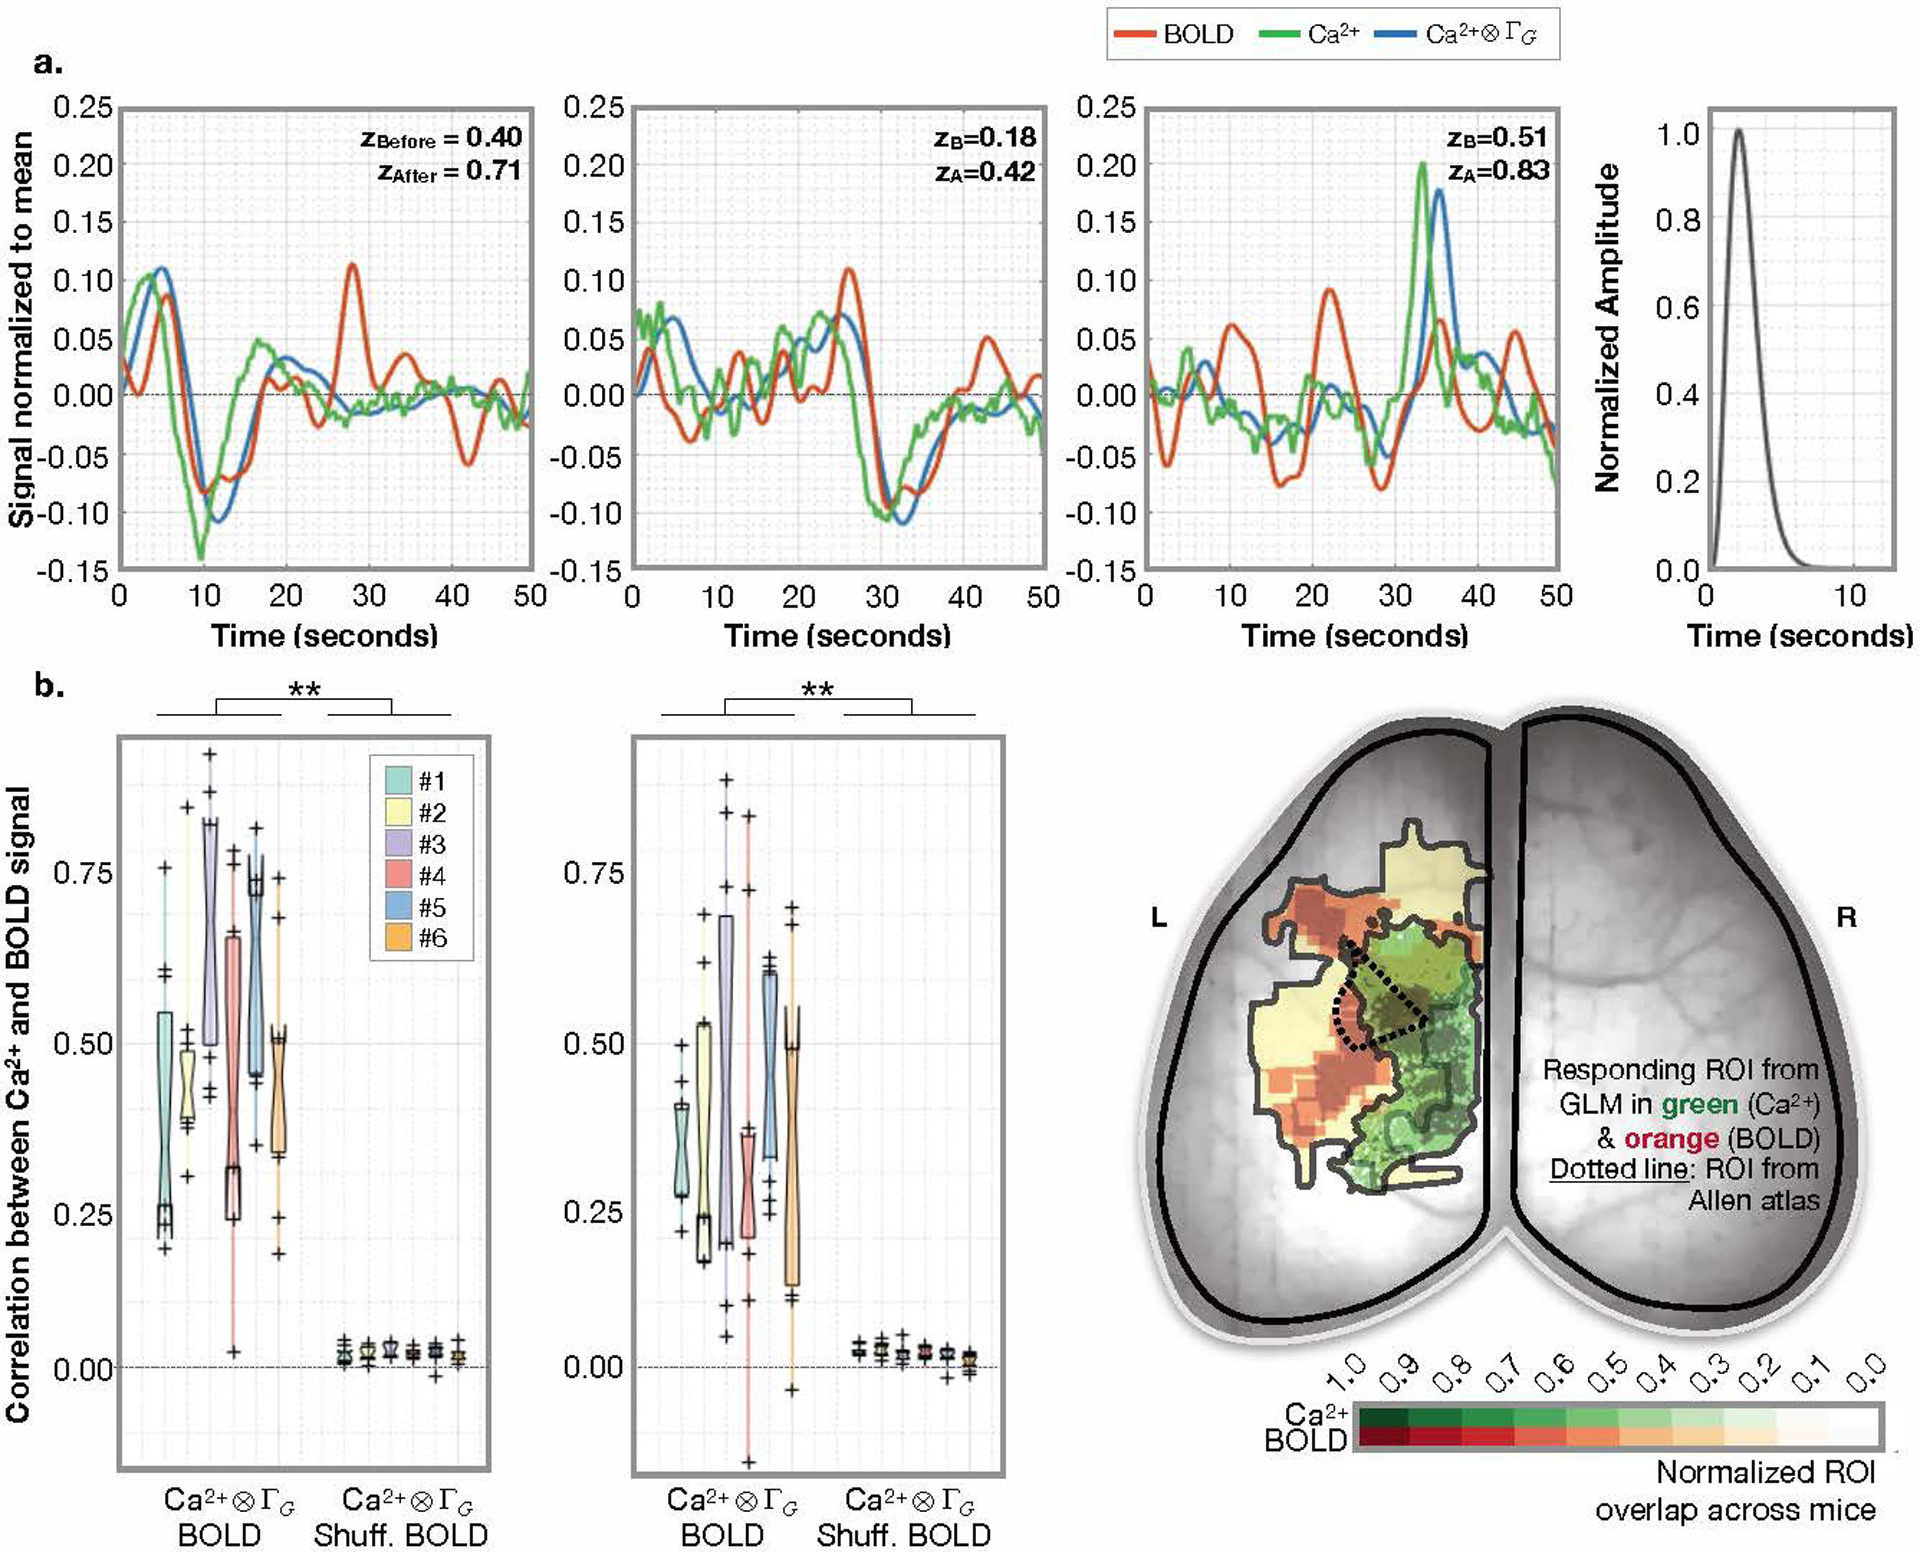
a) Three example 50-second windows from N=3 mice (left and middle panels). Ca2+ signal, averaged within the responding ROI, before (green) and after (blue) applying the gamma-variant convolution. BOLD signal (orange), averaged within the responding ROI. The average predicted hemodynamic response function (HRF) from these three examples (right panel). Goodness of fit assessed by correlating (Fisher’s Z transformed Pearson’s correlation) the Ca2+ signal convolved with the predicted HRF (blue) and the BOLD signal (orange). b) The correlations for N=6 mice (n=4 session, n=11 windows, i.e. 44 data points per mouse) using filtered [0.04–0.1Hz] (left) or unfiltered (middle) data. Each 50-second window contains the presentation of one unilateral hind-paw stimulus. The Ca2+ and BOLD responding ROIs are not fixed across mice, as illustrated (right) [reproduced from Extended Data Fig. 6]. For the boxplots, the central line is the median, the minima and maxima of the box extends to the 25th and 75th percentiles, whiskers extend to all data points, and outliers (data points beyond the 25th to 75th percentiles) are denoted by ‘+’.
Extended Data Fig. 8. Convolution model applied within Allen Atlas ROIs is not affected by window, frequency band, scan number or mouse.
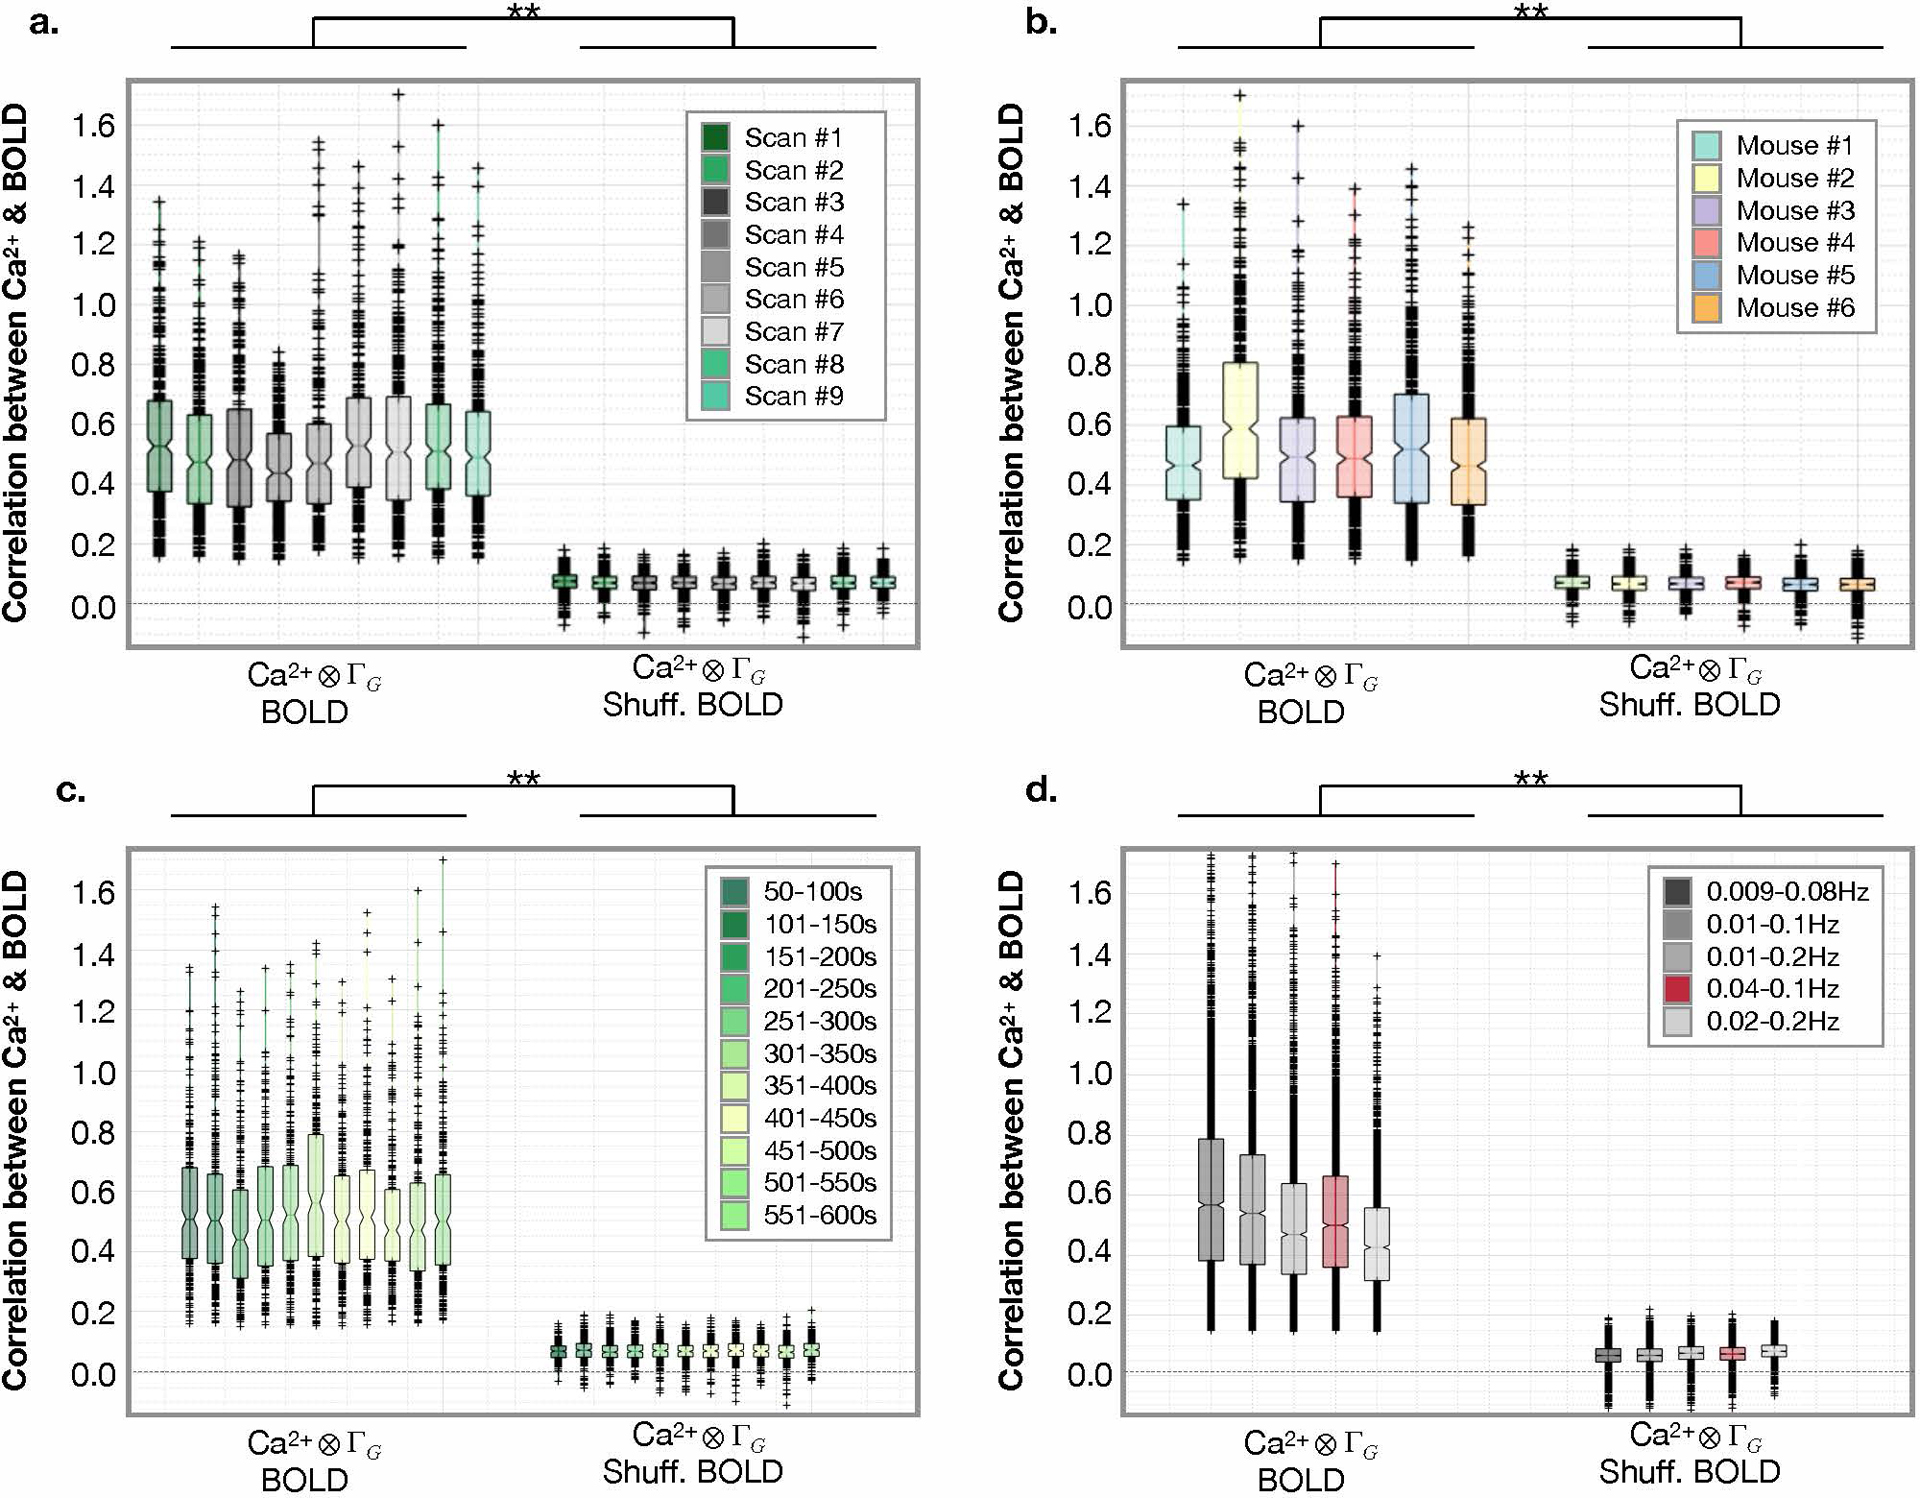
Correlation between Ca2+ and BOLD signals. a) Correlation strengths compared across nine scans spanning the duration of our acquisitions. Scans where no stimulus are presented (grey), and during unilateral hind-paw stimulation (green), are different from the null (BOLD time points scrambled). b) Correlation strengths compared across mice. c) Correlation strengths compared between windows. d) Correlation strengths compared within different frequency filters. All show the same relationship to the null using a two-samples t-test. For boxplots, the central line is the median, the minima and maxima of the box extends to the 25th and 75th percentiles, whiskers extend to all data points, and outliers (data points beyond the 25th to 75th percentiles) are denoted by ‘+’. No correction for multiple comparisons was applied.
Extended Data Fig. 9. Parcellation results are independent of frequency filter across mice and parcel, variance is caused by parcel size.
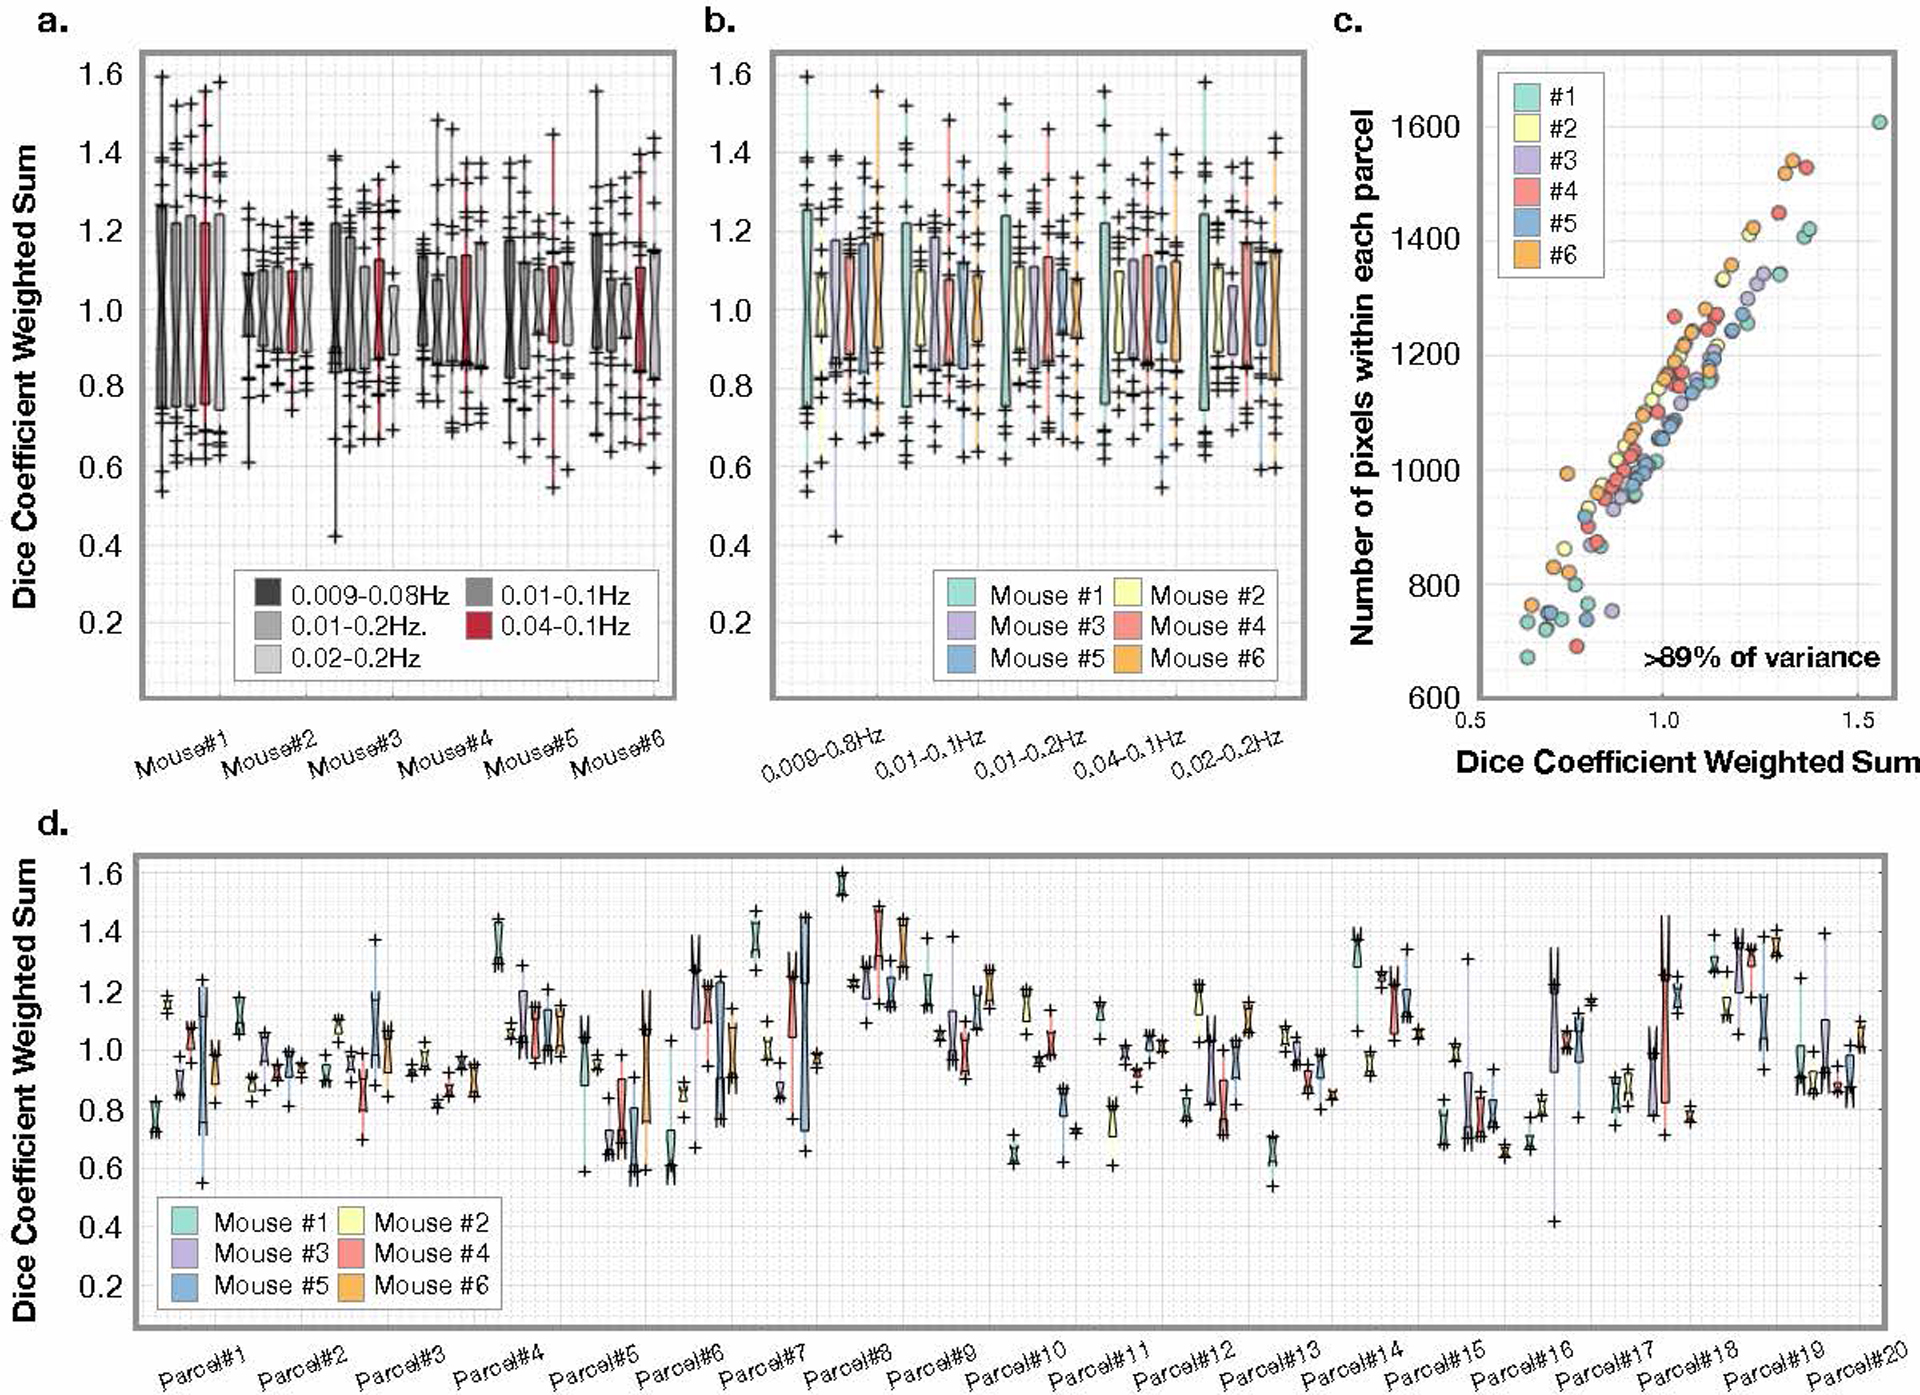
a) Variance across parcels for each mouse for n=5 frequency filters. b) Variance due to parcel for each filter for N=6 mice. Neither frequency filter, nor mouse, captures the variance in the Dice coefficient observed. c) Variance is highly correlated with parcel size. d) Variance across frequency filters for N=6 mice. For the boxplots, the central line is the median, the minima and maxima of the box extends to the 25th and 75th percentiles, whiskers extend to all data points, and outliers (data points beyond the 25th to 75th percentiles) are denoted by ‘+’.
Extended Data Fig. 10. Inter- vs. intra-hemisphere connectivity strength patterns between Ca2+ and BOLD vary regionally and by brain functional area.
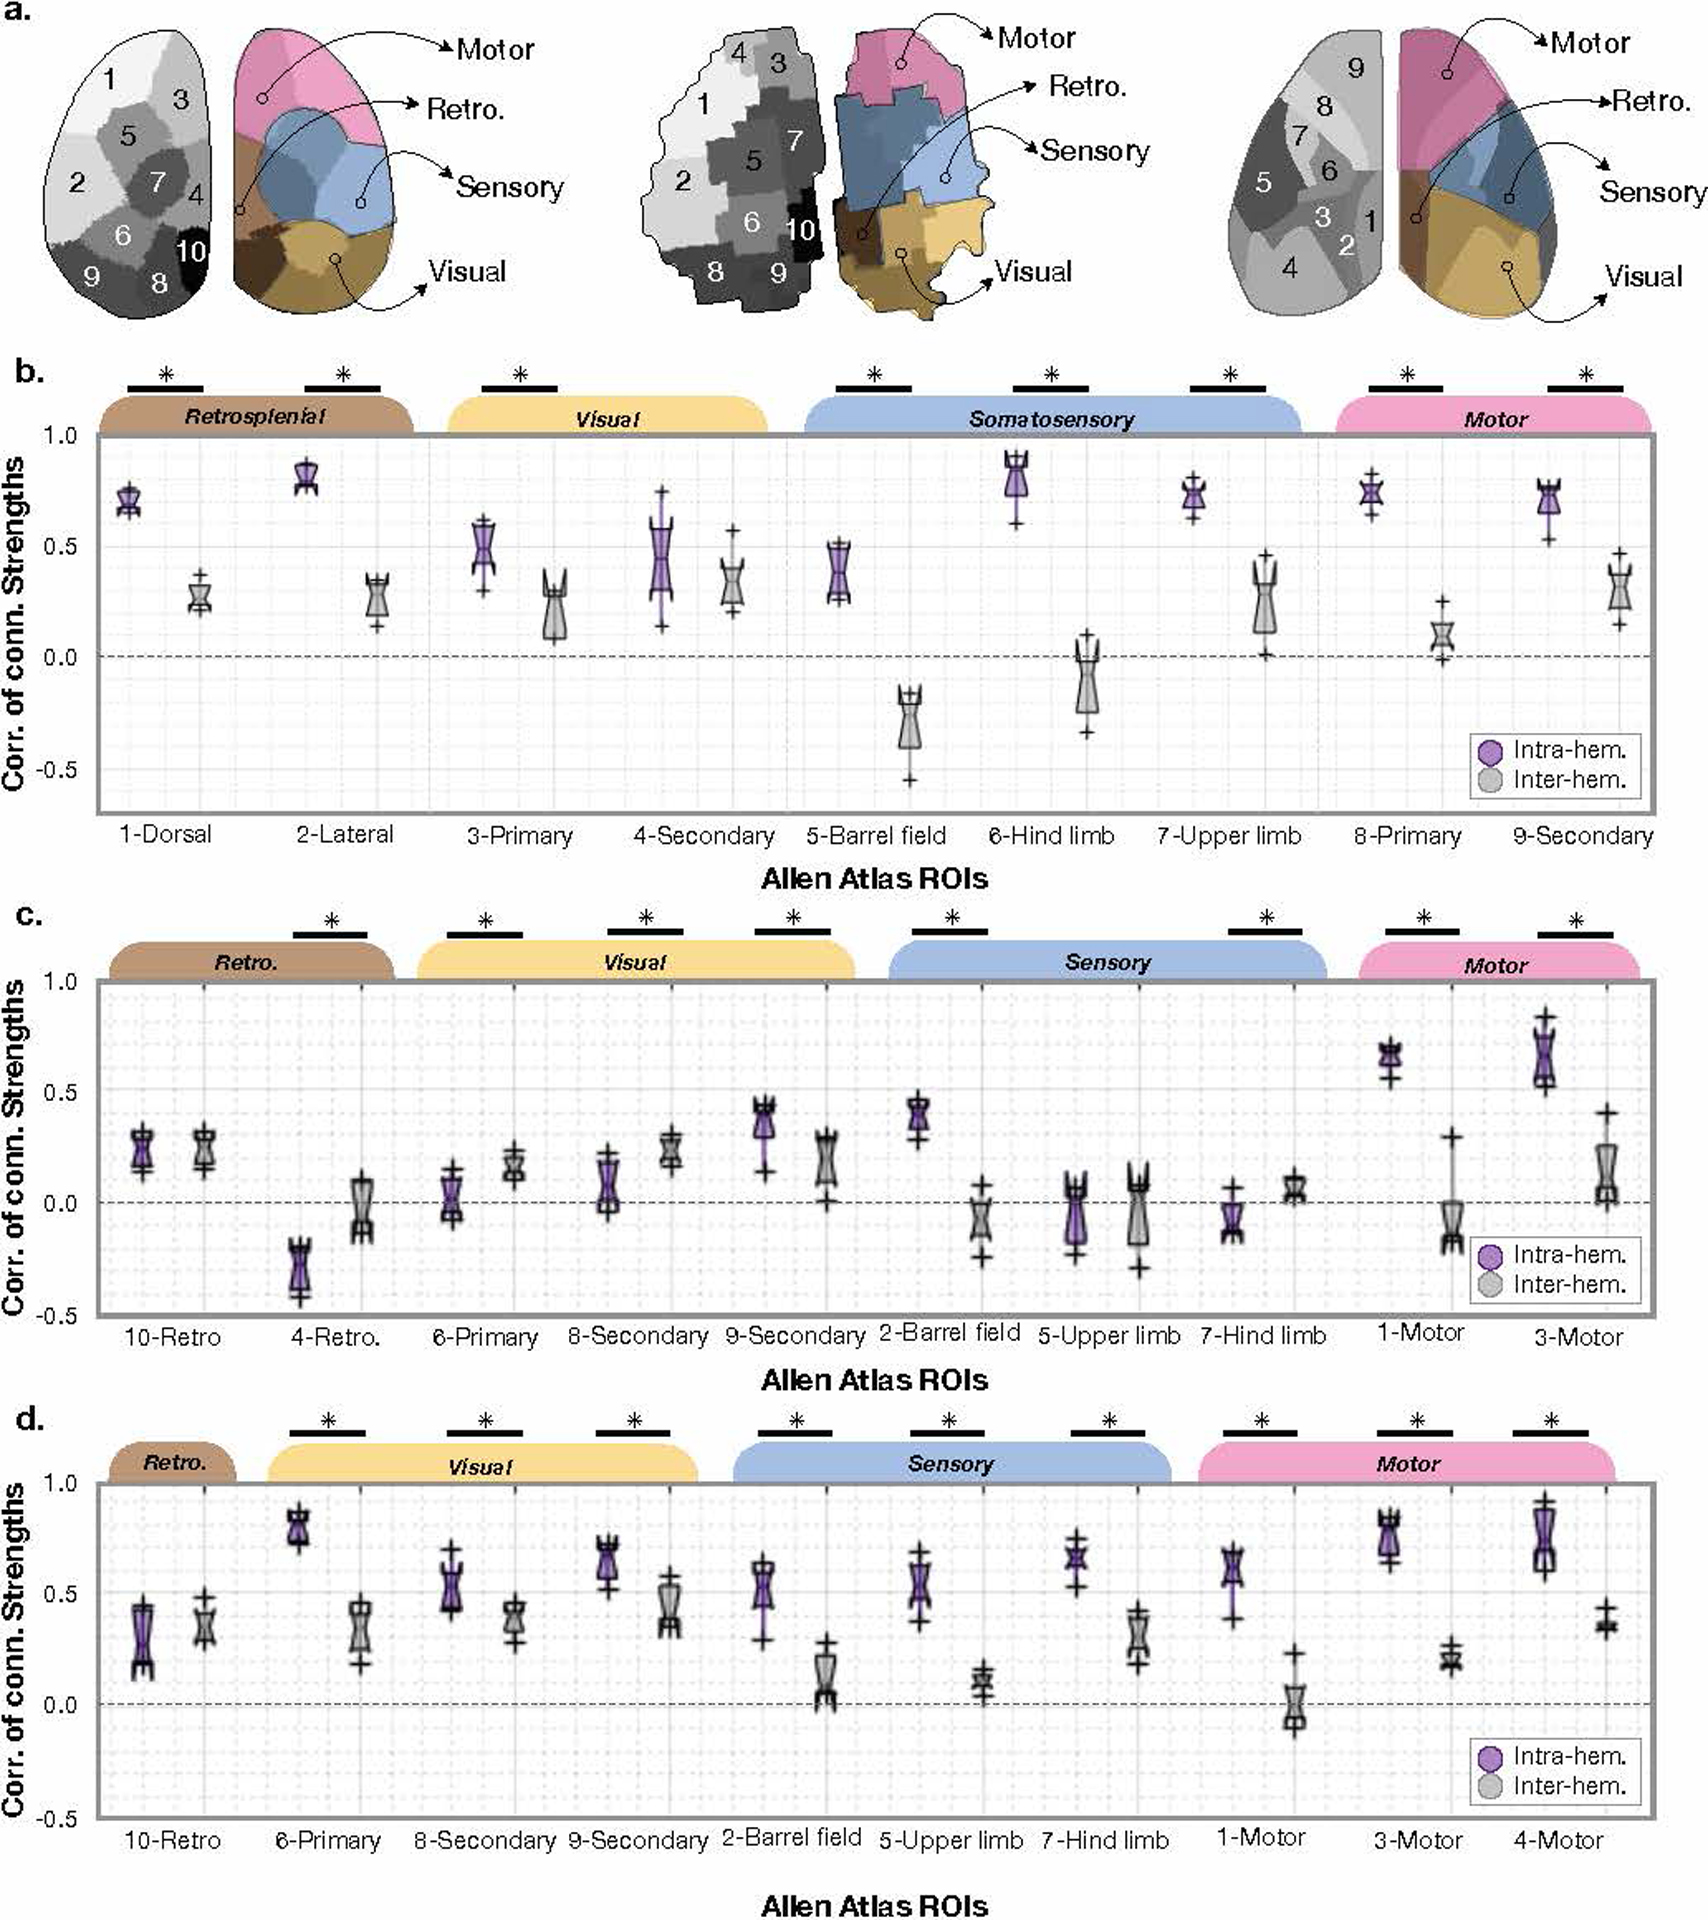
a) and b) are reproduced for reference from Figure 6. c) and d) are equivalent plots to b) showing the same information (inter-, purple, and intra-, grey, hemisphere regional connectivity strengths) for the three parcellations shown in a). b) shows results from the Allen atlas, c) shows results from the Ca2+ parcellation, and d) shows results from the BOLD parcellation. For the boxplots, the central line is the median, the minima and maxima of the box extends to the 25th and 75th percentiles, whiskers extend to all data points, and outliers (data points beyond the 25th to 75th percentiles) are denoted by ‘+’.
Supplementary Material
Acknowledgements
The authors would like to thank all members of the Multiscale Imaging and Spontaneous Activity in Cortex (MISAC) collaboration at Yale University for their valuable contributions to this project. We thank Peter Brown for valuable input on the design and building the RF saddle coil and the design and building of the telecentric lens holder. We thank Anthony DeSimone, Peter Brown, and the Yale School of Medicine electronics and machine shop for help with rebuilding the telecentric lens. We thank Cheryl Lacadie for help with data registration. This work was supported by funding from the NIH: R01 MH111424 - RTC, MCC & FH as well as U01 N2094358 - MCC & RTC.
Footnotes
Ethics declaration
We declare that none of the authors have competing financial or non-financial interests as defined by Nature Research.
REFERENCES
- 1.Ross WN. Understanding calcium waves and sparks in central neurons. Nat Rev Neurosci 13, 157–168 (2012). [DOI] [PMC free article] [PubMed] [Google Scholar]
- 2.Barson D et al. Simultaneous mesoscopic and two-photon imaging of neuronal activity in cortical circuits. Nat Methods 17, 107–113 (2020). [DOI] [PMC free article] [PubMed] [Google Scholar]
- 3.Ogawa S et al. Brain magnetic resonance imaging with contrast dependent on blood oxygenation. Proc Natl Acad Sci USA, 87, 9868–9872 (1990). [DOI] [PMC free article] [PubMed] [Google Scholar]
- 4.Albers F et al. Multimodal functional neuroimaging by simultaneous BOLD fMRI and fiber-optic calcium recordings and optogenetic control. Mol Imaging Biol, 20, 171–182 (2018). [DOI] [PubMed] [Google Scholar]
- 5.Hyder F et al. Neurovascular and neurometabolic couplings in dynamic calibrated fMRI: Transient oxidative neuroenergetics for block-design and event-related paradigms. Front Neuroenerg, 2, 1–11 (2019). [DOI] [PMC free article] [PubMed] [Google Scholar]
- 6.Ma Y et al. Resting-state hemodynamics are spatiotemporally coupled to synchronized and symmetric neural activity in excitatory neurons. Proc Natl Acad Sci USA, 113, E8463–E8471 (2016). [DOI] [PMC free article] [PubMed] [Google Scholar]
- 7.Keilholz SD. The neural basis of time-varying resting-state functional connectivity. Brain Connect, 4, 769–779 (2014). [DOI] [PMC free article] [PubMed] [Google Scholar]
- 8.Mateo C et al. Entrainment of Arteriole Vasomotor Fluctuations by Neural Activity Is a Basis of Blood-Oxygenation-Level-Dependent “Resting-State” Connectivity. Neuron, 96, 936–948 (2017). [DOI] [PMC free article] [PubMed] [Google Scholar]
- 9.Desjardins M et al. Awake Mouse Imaging: From Two-Photon Microscopy to Blood Oxygen Level-Dependent Functional Magnetic Resonance Imaging. Biol Psychiatry Cogn Neurosci Neuroimaging, 4, 533–542 (2019). [DOI] [PMC free article] [PubMed] [Google Scholar]
- 10.Kennerley AJ. et al. Is optical imaging spectroscopy a viable measurement technique for the investigation of the negative BOLD phenomenon? A concurrent optical imaging spectroscopy and fMRI study at high field (7 T). Neuroimage, 61, 10–20 (2012). [DOI] [PMC free article] [PubMed] [Google Scholar]
- 11.Kennerley AJ. et al. Concurrent fMRI and optical measures for the investigation of the hemodynamic response function. Magn Reson Med, 54, 354–365 (2005). [DOI] [PubMed] [Google Scholar]
- 12.Schulz K et al. Simultaneous BOLD fMRI and fiber-optic calcium recording in rat neocortex. Nat Methods, 9, 597–602 (2012). [DOI] [PubMed] [Google Scholar]
- 13.Liang Z et al. Simultaneous GCaMP6-based fiber photometry and fMRI in rats. J Neurosci Methods, 289, 31–38 (2017). [DOI] [PMC free article] [PubMed] [Google Scholar]
- 14.Schwalm M et al. Cortex-wide BOLD fMRI activity reflects locally-recorded slow oscillation-associated calcium waves. Elife, 6, e27602 (2017). [DOI] [PMC free article] [PubMed] [Google Scholar]
- 15.Wang M et al. Brain-state dependent astrocytic Ca2+ signals are coupled to both positive and negative BOLD-fMRI signals. Proc Natl Acad Sci USA, 115, E1647–E1656 (2018). [DOI] [PMC free article] [PubMed] [Google Scholar]
- 16.Schlegel F et al. Fibre-optic implant for simultaneous fluorescence-based calcium recordings and BOLD fMRI in mice. Nat Protoc, 13, 840–855 (2018). [DOI] [PubMed] [Google Scholar]
- 17.Lien ES. et al. Genome-wide atlas of gene expression in the adult mouse brain. Nature, 445, 168–176 (2007). [DOI] [PubMed] [Google Scholar]
- 18.Schroeter A et al. Specificity of stimulus-evoked fMRI responses in the mouse: the influence of systemic physiological changes associated with innocuous stimulation under four different anesthetics. Neuroimage, 94, 372–384 (2014). [DOI] [PubMed] [Google Scholar]
- 19.Zhang S & Murphy TH. Imaging the impact of cortical microcirculation on synaptic structure and sensory-evoked hemodynamic responses in vivo. PLoS Biol, 5, e119 (2007). [DOI] [PMC free article] [PubMed] [Google Scholar]
- 20.Cramer JV. et al. In vivo widefield calcium imaging of the mouse cortex for analysis of network connectivity in health and brain disease. Neuroimage, 199, 750–584 (2019). [DOI] [PubMed] [Google Scholar]
- 21.Turner R How much cortex can a vein drain? Downstream dilution of activation-related cerebral blood oxygenation changes. Neuroimage, 16, 1062–1067 (2002). [DOI] [PubMed] [Google Scholar]
- 22.Ma Y et al. Wide-field optical mapping of neural activity and brain haemodynamics: considerations and novel approaches. Philos Trans R Soc Lond B Biol Sci, 371, 1–17 (2016). [DOI] [PMC free article] [PubMed] [Google Scholar]
- 23.Bauer AQ. et al. Optical imaging of disrupted functional connectivity following ischemic stroke in mice. Neuroimage, 99, 388–401 (2014). [DOI] [PMC free article] [PubMed] [Google Scholar]
- 24.White BR. et al. Imaging of functional connectivity in the mouse brain. PLoS One, 6, e16322 (2011). [DOI] [PMC free article] [PubMed] [Google Scholar]
- 25.Fox MD. et al. The human brain is intrinsically organized into dynamic, anticorrelated functional networks. Proc Natl Acad Sci USA, 102, 9673–9678 (2005). [DOI] [PMC free article] [PubMed] [Google Scholar]
- 26.Shen X, Papademetris X and Constable RT. Graph-theory based parcellation of functional subunits in the brain from resting-state fMRI. Neuroimage, 50, 1027–1035 (2010). [DOI] [PMC free article] [PubMed] [Google Scholar]
- 27.van Oort ESB. et al. Functional parcellation using time courses of instantaneous connectivity. Neuroimage, 170, 31–40 (2018). [DOI] [PubMed] [Google Scholar]
- 28.Arslan S et al. Human brain mapping: A systematic comparison of parcellation methods for the human cerebral cortex. Neuroimage, 170, 5–30 (2018). [DOI] [PubMed] [Google Scholar]
- 29.Eickhoff SB, Yeo BTT and Genon S Imaging-based parcellation son the human brain. Nat Rev Neurosci, 19, 672–686 (2018). [DOI] [PubMed] [Google Scholar]
- 30.Shen X et al. Groupwise whole-brain parcellation from resting-state fMRI data for network node identificatio. Neuroimage, 82, 403–15 (2013). [DOI] [PMC free article] [PubMed] [Google Scholar]
- 31.Uhlirova H et al. The roadmap for estimation of cell-type-specific neuronal activity from non-invasive measurements. Philos Trans R Soc Lond B Biol Sci, 371, 20150356 (2016). [DOI] [PMC free article] [PubMed] [Google Scholar]
- 32.Scaglione A et al. Trial-totrial variability in the responses of neurons carries information about stimulus location in the rat whisker thalamus. Proc Acad Sci U S A, 108, 14956–14961 (2011). [DOI] [PMC free article] [PubMed] [Google Scholar]
- 33.Lee JH. Informing brain connectivity with optogenetic functional magnetic resonance imaging. Neuroimage, 62, 2244–2249 (2012). [DOI] [PubMed] [Google Scholar]
- 34.Miyamoto D and Murayama M The fibre-optic imaging and manipulation of neural activity during animal behavior. Neurosci Res, 103, 1–9 (2016). [DOI] [PubMed] [Google Scholar]
- 35.Palmer HS. Optogenetic fMRI sheds light on the neural basis of the BOLD signal. J Neurophysiol, 104, 1838–1840 (2010). [DOI] [PubMed] [Google Scholar]
- 36.Logothetis NK. The neural basis of the blood-oxygen-level-dependent functional magnetic resonance imaging signal. Philos Trans R Soc Lond B Biol Sci, 357, 1003–1037 (2002). [DOI] [PMC free article] [PubMed] [Google Scholar]
- 37.Buxton RB. The physis of functional magnetic resonance imaging (fMRI). Rep Prog Phys, 79, 096601 (2013). [DOI] [PMC free article] [PubMed] [Google Scholar]
- 38.Gao YR. et al. Time to wake up: Studying neurovascular coupling and brain-wide circuit function in the un-anesthetized animal. Neuroimage, 153, 382–398 (2017). [DOI] [PMC free article] [PubMed] [Google Scholar]
- 39.Daigle TL. et al. A suite of transgenic driver and reporter mouse lines with enhanced brain cell type targeting and functionality. Cell, 174, 465–480 (2018). [DOI] [PMC free article] [PubMed] [Google Scholar]
- 40.Madisen L et al. Transgenic mice for intersectional targeting of neural sensors and effectors with high specificity and performance. Neuron, 85, 942–958 (2015). [DOI] [PMC free article] [PubMed] [Google Scholar]
- 41.Zeng H et al. An inducible and reversible mouse genetic rescue system. PLoS Genet, 4, e1000069 (2008). [DOI] [PMC free article] [PubMed] [Google Scholar]
- 42.Harris JA. et al. Anatomical characterization of Cre driver mice for neural circuit mapping and manipulation. Front Neural Circuits, 8, 76 (2014). [DOI] [PMC free article] [PubMed] [Google Scholar]
- 43.Allen WE. et al. Global Representations of Goal-Directed Behavior in Distinct Cell Types of Mouse Neocortex. Neuron, 94, 891–907 (2017). [DOI] [PMC free article] [PubMed] [Google Scholar]
- 44.Valley MT. et al. Separation of hemodynamic signals from GCaMP fluorescence measured with widefield imaging. J Neurophysiol, 123, 256–366 (2020). [DOI] [PubMed] [Google Scholar]
- 45.Shen Q, Huang S and Duong TQ. Ultra-high\spatial resolution basal and evoked cerebral blood flow MRI of the rat brain. Brain Res, 1599, 126–136 (2014). [DOI] [PMC free article] [PubMed] [Google Scholar]
- 46.Wekselblatt JB. et al. Large-scale imaging of cortical dynamics during sensory perception and behavior. J Neurophysiol, 115, 2852–2866 (2016). [DOI] [PMC free article] [PubMed] [Google Scholar]
- 47.Cox RW. AFNI: software for analysis and visulization of functional magnetic resonance neuroimages. Comput Biomed Res, 29, 162–173 (1996). [DOI] [PubMed] [Google Scholar]
- 48.Tsurugizawa T, Djemai B and Zalesky A The impact of fasting on resting state brain networks in mice. Sci Rep, 9, 2976 (2019). [DOI] [PMC free article] [PubMed] [Google Scholar]
- 49.Pais-Roldán P et al. Identifying Respiration-Related Aliasing Artifacts in the Rodent Resting-State fMRI. Front Neurosci, 12, 788 (2018). [DOI] [PMC free article] [PubMed] [Google Scholar]
- 50.Li Q et al. Resting-state functional MRI reveals altered brain connectivity and its correlation with motor dysfunction in a mouse model of Huntington’s disease. Sci Rep, 7, 16742 (2017). [DOI] [PMC free article] [PubMed] [Google Scholar]
- 51.Lake EMR. et al. Modulation of the peri-infarct neurogliovascular function by delayed COX-1 inhibition. J Magn Reson Imaging, 46, 505–517 (2017). [DOI] [PubMed] [Google Scholar]
- 52.Ma Y et al. Resting-state hemodynamics are spatiotemporally coupled to synchronized and symmetric neural activity in excitatory neurons. Proc Natl Acad Sci USA, 113, E8463–E8471 (2016). [DOI] [PMC free article] [PubMed] [Google Scholar]
- 53.Barson D et al. Simultaneous mesoscopic and two-photon imaging of neuronal activity in cortical circuits. Nat Methods 17, 107–113 (2020). [DOI] [PMC free article] [PubMed] [Google Scholar]
- 54.Shen X et al. Groupwise whole-brain parcellation from resting-state fMRI data for network node identification. Neuroimage, 82, 403–415 (2013). [DOI] [PMC free article] [PubMed] [Google Scholar]
Associated Data
This section collects any data citations, data availability statements, or supplementary materials included in this article.
Supplementary Materials
Data Availability Statement
The raw MR and optical imaging data generated during the current study are available from the corresponding author upon reasonable request. Data are not available in a public repository at the time of this publication due to ongoing work by the authors on these data set. The Allen Brain Atlas was downloaded from http://www.brain-map.org.


