

Abstract
Background:
IgG4-related disease (IgG4-RD) is an immune-mediated fibrotic disorder that has been linked to CD4+ cytotoxic T lymphocytes (CD4+CTLs). The effector phenotype of CD4+CTLs, the relevance of both CD8+ cytotoxic T lymphocytes (CD8+CTLs) and of apoptotic cell death remain undefined in IgG4-RD.
Objective:
The goals of this study were to define CD4+CTL heterogeneity, characterize the CD8+CTL response in the blood and in lesions, and determine whether enhanced apoptosis may contribute to the pathogenesis of IgG4-RD.
Methods:
Blood analyses were undertaken using flow cytometry, cell sorting, transcriptomic analyses at the population and single cell levels and next generation sequencing for the TCR repertoire. Tissues were interrogated using multi-color immunofluorescence. Results were correlated with clinical data.
Results:
We establish that among circulating CD4+CTLs in IgG4-RD, CD27loCD28loCD57hi cells are the dominant effector subset, exhibit marked clonal-expansion and differentially express genes relevant to cytotoxicity, activation and enhanced metabolism. We also observed prominent infiltration of granzyme A-expressing CD8+CTLs in disease tissues and clonal-expansion in the blood of effector/memory CD8+ T cells with an activated and cytotoxic phenotype. Tissue studies revealed an abundance of cells undergoing apoptotic cell death disproportionately involving non-immune, non-endothelial cells of mesenchymal origin. Apoptotic cells showed significant upregulation of HLA-DR.
Conclusion:
CD4+CTLs and CD8+CTLs may induce apoptotic cell death in tissues of patients with IgG4-RD with preferential targeting of non-endothelial, non-immune cells of mesenchymal origin.
Clinical Implication:
T cell mediated apoptosis in disease lesions may contribute to the induction of fibrosis in IgG4-RD. Effector CD4+CTLs and CD8+CTLs correlate with disease severity in IgG4-RD.
Keywords: IgG4-RD, CD4+CTL, CD8+CTL, apoptosis, CD28lo, CD28(null)
Graphical Abstract

Capsule Summary:
The frequencies of circulating activated CD4+CTLs and CD8+CTLs correlate with disease severity in IgG4-RD and the infiltration of these cell into affected tissues may induce the apoptotic cell death of non-endothelial, non-immune cells of mesenchymal origin.
Introduction
IgG4-related disease (IgG4-RD) is an insidiously progressive condition associated with chronic antigen-driven immune activation resulting in fibrosis1,2. This disease affects many organ systems and is characterized by tumor-like inflammatory masses composed of T cells enmeshed in an expanded fibrotic stroma with activated B cells and antibody secreting cells that predominantly express IgG43,4. B cells are of clear pathogenic importance as evidenced by the efficacy of B cell depletion5 and may even play a direct pro-fibrotic role6. However, T cells dominate the cellular infiltrate of affected tissues7.
Most studies on the contribution of T cells to the pathogenesis of IgG4-RD have focused on the CD4+ T cell compartment and CD4+ cytotoxic T lymphocytes (CD4+CTLs) have been identified as the dominant tissue-infiltrating CD4+ T cell subset8–10. In IgG4-RD, CD4+CTLs are clonally-expanded in the blood, accumulate at lesional sites in high numbers, are functionally cytotoxic and secrete pro-fibrotic factors8,9. Moreover, CD4+CTLs have been shown to decline in numbers in response to B cell depletion therapy, an observation that may be explained by the potential for activated B cell subsets to present antigen to tissue infiltrating CD4+CTLs8,10. The heterogeneity of CD4+CTLs, including the identification of both effector and precursor subsets, has been reported in the context of prior dengue viral infection14 but has not yet been explored in IgG4-RD or any other chronic inflammatory disease. Similarly, CD4+ T cells that are phenotypically consistent with CD4+CTLs have been described in the setting of multiple other autoimmune diseases15–20 but how these cells compare to those observed in IgG4-RD is unknown. In contrast, the CD8+ T cell compartment has only been interrogated in a limited way in this disease23.
Apoptotic cell death has been invoked as a prelude to fibrosis in various conditions including idiopathic pulmonary fibrosis and systemic sclerosis21,22. We have recently identified CD4+CTLs and more specifically, endothelial cell apoptosis, as potential contributing factors to the pathogenesis of systemic sclerosis11. However, similar in situ evidence of cytotoxicity has not yet been explored in tissues affected by IgG4-RD. Here, using blood and tissue samples from patients with IgG4-RD, we have defined an effector subset of CD4+CTLs, explored the relevance of CD8+ T cells in this condition and performed studies that suggest that apoptotic cell death may be of mechanistic relevance in IgG4-RD.
Methods
Patient Cohorts:
IgG4-RD blood samples (n = 48) and age-matched healthy donors (n = 20) were obtained through the Massachusetts General Hospital Division of Rheumatology. IgG4-RD was defined by either the fulfillment of established histopathologic diagnostic criteria or ACR/EULAR IgG4-RD Classification Criteria3,4. established An IgG4-RD Responder Index greater than or equal to 1 was considered active disease421. Eight of these patients were on some form of immunosuppression while 41 were clinically-active at the time of blood collection. Severe disease was defined by the presence of active disease involving the lung, aorta, bile duct, pancreas, kidney or meninges whereas disease limited to the orbit, lacrimal glands, salivary glands, sinuses, or retroperitoneum were considered mild. Healthy donors were defined by lacking any current or history of malignancy, autoimmune disease or recurrent/chronic infections. Sarcoidosis subjects were recruited through the Massachusetts General Hospital Division of Pulmonary & Critical Care Medicine. Sarcoidosis patients were diagnosed as previously described42. Specifically, sarcoidosis patients were free of cross-sectional chest imaging and pulmonary function testing for each sarcoidosis subject was reviewed by a pulmonologist with expertise in fibrotic lung disease (SBM) and only those without evidence of lung fibrosis were used for these studies. Clinical and demographic data on all subjects used for these studies is displayed in Table S1. PBMCs were isolated by Ficoll density gradient centrifugation within 4 hours of phlebotomy and preserved in gas-phase liquid nitrogen until the time of use. Data such as sex, age, treatment status, disease activity, clinical manifestations and laboratory parameters were extracted from the medical records of all patients.
Submandibular glands from 21 patients with IgG4-RD, labial salivary glands from 15 patients with Sjogren’s syndrome, and submandibular glands from 10 patients with chronic sialadenitis were obtained from the Department of Oral and Maxillofacial Surgery of Kyushu University Hospital, Fukuoka, Japan. All of these patients had been evaluated between 2008 and 2018 at the Kyushu University Hospital. Sjogren’s syndrome was diagnosed as previously defined43. Chronic sialadenitis is a non-specific inflammatory disease of the salivary glands linked to sialolithiasis and was diagnosed on clinical grounds.
Flow cytometry:
Frozen PBMCs were thawed and washed in complete DMEM. Prior to antibody staining, Fc receptors were blocked using Human TruStain FcX (BioLegend, 422302) at a concentration of 1:20 on ice for 15 minutes. Cells were stained for 20 minutes on ice, protected from light, at a concentration of 20 million cells/mL using the following antibody panel (manufacturer, clone, concentration used): anti-human CD3-BUV395 (BD Biosciences, Clone SK7, 1:40), anti-human CD57-PE (BD Biosciences, Clone NK-1, 1:400), anti-human CD8-BV785 (BioLegend, Clone SK1, 1:300), anti-human CD45RA-BV605 (BioLegend, Clone HI100, 1:300), CD4-BUV805 (BD Biosciences, Clone SK3, 1:80), anti-human CD28-BV480 (BD Biosciences, Clone CD28.2, 1:40), anti-human CCR7-APC/Cy7 (BioLegend, Clone G043H7, 1:20), anti-human SLAMF7-A648 (BD Biosciences, Clone 235614, 1:10). Cells were washed with 1% BSA in PBS after staining, centrifuged and resuspended in 1% BSA in PBS. Just prior to flow cytometry, dead cells were stained with SYTOX AADvanced Dead Cell Stain (Thermo Fisher Scientific, S10274). The following antibodies were used for intracellular flow cytometry studies: anti-human GZMA-PE/Cy7 (BioLegend, Clone CB9, 1:10), anti-human GZMB-BV421 (BD Biosciences, Clone GB11, 1:25), anti-human GZMK-FITC (BioLegend, Clone GM26E7, 1:25), and anti-human PRF-BV711 (BioLegend, Clone dG9, 1:25). Anti-human CX3CR1-BV650 (BioLegend, Clone 2A9–1, 1:25 was also used for extracellular staining prior to intracellular staining. Cells were fixed and permeabilized using the fixation/permeabilization solution kit from BD Biosciences (catalog #554714) according to the manufacturer’s protocol. Flow cytometry was performed on a BD LSR II (BD Biosciences, San Jose, CA) and rainbow tracking beads were used to ensure consistent signals between flow cytometry batches. FCS files were analyzed using FlowJo software (version 10).
Multi-color immunofluorescence staining:
Tissue samples were fixed in formalin, embedded in paraffin, and sectioned. These specimens were incubated with antibodies: CD3 (clone: A045229–2; DAKO), CD4 (clone: CM153A; Biocare), CD19 (clone: CM310 A, B; Biocare), CD8 (clone: ab85792; Abcam), CD31 (clone: 3528; Cell Signaling Technology), CD68 (clone: ab955; Abcam), Cleaved caspase-3 (clone: 9664; Cell Signaling Technology), GZMA (clone: LS-C312742; LSBio), CD28 (clone: ab243228; Abcam), CD45RA (clone: 158–4D3; Novus Biologicals), vimentin (clone: 5741; Cell Signaling Technology), α-SMA (clone: 19245; Cell Signaling Technology), pan-CK (clone: ab27988; Abcam), AQP5(clone: ab92320; Abcam), HLA-DR (clone: ab20181; Abcam) and SLAMF7 (clone: HPA055945; Sigma Aldrich) followed by incubation with secondary antibody using an OpalTM Multiplex Kit (Perkin Elmer). The samples were mounted with ProLong™ Diamond Antifade mountant containing DAPI (Invitrogen).
Microscopy and Quantitative Image Analysis:
Images of the tissue specimens were acquired using the TissueFAXS platform (TissueGnostics). For quantitative analysis, the entire area of the tissue was acquired as digital grayscale images in five channels with filter settings for FITC, Cy3, Cy5 and AF75 in addition to DAPI. Cells of a given phenotype were identified and quantitated using the TissueQuest software (TissueGnostics), with cut-off values determined relative to the positive controls. For tissue staining, DAPI was used to define nucleated cells along with the following markers to define each respective cell type: T cells (CD3+), B cells (CD19+), macrophage (CD68+), endothelial cell (CD31+), acinar cell (AQP5+, PanCK+), ductal cell AQP5−, PanCK+), myoepithelial cell (vimentin+, α-SMA+), mesenchymal cell (vimentin+, α-SMA−, CD19−, CD3−), CD4+CTLs (CD4+, GZMA+), and CD8+CTLs (CD8+, GZMA+). In Figure 5E, to quantify the relative contributions of each cell type to overall apoptotic cell death, we excluded CD3+ T cells from the analysis due to the confounding influence of activation-induced cell death. This microscopy-based multicolor tissue cytometry software permits multicolor analysis of single cells within tissue sections similar to flow cytometry. The principle of the method and the algorithms used have been described in detail elsewhere44.
FACS-sorting, RNA Sequencing & TCR Repertoire Studies:
Frozen PBMC were thawed, washed and stained with the same antibody panel as used for flow cytometry experiments, above. Consistent with our flow cytometry studies, effector CD4+CTLs were sorted based on the following gates: CD3+ CD4+ CD8− CCR7− CD45RA− SLAMF7+ CD28lo CD57hi. CD4+ naïve T cells were sorted based on the following gates: CD3+ CD4+ CD8− CCR7+ CD45RA+. Cells were sorted directly into 350 uL RLT-BME lysis buffer, vortexed briefly and immediately frozen on dry ice. Cells were sorted on a FACSAria II with FACSDiva version 7. RNA was isolated from sorted cell lysates using RNeasy Plus Micro Kits (Qiagen, 74034). For bulk RNA sequencing, isolated RNA was immediately processed through RT-PCR, as previously described45. For single cell RNA sequencing, cells were FACS-sorted into lysis buffer of a 96-well plate format and processed as previously described46. For bulk RNA sequencing analysis of effector/memory CD8+ T cells, a technical replicate from one IgG4-RD subject was available and included in the analysis. For TCR repertoire, isolated RNA was immediately processed through 5’RACE RT-PCR, as previously described47. For gene-specific amplification of the TCRβ gene, the following reverse primer was used: 5’ TGCTTCTGATGGCTCAAACACAGCGACCT 3’
Statistical Analysis:
GraphPad Prism version 8 was used for statistical analysis, curve fitting and linear regression. A two-tailed Mann-Whitney U test was used to calculate p-values for continuous, non-parametric variables. For categorical variables, Fisher exact test was used to calculate p-values. For comparing more than one population, Kruskal-Wallis testing was used with Dunn’s multiple comparison testing. Pearson’s correlation coefficient was used to quantify the strength of linear relationship between variables. A p-value of < 0.05 was considered significant.
Bulk RNA-sequencing.
Raw FASTA files (read 1 and read 2) were processed with the zUMIs v2.2 pipeline using the splice-aware aligner STAR v2.5.4a, SAMtools v1.9 and pigz v2.3.4(61). In short, reads were filtered according to a predefined list matching the custom-made well barcodes in the oligo-dTs and unique molecular identifiers were then collapsed. The remaining reads were mapped to the reference genome with use of the STAR aligner. Exon counts from mapped reads were imported into R studio v1.1.456 and further processed for statistical analysis with DESeq2 v1.22.1. Since we compare multiple cellular subtypes per patient, we controlled for between patient variability in the design matrix. Fitting of the models’ dispersion to the mean intensity was performed with local regression and the effect sizes were calculated with the post-counts estimator in DESeq. Dispersion plot fits were visually validated for goodness-of-fit. We performed pairwise comparison between cell subtypes of interest and the per-gene p-values were adjusted for multiple testing by Benjamini Hochberg (BH) false discovery rate (FDR). Gene-set enrichment analysis was done with the GSEABase package v1.44.0 (fgsea algorithm) with 10.000 permutations, gene-set size between 5–2000 and a BH-FDR adjusted p-value cut-off of 0.25. Gene-set lists were downloaded from the MSigDB v6.2 at the Broad Institute of MIT & Harvard and included gene sets from the GO, KEGG, BioCarta, Reactome and Hallmark databases. Custom gene-sets were created by extraction of the cell-type specific gene expression signatures from Stanford’s CIBERSORT tool and previous studies describing gene expression signatures on CD4+CTLs8,14,48.
T-cell receptor repertoire analysis.
Processed files were imported in VDJtools v1.1.4 for statistical analysis. Basic V-J usage per cell-type was analyzed by computing read frequencies. Clonotype abundances were calculated by CDR3 nucleotide, V and J matching among CD4+ CTLs.
Study Approval:
These studies were approved by the Institutional Review Boards at the Massachusetts General Hospital, University of Michigan Medical Center, Hospital of the University of Pennsylvania, and Kyushu University Hospital. All patients provided written informed consent prior to inclusion in the study.
Results
An effector subset of CD4+ cytotoxic T lymphocytes is characterized by the loss of surface CD28 and a gain of CD57 expression
Previously, we identified SLAMF7 as a surface marker capable of distinguishing CD4+CTLs8. These earlier studies relied on the loss of CD27 in defining effector/memory CD4+ T cells. However, downregulation of CD27 and the generation of CD4+CTLs are both linked with chronic antigen exposure and therefore, the CD27lo CD4+ T cell compartment may be biased towards higher CD4+CTL numbers relative to other CD4+ T cell subsets that are more acutely induced. We explored the heterogeneity of CD4+CTLs by flow cytometry and first, isolated the downstream effect of CD27 downregulation by comparing alternative gating strategies to define effector/memory T cells. In fact, we observed more than a 2-fold enrichment of CD4+SLAMF7+ T cells by pre-gating on CD27lo CD4+ TEM cells (Figure S1). Thereafter relying on the dual loss of CCR7 and CD45RA to define CD4+ TEM cells, we examined CD4+SLAMF7+ TEM cells by flow cytometric tSNE analysis and identified three subsets with clustering determined by the gain or loss of CD28 and/or CD57 (Figure 1A). Within these subsets, the expression or downregulation of CD27 correlated with the expression pattern of CD28. The corresponding flow cytometry plot of CD4+SLAMF7+ TEM cell subsets is presented in Figure 1B. Among these subsets, the CD28loCD57hi cells demonstrated the greatest enrichment for cytotoxic proteins including granzyme A (GZMA), granzyme B (GZMB) and perforin (PRF), as well as markers associated with an CD4+CTL effector phenotype including CX3CR1+ and CD127lo14,24. CD28loCD57hi CD4+SLAMF7+ TEM cells shared a phenotype most analogous to bone fide CD8+ cytotoxic effector T cells (Figure 1C). Many of the markers studied showed a gradation of expression across CD4+SLAMF7+ TEM cell subsets suggesting a continuum of differentiation states ranging from CD28hiCD57lo ‘precursor’ cells, to CD28loCD57lo ‘intermediate’ cells, to CD28loCD57hi ‘effector’ cells (Figure 1D, S2). Molecular characterization of CD4+SLAMF7+ TEM cells by single cell RNA sequencing and Monocle analysis was consistent with this developmental trajectory (Figure 1D).
Figure 1. CD27lo CD28lo CD57hi defines an effector subset of CD4+CTLs.

A) tSNE analysis reveals heterogeneity within the CD4+ CCR7lo CD45RAlo SLAMF7+ population from the blood of a representative IgG4-RD patient. B) Representative flow contour plot displaying distinct subsets of SLAMF7+ CD4+ TEM cells in the blood of a representative IgG4-RD patient. C) Intracellular flow cytometry for granzyme A (GZMA) and perforin (PRF) showing the greatest frequency of cytotoxic protein expression among CD28loCD57hi CD4+SLAMF7+ T cells compared to other subsets. CCR7− CD45RA+ CD28loCD57hi CD8+ SLAMF7+ T cells were used to represent CD8+CTLs. Displayed are medians (bars) and inter-quartile range (error bars). D) Monocle analysis of single cell sequencing data of SLAMF7+ CD4+ TEM cell subsets suggesting a differentiation trajectory.
By TCR sequencing, we observed clonal connectivity between CD4+SLAMF7+ TEM cell subsets with the greatest overlap between effector and intermediate cells (Figure 2A). Striking clonal expansion was also observed such that the top 10 clones consumed the vast majority of TCR sequence reads among these subsets (Figure 2B). The degree of clonal expansion among precursor CD4+SLAMF7+ TEM cells was contingent on how connected the repertoire was to those of the intermediate and effector subsets (Figures 2A–B, S3).
Figure 2. CD28lo CD57hi CD4+CTLs are clonally-expanded in IgG4-RD and correlate with a more severe clinical phenotype.

A) Stacked bar chart displays the frequency of the top 10 clones within each CD4+CTL subset. CD28lo subsets show marked clonal expansion with the top clones dominating the repertoire. B) Venn diagram showing % overlap of top 10 clones from each CD4+SLAMF7+ T cell subset with the greatest overlap observed between the CD28lo subsets. C) Dot plot of flow cytometry data displaying significant accumulation of CD28loCD57hi CD4+ SLAMF7+ T cells in the blood of IgG4-RD patients (n=48) compared to non-fibrotic sarcoidosis (n=19) and age-matched healthy donors (n=20). Bars represent medians and inter-quartile ranges. p-values calculated by ANOVA with Kruskal-Wallis test to control for multiple comparisons. D) Forrest plot displaying the odds of observing an expanded CD28loCD57hi SLAMF7+ CD4+ TEM cell population in the blood based on clinical parameters of disease severity. p-values calculated by logistic regression and are unadjusted for multiple comparisons.
In contrast to healthy donors, in whom the precursor subset consistently dominated, the CD4+SLAMF7+ TEM compartment from patients with IgG4-RD was predominantly of the effector or intermediate phenotype (Figures 2C, S4A). Although the intermediate phenotype among CD4+SLAMF7+ TEM cells was expanded in some IgG4RD patients and rarely present in significant numbers in controls, it constituted only 10–15% of all CD4+SLAMF7+ TEM cells (Figure S4B). The gating strategy utilized for these studies is presented in Figure S5. In addition to the prominent clonal-expansion and accumulation of effector CD4+SLAMF7+ TEM cells, this subset correlated with multiple clinical parameters reflective of disease severity in IgG4-RD (Figure 2D). In contrast, the more limited clinical phenotype confined to the glandular tissues of the head and neck was inversely associated with effector CD4+CTL expansion. Additional immunophenotyping revealed that large proportions of effector CD4+CTLs co-express the adhesion molecule GPR56, the activation markers HLA-DR and PD-1, and the chemokine receptor CXCR3, as described among CD4+CTLs in the contexts of anti-viral responses, systemic lupus erythematosus and rheumatoid arthritis (Figure S6)15,25,26.
Taken together, these data define CD4+ TEM cells that have gained surface expression of SLAMF7 and CD57 but lost the co-stimulatory molecules CD27 and CD28 as a circulating effector subset of CD4+CTLs of potential pathogenic relevance in the setting of chronic inflammation.
Effector CD4+CTLs demonstrate a gene signature of activation and accumulate in lesional tissues
We isolated circulating effector CD4+CTLs from patients with IgG4-RD and performed RNA sequencing. Compared with naive CD4+ T cells from the same subjects, we identified 7,392 differentially expressed transcripts with over half being upregulated by CD4+CTLs (Figure 3A). Mapping of potential protein-protein interactions yielded a highly interactive network greatly enriched by genes related to cytotoxicity (FDR 2.09 ×10⁻¹¹), cell activation (FDR 3.08 ×10⁻⁷), and cell migration (FDR 0.0102) (Figure 3B). Genes relevant to each biologic process include GZMA, GZMB, GZMM, GNLY, PRF1, CX3CR1 and NKG7 related to cytotoxicity, CD40LG, DOCK2, SLAMF7, and PIK3R5 related to lymphocyte activation, and ITGAL, ITGAM, NFATC2, GPR56, and TGFBR3 related to cell-matrix interactions. By gene-set enrichment analysis, we additionally observed upregulation of collections of cytokines (CCL4, CCL5, IL1B, IFNG), cytokine receptors (PTGDR, IL18R1) and chemokine receptors (CCR5, CXCR6) that may be relevant to the role of effector CD4+CTLs in orchestrating a chronic inflammatory immune response and in homing to inflamed tissues (Figure 3C). Moreover, the transcriptome of effector CD4+CTLs was enriched for gene sets related to increased cellular metabolism including those of oxidative phosphorylation, fatty acid metabolism, mTORC1 signaling, and cholesterol homeostasis (Figure S7).
Figure 3. CD28lo CD57hi CD4+CTLs display gene signatures of cytotoxicity, activation and tissue migration.

A) Heat map displaying 7,392 differentially expressed transcripts between CD28loCD57hi SLAMF7+ CD4+ TEM cells and CD4+ naïve T cells. B) STRING analysis representing predicted protein-protein interactions among upregulated genes by CD28lo CD57hi SLAMF7+ CD4+ TEM cells. Number of lines connecting each node represent degree of evidence for interaction. C) CNET plot showing genes enriched for by CD28lo CD57hi SLAMF7+ CD4+ TEM cells among gene sets associated with various T cell subsets. (D) Representative multi-color immunofluorescence image of CD4+ (red) GZMA+ (green) CD28low (purple) T cells in an IgG4-RD lesion. (E) Relative proportions of CD28high and low CD4+CTLs in submandibular lesions of individual IgG4-RD patients (n = 6).
We previously demonstrated the marked accumulation of CD4+CTLs within IgG4-RD lesions8. To examine the activation state of tissue-infiltrating CD4+CTLs, we quantified the relative contribution of CD28lo and CD28hi CD4+CTLs in lesional tissues (Figure 3D). CD4+CTLs of both differentiation states were identified within tissues with an overall comparable contribution (Figure 3E).
CD8+CTLs accumulate in tissues affected by IgG4-RD in comparable numbers to CD4+CTLs
While multiple reports have linked CD4+CTLs to human IgG4-RD, HLA class I restricted CD8+ CTL responses have also been suggested to have a pathogenic role in what has been described as a mouse model of this disease, though the disease process in this model affects pancreatic islets and more closely mimics existing models of type I diabetes (Sasaki, 2019). We explored the possibility that activated CD8+CTLs may contribute to the CD4+CTL dominated T cell infiltrate that we previously described in IgG4-RD. In quantitative analyses, we observed CD4+ T cells in greater numbers than CD8+ T cells in lesions, but both cell types infiltrated affected tissues in high numbers with approximately 2,000 CD4+ and 1,500 CD8+ T cells being identified per mm2, on average (Figure 4A–B). However, using granzyme-A as a surrogate marker of cytotoxic capacity, we observed similar absolute numbers of CD4+CTLs and CD8+CTLs infiltrating tissues affected by IgG4-RD (Figure 4C). Exploring the tissue-infiltrating CD8+CTLs further, we found that the vast majority had an activated phenotype with the loss of surface expression of the co-stimulatory receptor, CD28 (Figure 4D–E).
Figure 4. Effector CD8+CTLs accumulate in the tissues and blood of patients with IgG4-RD.

(A) Immunofluorescence image showing CD4 (red), CD8 (green) and GZMA (purple) staining in an IgG4-RD lesion. Red arrows indicate CD4+ GZMA+ T cell. Green arrows indicate CD8+ GZMA+ T cell. (B) Absolute number of CD4+ T cell and CD8+ T cell in tissues affected by IgG4-RD (n = 21). (C) Absolute number of CD4+CTLs and CD8+CTLs in tissues affected by IgG4-RD (n = 13). (D) Representative multi-color immunofluorescence image of CD8 (red), CD28 (purple) and GZMA (green) in an IgG4-RD lesion. White arrows indicate CD8+ GZMA+ CD28low T cells. (E) Relative proportions of CD28hi and CD28lo CD8+ GZMA+ T cells in tissues affected by IgG4-RD (n = 6). (F) Dot plot of flow cytometry data displaying significant accumulation of CD28loCD57hi CD8+ effector-memory T cells in the blood of IgG4-RD patients (n=48) compared to age-matched healthy donors (n=20). Bars represent medians and inter-quartile ranges. p-values calculated by ANOVA with Kruskal-Wallis test to control for multiple comparisons. (G) Dot plot of flow cytometry data showing that the majority of CD28lo CD57hi CD8+ effector-memory T cells in the blood of patients with IgG4-RD accumulate in the TEMRA, which is more pronounced in those with more severe disease. Bars represent medians and inter-quartile ranges. p-values calculated by Mann-Whitney U test. (H) Stacked bar chart showing that the majority of CD28lo CD8+ T cells infiltrating IgG4-RD tissues have lost CD45RA expression, in contrast to their circulating counterparts presented in 6G. (I) Scatter plot displaying the positive correlation between CD28loCD57hi CD8+ T cells and CD28loCD57hi CD4+CTLs in the blood of IgG4-RD patients. p-value calculated by linear regression.
A subset of CD8+CTLs is activated, clonally expanded and utilizes unique TCR Vβ genes in IgG4-RD.
We studied circulating CD8+ T cell subsets from patients with IgG4-RD. An established phenotype of highly antigen-exposed CD8+ T cells includes features of heightened cytotoxic capacity, the loss of CD28 expression and the gain of CD57 expression30,31. Consistent with a highly cytotoxic phenotype, the vast majority of CD28loCD57hi CD8+ T cells in the blood of IgG4-RD patients expressed GZMA and PRF (Figure 1C) and to a lesser extent, GZMB (Figure S2). We observed a marked expansion of CD28loCD57hi CD8+CTLs in patients with more severe IgG4-RD compared to patients with a mild clinical phenotype or age-matched healthy donors suggesting that these cells might be of pathogenic relevance (Figure 4F). Additionally, we found a proportional decline in CD8+ naïve T cells and increased CD8+ TEMRA cells in the blood of IgG4-RD patients with a more severe clinical phenotype (Figure S8A–C).
Terminally-differentiated CD8+CTLs, defined as TEM cells that have regained surface expression of CD45RA (TEMRA), are reported to have enhanced cytotoxic capacity with increased perforin expression32. Among the CD28loCD57hi CD8+CTLs observed in the blood of patients with IgG4-RD, the majority of these cells were of the TEMRA phenotype and this skewing was more pronounced in those with severe disease involvement (Figure 4G). The gain of CD45RA expression by CD8+ TEM cells has been reported to be a reversible process with the ability of CD8+ TEMRA cells to downregulate CD45RA expression following repeat antigen exposure33. Consistent with this possibility, we found that most infiltrating CD28lo CD8+ T cells did not express CD45RA (Figures 4H and S9). In addition to tracking with disease severity, we found that circulating CD28loCD57hi CD8+CTLs correlate strongly with circulating effector CD4+CTLs and serum IgG4 levels, two other surrogate markers related to disease severity (Figures 4I and S10).
To molecularly characterize CD8+ T cell subsets in the context of IgG4-RD, we purified CD8+ naïve T cells, CD28loCD57hi CD8+ TEM and CD28loCD57hi CD8+ TEMRA cells from the blood of patients with active IgG4-RD and age-matched healthy donors. In contrast to the widely diverse TCR repertoire among CD8+ naïve T cells, we found that both the TEMRA and TEM CD28loCD57hi CD8+ T cells were highly clonally expanded (in IgG4-RD and healthy subjects alike) often with 1 or 2 clones dominating the TCR repertoire (Figure S11). The TCRβ gene usage was highly consistent between the CD8+ TEM and TEMRA compartments within each individual subject and the dominant clones were identical based on CDR3 sequence between these compartments (Figure S11). The latter observation is consistent with the reversible gain and loss of CD45RA expression and dynamic exchange between the circulating CD8+ TEM and TEMRA compartments. We also observed overlapping TCR Vβ gene usage across different patients with IgG4-RD consisting of Vβ genes that were notably underrepresented among healthy donors, suggesting unique HLA class I-antigenic peptide recognition by CD8+ T cells in IgG4-RD that is shared across diseased individuals (Figure S11).
Finally, we performed RNA sequencing on the same purified CD8+T cell subsets. We compared the transcriptional profiles from both TEMRA and TEM CD28loCD57hi CD8+ T cells from the blood of five IgG4-RD patients to those from four age-matched healthy donors. As expected, we observed a distinct gene signature of cytotoxicity among CD28loCD57hi CD8+ TEMRA cells (Figure 5A). The cytotoxic transcriptional profile was similar to that observed within effector CD4+CTLs with upregulation of genes such as GZMA, GZMB, GZMH, GNLY, PRF1, and NKG7. A heatmap and comprehensive list of differentially expressed genes between CD8+ TEMRA and CD8+ naïve T cells are provided in Figures S12 and S13. An enhanced cytotoxicity profile among CD28loCD57hi CD8+ TEMRA cells was confirmed at the protein level by intracellular flow cytometry. These studies showed a high frequency of GZMA expression among all CD8+ TEMRA subsets, in contrast to the low frequency among naïve CD8+ T cells, as well as a gradation of both PRF and GZMB expression with the greatest frequency being among CD28loCD57hi CD8+ TEMRA cells (Figures 5B). These data parallel the findings of cytotoxicity presented above regarding CD4+CTL subsets.
Figure 5. CD28lo CD57hi CD8+ T cells display gene signatures of cytotoxicity, activation and metabolism.
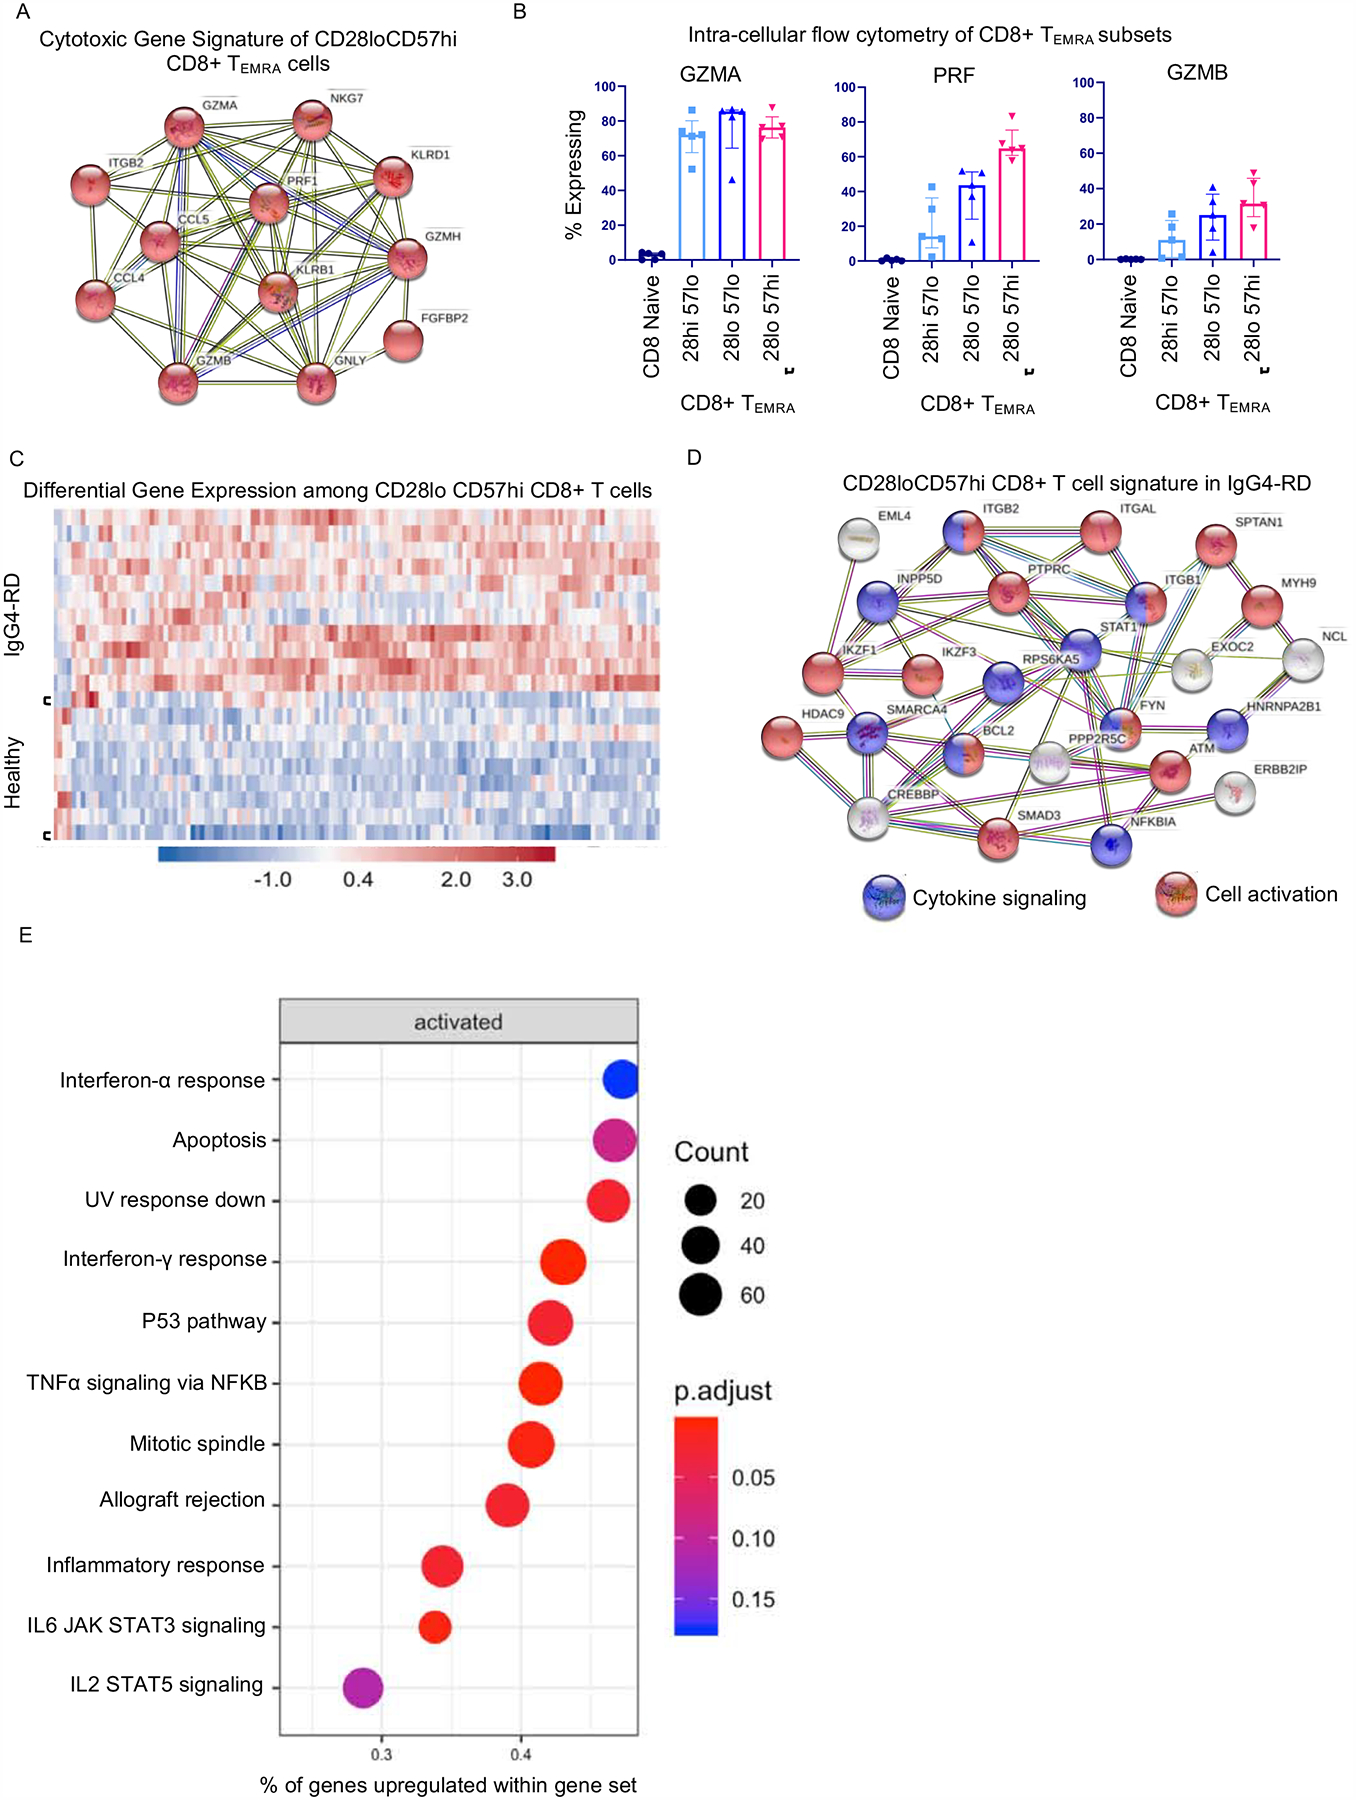
A) STRING analysis representing predicted protein-protein interactions among upregulated genes by CD28loCD57hi CD8+ T cells shows a cytotoxic gene signature. Number of lines connecting each node represent degree of evidence for interaction. B) Intracellular flow cytometry for granzyme A (GZMA), perforin (PRF) and granzyme B (GZMB) showing the greatest frequency of cytotoxic protein expression among CD28loCD57hi CD8+ TEMRA cells compared to other CD8+ TEMRA subsets. Displayed are medians (bars) and inter-quartile range (error bars). C) Heatmap displaying 132 genes differentially expressed among CD28loCD57hi CD8+ T cells from IgG4-RD subjects compared to those from healthy donors. D) STRING analysis representing predicted protein-protein interactions among upregulated genes by CD28loCD57hi CD8+ T cells from IgG4-RD subjects compared to healthy donors showing signatures of cytokine signaling and activation. E) Dot plot displaying gene set enrichment among CD28loCD57hi CD8+ T cells from IgG4-RD subjects compared to those from healthy donors.
By comparing the transcriptome of CD28loCD57hi CD8+CTLs from patients with IgG4-RD to those from healthy donors, we identified 132 differentially expressed genes, the vast majority being upregulated (Figure 5C). A full list of differentially expressed genes is available in Figure S14. By mapping potential protein-protein interactions, we observed gene networks relevant to lymphocyte activation (FDR = 4.35 ×10⁻⁵) and cellular response to cytokine signaling (FDR = 0.0216) (Figure 5D) among cells from IgG4-RD patients. Upregulated genes relevant to T cell activation included FYN, PTPRC, IKZF3, IKZF1, HDAC9, ITGB1, ITGB2, and ITGAL, whereas those related to cytokine signaling included STAT1, SMAD3, NFKBIA, ITGB1, and ITGB2. Relevant to cell survival, we found upregulation of the IKZF3 and BCL2 genes, both with important roles in suppressing apoptosis. Consistent with the predicted protein-protein interactions, gene-set enrichment analysis showed enrichment for gene sets related to cellular responses to cytokines (interferon-α, interferon-γ. TNF-α, IL-6/JAK/STAT3) and cell survival (apoptosis, p53 pathway, mitotic spindle, IL-2/STAT5) (Figure 5E).
Apoptotic cells accumulate in tissues affected by IgG4-RD
Because cell death mediated by cytotoxic T cells has been implicated in the pathogenesis of IgG4-RD (Sasaki, 2019) and since we had observed the accumulation of both activated, effector CD4+CTLs and CD8+CTLs in the tissues affected by this disease, we co-stained tissue sections to determine the frequency of cellular apoptosis. Despite the efficiency with which macrophages clear apoptosing cells from inflamed tissues27, we observed a profoundly increased frequency of apoptotic cells in the tissues of patients with IgG4-RD, representing as much as 2% of all nucleated cells (Figures 6A–C). This frequency was significantly greater than that observed in non-inflammatory controls as well as in salivary glands affected by Sjogren’s syndrome, a disease already linked to heightened apoptosis28. Consistent with a role for HLA class II restricted CD4+CTL-mediated apoptosis, we observed the preferential upregulation of HLA-DR in cells undergoing apoptosis (Figures 6F–G, S15A). Through a series of multicolor immunofluorescence studies, we determined that CD3+ T cells and vimentin+ cells of mesenchymal origin account for the majority of cells undergoing apoptosis (Figures 7, S15, S16). Given the clonal expansion and infiltration of effector T cells in these tissues, we expected to observe some activation induced cell death of T cells. In stark contrast to our previous studies in systemic sclerosis, in which CD31+ endothelial cells were the dominant target of apoptotic cell death11, and published reports on Sjogren’s syndrome, in which the preferential apoptosis of epithelial cells has been reported29, both of these specific cell types infrequently underwent apoptosis in tissues affected by IgG4-RD (Figures 7, S16). In order to ask which cells in tissues undergo apoptotic death, we excluded apoptotic T cells from our analyses and thereby noted the preferential apoptosis of non-immune, non-endothelial, vimentin+ cells of mesenchymal origin in IgG4-RD tissues (Figure 7E).
Figure 6. CD4+CTLs and apoptotic cells expressing HLA-DR are abundant in tissues from IgG4-RD patients.

(A) Representative multi-color immunofluorescence images showing cleaved caspase-3 (cCasp-3) staining (green) in IgG4-RD, Sjögren’s syndrome (SjS) and chronic sialadenitis (CS). (B and C) Absolute numbers (B) and proportions (C) of cCasp-3 positive apoptotic cells in IgG4-RD (n = 15), SjS (n = 15) and CS (n = 10). (D) Representative multi-color immunofluorescence image of HLA-DR+ (red) cCasp-3+ (green) cells in an IgG4-RD lesion. (E) Percentages of HLA-DR+ cells in cCasp-3+/− cells in IgG4-RD (n = 5). Mann-Whitney U test used to calculate p-value. Multiple comparisons controlled for by Kruskal-Wallis test. Error bars represent mean±SEM. *p < 0.05; ***p < 0.001; ****p < 0.0001.
Figure 7. CD3+ T cells and vimentin+ cells account for a large proportion of apoptotic cells in tissues from IgG4-RD patients.

(A) Representative multi-color immunofluorescence image of CD3 (red), CD19 (orange), CD68 (purple) and cCasp-3+ (green) staining in an IgG4-RD lesion. White arrows indicate a CD3+ cCasp-3+ cell. (B) Proportions of apoptotic cells in IgG4-RD (n = 5) accounted for by T cells (red), B cells (green), Macrophages (blue) and other cells (gray). (C) Representative multi-color immunofluorescence images showing vimentin (red), α-SMA (yellow) and cCasp-3 (green) staining in an IgG4-RD lesion. White arrows indicate a vimentin+ cCasp-3+ cell. (D) Proportions of apoptotic cells in IgG4-RD (n = 5) accounted for by mesenchymal cells (red)(vimentin+, α-SMA+/−), myoepithelial cells (green)(vimentin−, α-SMA+) and other cells (gray)(vimentin−, α-SMA−). (E) Relative proportions of each apoptotic cell type in each IgG4-RD patient (n = 5) are depicted.
Discussion
The studies described here, taken in conjunction with our recent studies on another fibrotic disease, systemic sclerosis11, suggest a unifying model that may mechanistically unify clinically distinct autoimmune fibrotic disorders. Recurrent apoptotic death of specific disease-specific cell types, following the recognition of yet to be identified self-peptides by auto-reactive CD4+CTL and CD8+CTL clones, may contribute to cell loss followed by an overly exuberant tissue remodeling process ending in fibrosis and organ dysfunction (Figure 8).
Figure 8. Schematic overview of proposed disease mechanism of IgG4-RD.
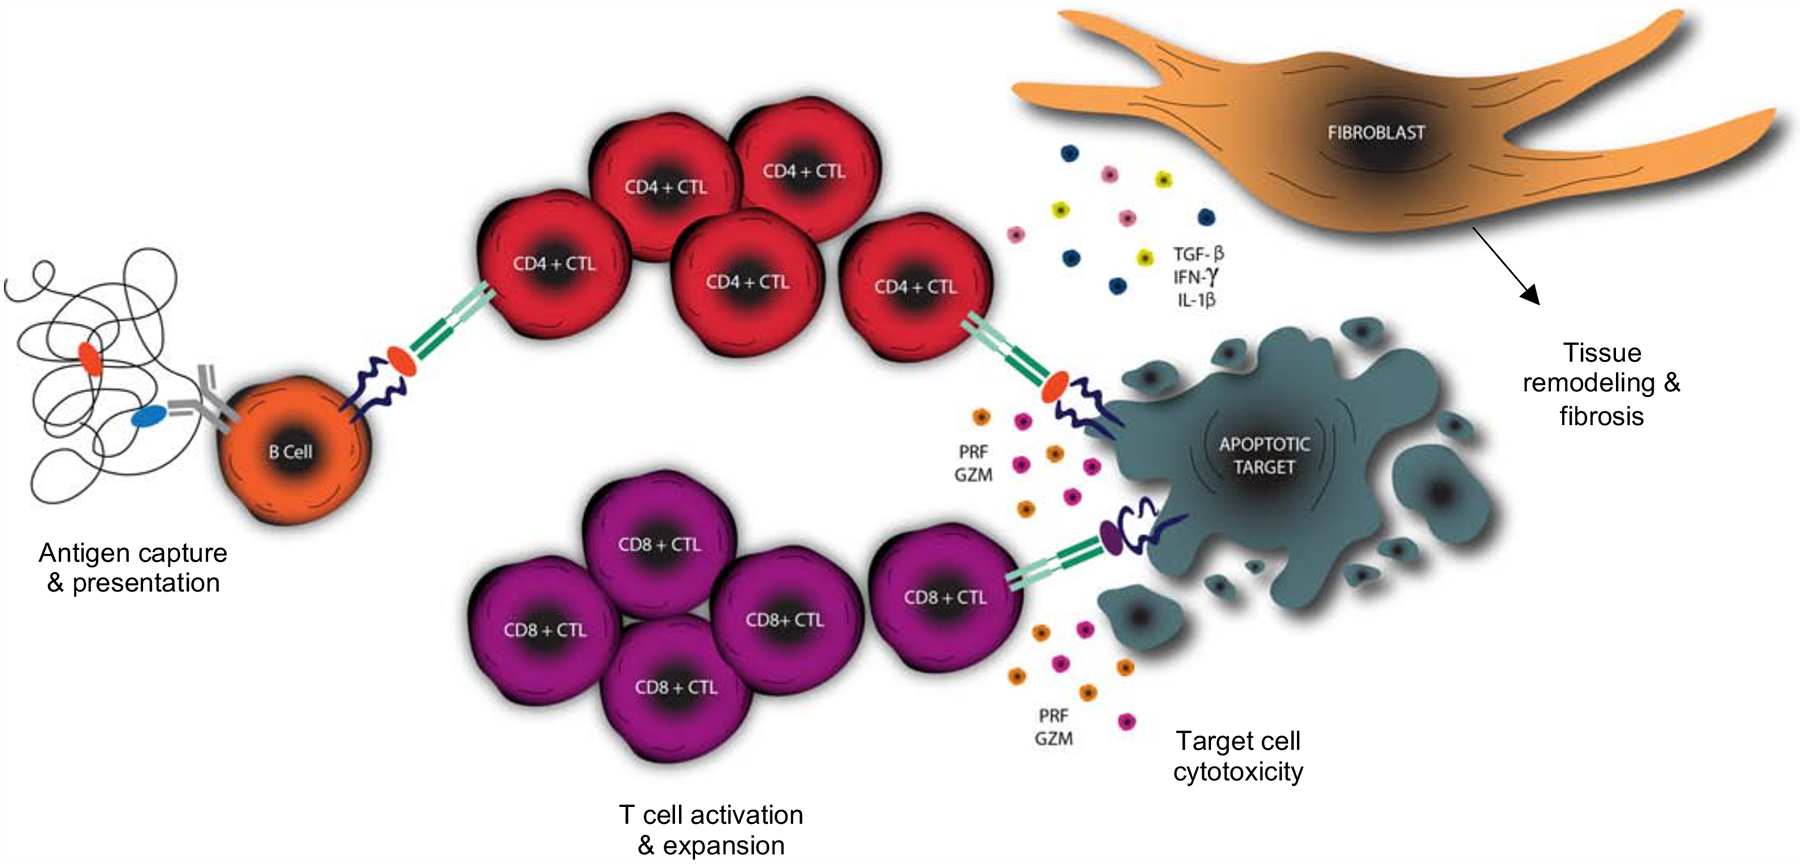
Activated B cells efficiently capture antigen and present peptide to CD4+ T cells driving differentiation into a CD4+CTL phenotype, activation and clonal proliferation. Target cells upregulate HLA class II (in the appropriate inflammatory milieu) and act as antigen presenting cells to expanded CD4+CTLs resulting in apoptotic cell death. Loss of antigen sequestration by apoptosing cells results in the cross-presentation by dendritic cells in the draining lymph node driving the activation and expansion of CD8+CTLs. CD8+CTLs travel to the site of inflammation and contribute to the cell death of apoptotic targets. Fibroblasts are activated by the secretion of pro-fibrotic molecules by CD4+CTLs resulting in the production of extra-cellular matrix proteins to “fill the space” created by target cell apoptosis.
In this report, in-depth immunophenotyping studies were used to define distinct subsets of CD4+CTLs in patients with IgG4-RD. Specifically, we have defined CD4+CTL sub-populations that are marked by the progressive loss of the surface co-stimulatory molecules CD27 and CD28, paired with the gain of expression of the glycoprotein CD57. We have demonstrated that the CD27loCD28loCD57hi SLAMF7+ CD4+ T cell phenotype is highly enriched with features of cytotoxicity, and that this cell population has undergone marked clonal proliferation. This same CD4+CTL subset expresses high levels of the chemokine receptor CX3CR1, consistent with previous reports in the context of the immune response to dengue virus24. The transcriptome of these CD28loCD57hi effector CD4+CTLs suggests an activated phenotype with properties of tissue homing, orchestration of immune cell recruitment, TCR mediated activation, and metabolic activity. Moreover, the clinical determinants of disease severity correlated with the degree of expansion of circulating effector CD4+CTLs, suggesting their pathogenic role in the induction and/or progression of IgG4-RD. Although we have quantified the direct tissue infiltration of CD4+CTLs within IgG4-RD lesions, the auto-reactive nature of these cells and their contributions to pathogenesis have not yet been directly proven. In contrast to the pathogenic role of B cells in IgG4-RD, which has been indirectly supported by their targeting of self-antigens37 and more directly by the ameliorative effects of B cell depletion with rituximab5, therapies specifically targeting T cells, or more precisely, CD4+CTLs, have not been examined in this disease.
We have extended our previous finding that CD4+CTLs dominate the tissue infiltrate in this disease by demonstrating that cytotoxic T cells in general are by far the most abundant T cell type infiltrating tissues affected by IgG4-RD, and that CD4+CTLs and CD8+CTLs contribute equally to the infiltrate. . We have demonstrated abundant GZMA+ CD8+CTLs within lesional tissues with numbers that approximate those of infiltrating CD4+CTLs and show that most tissue-infiltrating CD8+CTLs have an activated phenotype. In the circulation, we describe a massive accumulation of CD28loCD57hi CD8+ T cells in IgG4-RD, the majority of which express cytotoxic markers and correlate tightly with disease severity and circulating effector CD4+CTLs.
We also present the first evidence that enhanced apoptotic death, possibly driven by CD4+CTLs and CD8+CTLs, may be involved in the pathogenesis of IgG4-RD. While apoptosis has been reported in the settings of systemic sclerosis and Sjogren’s syndrome11,28,38, no such association has been previously documented in IgG4-RD. Our quantitative finding of increased numbers of apoptotic cells within lesional tissues of IgG4-RD is novel, and we additionally identify expression of HLA-DR on apoptotic cells suggesting the possibility of class II restricted immune-mediated apoptosis in this disease. We also provide detailed tissue phenotyping to ascertain the origin of cells undergoing apoptosis. Excluding apoptotic T cells discussed below, non-endothelial, non-immune vimentin+ mesenchymal cells were the tissue cells most frequently undergoing apoptotic death. However, the final cellular identity of many apoptotic cells in IgG4-RD remain to be determined. We identified very few apoptotic cells of endothelial origin in this disease, in stark contrast to our recent demonstration of predominant endothelial cell apoptosis in the context of systemic sclerosis11. The latter finding is potentially connected to the prominent vasculopathy observed in the clinical features of systemic sclerosis, which are notably lacking in the clinical manifestations of IgG4-RD. The differences in cellular apoptosis between these two diseases suggests that breaks in immunological tolerance to distinct self-antigens with differential expression across certain human cell types, presented by disease-specific HLA risk alleles, could in part explain the clinically distinct phenotypes of these two autoimmune fibrotic diseases.
Effector T cells go through the process of homeostatic contract by undergoing activation induced cell death. Given the prominently activated phenotype of CD4+ and CD8+ T cells found in the blood and tissues of IgG4-RD, we consider it likely that much or all of the observed T cell apoptosis is related to activation-induced cell death, which in some activated CD4+ T cells is mediated by interactions between and Fas ligand and Fas/CD9539. Fas ligand was one of the upregulated transcripts in effector CD4+CTLs (Figure 3C). Alternatively, it is possible that some T cells present peptides on MHC class I molecules to auto-reactive CD8+CTLs and represent targets of cytotoxic cell death in this disease. Since activated T cells upregulate HLA class II molecules, it is formally possible that activated T cells may present endogenous peptides derived from lysosomal degradation on HLA class II molecules to CD4+CTLs. It is however very likely that most of the apoptotic CD3+ T cells seen in IgG4-RD tissues represent cells undergoing activation-induced cell death.
Precisely how CD4+CTLs and CD8+CTLs are linked in the pathogenesis of IgG4-RD warrants further study. The presumed self-antigens that trigger both CD4+ and CD8+ T cell clonal expansions in this disease remain to be identified. Although we observed a correlation between the circulating numbers of effector CD4+CTLs and CD8+CTLs, we envision a sequential process of immune responses initiated by distinct self-antigens normally located in different sub-cellular compartments to be the most likely mechanism by which the disease is initiated. Somatically mutated B cells likely most efficiently capture self-antigen(s) and present lysosomally derived peptides on HLA class II in disease lesions and repeatedly polarize activated CD4+ T cells in tissue sites to assume a CD4+CTL phenotype. Activated innate and adaptive immune cells secreting IFN-γ may induce HLA class II expression on mesenchymal cells. Activated CD4+CTLs may induce apoptotic death of these mesenchymal cells and also secrete IL-1β and TGF-β, and thus assist in an overexuberant tissue repair process involving macrophages, fibroblasts and myofibroblasts (Figure 8). The release of generally sequestered cytosolic or nuclear proteins from dying mesenchymal may result in a further break in tolerance, epitope spreading and cross-presentation of these antigens by dendritic cells in the draining lymph node to activate self-reactive CD8+ T cells. These cells then expand and are recruited to the sites of disease where they amplify the apoptotic death of target cells (Figure 8). Activation-induced cell death likely attenuates the expanded CD4+CTL and CD8+CTL clones in these lesions.
Tying the CD8+CTL response observed in IgG4-RD to the therapeutic efficacy of B cell depletion also requires further consideration. The most likely scenario is the two-step model described above, wherein B cells activate CD4+CTLs that are the initiators of the disease and CD8+CTLs are secondarily activated and contribute to an amplification process (Figure 8). We had previously reported that circulating CD4+CTL numbers decline following B cell depletion therapy in IgG4-RD (Mattoo, 2016). However, no evidence exists at present for CD8+ T cell attenuation after B cell depletion and the in vivo relevance of the CD8+ T cell expansion to disease pathogenesis therefore remains unclear. We do observe a significant correlation between effector CD8+CTL expansion in the blood and serum IgG4 levels (Figure S10), providing a correlative suggestion that B cell responses and CD8+CTL expansion may be linked. The presentation of self-antigens by HLA class I molecules on B cells to CD8+ T cells has been demonstrated in the context of autoimmune disease40, so a potential direct link between B cells and CD8+ T cells in disease lesions might still be considered a possibility. We expect that the eventual identification of antigens recognized by clonally expanded CD4+CTLs and CD8+CTLs in IgG4-RD will provide clarity regarding these possible mechanisms.
In summary, the studies presented here suggest that cytotoxic T cells from both CD4+ and CD8+ lineages may induce apoptotic cell death in IgG4-RD lesions and that this potentially contributes to the pathogenesis of IgG4-RD. These findings may have broad implications for the mechanisms that underlie immune-mediated fibrosis. The precise dissection of effector CD4+CTL and CD8+CTL subsets in the context of IgG4-RD will facilitate subsequent work in the discovery of relevant cognate self- or exogenous peptides driving the adaptive immune responses observed in IgG4-RD. This work further expands on the possibility that recurrent immune-mediated apoptosis of cells within chronically inflamed tissues may act as a mechanism that generates fibrosis.
Supplementary Material
Acknowledgements
Funding: This work was supported by the NIH Autoimmune Centers of Excellence U19 AI 110495 to SP. CAP was supported by a Rheumatology Research Foundation Scientist Development Award and a Sponsored Research Agreement with UCB. TM was supported by JSPS JP18KK0260 and the Takeda Science Foundation. JK was supported by a Work Visit Grant of the Amsterdam Infection and Immunity Institute. VSM was supported by AI113163 from the NIH. MG was supported by NIAID P30AI060354. EDT was supported by the Giovani Ricercatori Research Grant from the Cariplo Foundation. SBM was supported by a Parker B. Francis Fellowship and a Scleroderma Foundation New Investigator Grant and JHS was supported by NIH Autoimmune Centers of Excellence UM1 AI1144295.
List of Abbreviations:
- IgG4-RD
IgG4-related disease
- CD4+CTL
CD4+ cytotoxic T lymphocytes
- CD8+CTL
CD8+ cytotoxic T lymphocytes
- GZMA
granzyme A
- GZMB
granzyme B
- PRF
perforin
- TEM
T effector/memory
- TEMRA
T effector/memory RA expressing
Footnotes
Publisher's Disclaimer: This is a PDF file of an unedited manuscript that has been accepted for publication. As a service to our customers we are providing this early version of the manuscript. The manuscript will undergo copyediting, typesetting, and review of the resulting proof before it is published in its final form. Please note that during the production process errors may be discovered which could affect the content, and all legal disclaimers that apply to the journal pertain.
Disclosure statement: The authors have declared that no conflicts of interest exist.
References:
- 1.Kamisawa T, Zen Y, Pillai S, Stone JH. IgG4-related disease. Lancet. 2015;385:1460–71. [DOI] [PubMed] [Google Scholar]
- 2.Stone JH, Zen Y, Deshpande V. IgG4-related disease. N Engl J Med. 2012;366:539–51. [DOI] [PubMed] [Google Scholar]
- 3.Wallace ZS, Naden RP, Chari S, Choi HK, Della-Torre E, Dicaire J-F, et al. The 2019 American College of Rheumatology/European League Against Rheumatism classification criteria for IgG4-related disease. Ann Rheum Dis. 2020;79:77–87. [DOI] [PubMed] [Google Scholar]
- 4.Deshpande V, Zen Y, Chan JK, Yi EE, Sato Y, Yoshino T, et al. Consensus statement on the pathology of IgG4-related disease. Mod Pathol. 2012;25:1181–92. [DOI] [PubMed] [Google Scholar]
- 5.Carruthers MN, Topazian MD, Khosroshahi A, Witzig TE, Wallace ZS, Hart PA, et al. Rituximab for IgG4-related disease: a prospective, open-label trial. Ann Rheum Dis. 2015;74:1171–7. [DOI] [PubMed] [Google Scholar]
- 6.Della-Torre E, Rigamonti E, Perugino C, Baghai-Sain S, Sun N, Kaneko N, et al. B lymphocytes directly contribute to tissue fibrosis in patients with IgG4-related disease. J Allergy Clin Immunol [Internet]. 2019; Available from: 10.1016/j.jaci.2019.07.004 [DOI] [PMC free article] [PubMed] [Google Scholar]
- 7.Mahajan VS, Mattoo H, Deshpande V, Pillai SS, Stone JH. IgG4-related disease. Annu Rev Pathol. 2014;9:315–47. [DOI] [PubMed] [Google Scholar]
- 8.Mattoo H, Mahajan VS, Maehara T, Deshpande V, Della-Torre E, Wallace ZS, et al. Clonal expansion of CD4+ cytotoxic T lymphocytes in patients with IgG4-related disease. J Allergy Clin Immunol. 2016;138:825–38. [DOI] [PMC free article] [PubMed] [Google Scholar]
- 9.Maehara T, Mattoo H, Ohta M, Mahajan VS, Moriyama M, Yamauchi M, et al. Lesional CD4+ IFN-γ+ cytotoxic T lymphocytes in IgG4-related dacryoadenitis and sialoadenitis. Ann Rheum Dis. 2017;76:377–85. [DOI] [PMC free article] [PubMed] [Google Scholar]
- 10.Della-Torre E, Bozzalla-Cassione E, Sciorati C, Ruggiero E, Lanzillotta M, Bonfiglio S, et al. A CD8α- Subset of CD4+SLAMF7+ Cytotoxic T Cells Is Expanded in Patients With IgG4-Related Disease and Decreases Following Glucocorticoid Treatment. Arthritis Rheumatol. 2018;70:1133–43. [DOI] [PMC free article] [PubMed] [Google Scholar]
- 11.Maehara T, Kaneko N, Perugino CA, Mattoo H, Kers J, Allard-Chamard H, et al. Cytotoxic CD4+ T lymphocytes may induce endothelial cell apoptosis in systemic sclerosis. J Clin Invest [Internet]. 2020; Available from: 10.1172/JCI131700 [DOI] [PMC free article] [PubMed] [Google Scholar]
- 12.van Leeuwen EMM, Remmerswaal EBM, Vossen MTM, Rowshani AT, Wertheim-van Dillen PME, van Lier RAW, et al. Emergence of a CD4+CD28− granzyme B+, cytomegalovirus-specific T cell subset after recovery of primary cytomegalovirus infection. J Immunol. 2004;173:1834–41. [DOI] [PubMed] [Google Scholar]
- 13.Appay V, Zaunders JJ, Papagno L, Sutton J, Jaramillo A, Waters A, et al. Characterization of CD4(+) CTLs ex vivo. J Immunol. 2002;168:5954–8. [DOI] [PubMed] [Google Scholar]
- 14.Patil VS, Madrigal A, Schmiedel BJ, Clarke J, O’Rourke P, de Silva AD, et al. Precursors of human CD4+ cytotoxic T lymphocytes identified by single-cell transcriptome analysis. Sci Immunol [Internet]. 2018;3 Available from: 10.1126/sciimmunol.aan8664 [DOI] [PMC free article] [PubMed] [Google Scholar]
- 15.Caielli S, Veiga DT, Balasubramanian P, Athale S, Domic B, Murat E, et al. A CD4+ T cell population expanded in lupus blood provides B cell help through interleukin-10 and succinate. Nat Med. 2019;25:75–81. [DOI] [PMC free article] [PubMed] [Google Scholar]
- 16.Schmidt D, Goronzy JJ, Weyand CM. CD4+ CD7− CD28− T cells are expanded in rheumatoid arthritis and are characterized by autoreactivity. J Clin Invest. 1996;97:2027–37. [DOI] [PMC free article] [PubMed] [Google Scholar]
- 17.Thewissen M, Somers V, Hellings N, Fraussen J, Damoiseaux J, Stinissen P. CD4+CD28null T cells in autoimmune disease: pathogenic features and decreased susceptibility to immunoregulation. J Immunol. 2007;179:6514–23. [DOI] [PubMed] [Google Scholar]
- 18.Sun Z, Zhong W, Lu X, Shi B, Zhu Y, Chen L, et al. Association of Graves’ disease and prevalence of circulating IFN-gamma-producing CD28(−) T cells. J Clin Immunol. 2008;28:464–72. [DOI] [PubMed] [Google Scholar]
- 19.Fasth AER, Dastmalchi M, Rahbar A, Salomonsson S, Pandya JM, Lindroos E, et al. T cell infiltrates in the muscles of patients with dermatomyositis and polymyositis are dominated by CD28null T cells. J Immunol. 2009;183:4792–9. [DOI] [PubMed] [Google Scholar]
- 20.Gilani SR, Vuga LJ, Lindell KO, Gibson KF, Xue J, Kaminski N, et al. CD28 downregulation on circulating CD4 T-cells is associated with poor prognoses of patients with idiopathic pulmonary fibrosis. PLoS One. 2010;5:e8959. [DOI] [PMC free article] [PubMed] [Google Scholar]
- 21.Uhal BD. Apoptosis in lung fibrosis and repair. Chest. 2002;122:293S–298S. [DOI] [PubMed] [Google Scholar]
- 22.Jun J-B, Kuechle M, Harlan JM, Elkon KB. Fibroblast and endothelial apoptosis in systemic sclerosis. Curr Opin Rheumatol. 2003;15:756–60. [DOI] [PubMed] [Google Scholar]
- 23.Tabeya T, Yamamoto M, Naishiro Y, Ishigami K, Shimizu Y, Yajima H, et al. The role of cytotoxic T cells in IgG4-related dacryoadenitis and sialadenitis, the so-called Mikulicz’s disease. Mod Rheumatol. 2014;24:953–60. [DOI] [PubMed] [Google Scholar]
- 24.Weiskopf D, Bangs DJ, Sidney J, Kolla RV, De Silva AD, de Silva AM, et al. Dengue virus infection elicits highly polarized CX3CR1+ cytotoxic CD4+ T cells associated with protective immunity. Proc Natl Acad Sci U S A. 2015;112:E4256–63. [DOI] [PMC free article] [PubMed] [Google Scholar]
- 25.Tian Y, Babor M, Lane J, Schulten V, Patil VS, Seumois G, et al. Unique phenotypes and clonal expansions of human CD4 effector memory T cells re-expressing CD45RA. Nat Commun. 2017;8:1473. [DOI] [PMC free article] [PubMed] [Google Scholar]
- 26.Fonseka CY, Rao DA, Teslovich NC, Korsunsky I, Hannes SK, Slowikowski K, et al. Mixed-effects association of single cells identifies an expanded effector CD4+ T cell subset in rheumatoid arthritis. Sci Transl Med [Internet]. 2018;10 Available from: 10.1126/scitranslmed.aaq0305 [DOI] [PMC free article] [PubMed] [Google Scholar]
- 27.Elliott MR, Koster KM, Murphy PS. Efferocytosis Signaling in the Regulation of Macrophage Inflammatory Responses. J Immunol. 2017;198:1387–94. [DOI] [PMC free article] [PubMed] [Google Scholar]
- 28.Nakamura H, Horai Y, Shimizu T, Kawakami A. Modulation of Apoptosis by Cytotoxic Mediators and Cell-Survival Molecules in Sjögren’s Syndrome. Int J Mol Sci [Internet]. 2018;19 Available from: 10.3390/ijms19082369 [DOI] [PMC free article] [PubMed] [Google Scholar]
- 29.Masago R, Aiba-Masago S, Talal N, Zuluaga FJ, Al-Hashimi I, Moody M, et al. Elevated proapoptotic Bax and caspase 3 activation in the NOD.scid model of Sjögren’s syndrome. Arthritis Rheum. 2001;44:693–702. [DOI] [PubMed] [Google Scholar]
- 30.Chattopadhyay PK, Betts MR, Price DA, Gostick E, Horton H, Roederer M, et al. The cytolytic enzymes granyzme A, granzyme B, and perforin: expression patterns, cell distribution, and their relationship to cell maturity and bright CD57 expression. J Leukoc Biol. 2009;85:88–97. [DOI] [PMC free article] [PubMed] [Google Scholar]
- 31.Strioga M, Pasukoniene V, Characiejus D. CD8+ CD28− and CD8+ CD57+ T cells and their role in health and disease. Immunology. 2011;134:17–32. [DOI] [PMC free article] [PubMed] [Google Scholar]
- 32.Sallusto F, Lenig D, Förster R, Lipp M, Lanzavecchia A. Two subsets of memory T lymphocytes with distinct homing potentials and effector functions. Nature. 1999;401:708–12. [DOI] [PubMed] [Google Scholar]
- 33.Carrasco J, Godelaine D, Van Pel A, Boon T, van der Bruggen P. CD45RA on human CD8 T cells is sensitive to the time elapsed since the last antigenic stimulation. Blood. 2006;108:2897–905. [DOI] [PubMed] [Google Scholar]
- 34.Furuichi K, Gao J-L, Murphy PM. Chemokine receptor CX3CR1 regulates renal interstitial fibrosis after ischemia-reperfusion injury. Am J Pathol. 2006;169:372–87. [DOI] [PMC free article] [PubMed] [Google Scholar]
- 35.Shimizu K, Furuichi K, Sakai N, Kitagawa K, Matsushima K, Mukaida N, et al. Fractalkine and its receptor, CX3CR1, promote hypertensive interstitial fibrosis in the kidney. Hypertens Res. 2011;34:747–52. [DOI] [PubMed] [Google Scholar]
- 36.Mattoo H, Mahajan VS, Della-Torre E, Sekigami Y, Carruthers M, Wallace ZS, et al. De novo oligoclonal expansions of circulating plasmablasts in active and relapsing IgG4-related disease. J Allergy Clin Immunol. 2014;134:679–87. [DOI] [PMC free article] [PubMed] [Google Scholar]
- 37.Perugino CA, AlSalem SB, Mattoo H, Della-Torre E, Mahajan V, Ganesh G, et al. Identification of galectin-3 as an autoantigen in patients with IgG4-related disease. J Allergy Clin Immunol. 2019;143:736–45.e6. [DOI] [PMC free article] [PubMed] [Google Scholar]
- 38.Sgonc R, Gruschwitz MS, Dietrich H, Recheis H, Gershwin ME, Wick G. Endothelial cell apoptosis is a primary pathogenetic event underlying skin lesions in avian and human scleroderma. J Clin Invest. 1996;98:785–92. [DOI] [PMC free article] [PubMed] [Google Scholar]
- 39.Green DR, Droin N, Pinkoski M. Activation-induced cell death in T cells. Immunol Rev. 2003;193:70–81. [DOI] [PubMed] [Google Scholar]
- 40.Winer DA, Winer S, Shen L, Wadia PP, Yantha J, Paltser G, et al. B cells promote insulin resistance through modulation of T cells and production of pathogenic IgG antibodies. Nat Med. 2011;17:610–7.2015;: [DOI] [PMC free article] [PubMed] [Google Scholar]
- 41.Wallace ZS, Khosroshahi A, Carruthers MD, Perugino CA, Choi H, Campochiaro C, et al. An International, Multi-Specialty Validation Study of the IgG4-Related Disease Responder Index. Arthritis Care Res [Internet]. 2018; Available from: 10.1002/acr.23543 [DOI] [PMC free article] [PubMed] [Google Scholar]
- 42.Heinle R, Chang C. Diagnostic criteria for sarcoidosis. Autoimmun Rev. 2014;13:383–7. [DOI] [PubMed] [Google Scholar]
- 43.Vitali C, Bombardieri S, Jonsson R, Moutsopoulos HM, Alexander EL, Carsons SE, et al. Classification criteria for Sjögren’s syndrome: a revised version of the European criteria proposed by the American-European Consensus Group. Ann Rheum Dis. 2002;61:554–8. [DOI] [PMC free article] [PubMed] [Google Scholar]
- 44.Ecker RC, Steiner GE. Microscopy-based multicolor tissue cytometry at the single-cell level. Cytometry A. 2004;59:182–90. [DOI] [PubMed] [Google Scholar]
- 45.Parekh S, Ziegenhain C, Vieth B, Enard W, Hellmann I. zUMIs - A fast and flexible pipeline to process RNA sequencing data with UMIs. Gigascience [Internet]. 2018;7 Available from: 10.1093/gigascience/giy059 [DOI] [PMC free article] [PubMed] [Google Scholar]
- 46.Trombetta JJ, Gennert D, Lu D, Satija R, Shalek AK, Regev A. Preparation of Single-Cell RNA-Seq Libraries for Next Generation Sequencing. Curr Protoc Mol Biol. 2014;107:4.22.1–17. [DOI] [PMC free article] [PubMed] [Google Scholar]
- 47.Mamedov IZ, Britanova OV, Zvyagin IV, Turchaninova MA, Bolotin DA, Putintseva EV, et al. Preparing unbiased T-cell receptor and antibody cDNA libraries for the deep next generation sequencing profiling. Front Immunol. 2013;4:456. [DOI] [PMC free article] [PubMed] [Google Scholar]
- 48.Newman AM, Liu CL, Green MR, Gentles AJ, Feng W, Xu Y, et al. Robust enumeration of cell subsets from tissue expression profiles. Nat Methods. 2015;12:453–7. [DOI] [PMC free article] [PubMed] [Google Scholar]
Associated Data
This section collects any data citations, data availability statements, or supplementary materials included in this article.