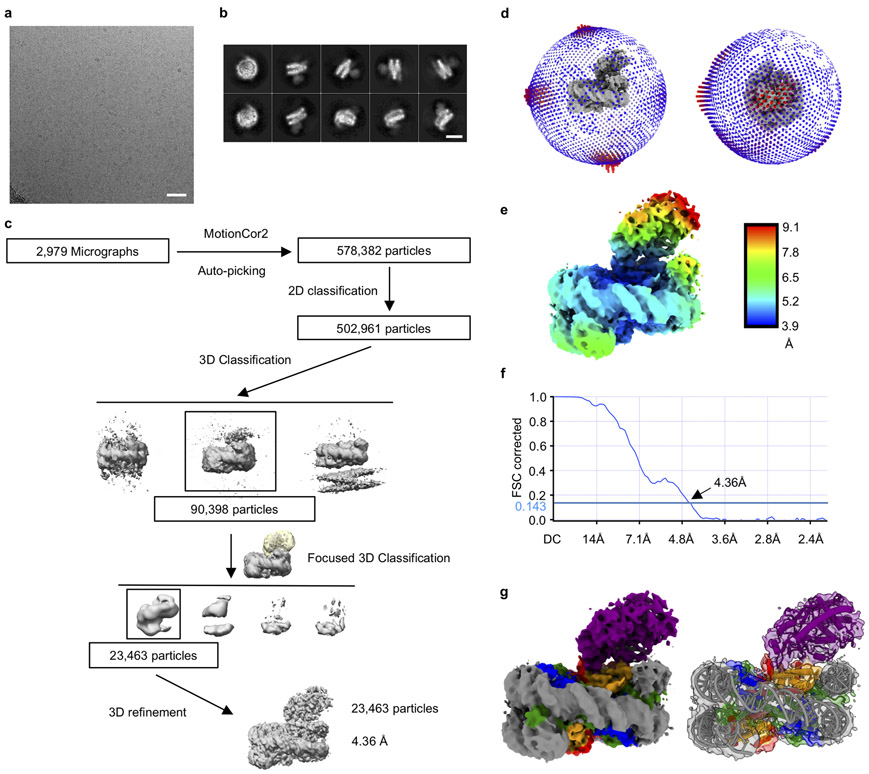
Extended data Figure 5. Cryo-EM analysis of mcGAS domain in complex with nucleosome purified from HEK 293T cells.
a. Representative micrograph of mcGAS-nucleosome complex in vitrified ice. The scale bar denotes 50 nm.
b. 2D class averages of mcGAS-nucleosome complex particles. The scale bar denotes 10 nm.
c. Flowchart of data processing; see Methods for details.
d. Angular distribution of particles included in the final reconstruction.
e. Final 3D reconstruction, colored according to the local resolution.
f. Corrected Gold-standard Fourier shell correlation curves for the 3D electron microscopy reconstruction.
g. Density map (contoured at 3 σ) and structural model of cGAS-nucleosome (1:1) complex.

